When using mplfinance, we can get a variety of image styles by setting the parameter style. The commonly used built-in styles of the style parameter are: 'bias',' blueskies', 'brasil', 'charles',' checkers', 'classic', 'default', 'mike', 'nightclouds',' sas', 'stars and strings',' yahoo '.
Many of these built-in styles follow the habits of US stocks. Red indicates decline and leek (green) indicates rise. This is just the opposite of our A-share display habit.
When these styles can not meet our needs, or we have more beautiful inspiration and creation, we can also define our own styles.
We use MPF make_ mpf_ Style() function to set a new style, and then pass it to MPF Just use the parameter of style plot ().
The first step is to pull the data as usual:
# Transfer the stock price data of muyuan shares (002714.SZ) from tushare
import tushare as ts
import pandas as pd
import mplfinance as mpf
token = 'Your token'   # Enter your interface key, access method and relevant permissions. See Tushare official website.
pro = ts.pro_api(token)
df = pro.daily(ts_code='002714.SZ')

# The DataFrame object is then processed into a format suitable for our use
df = df.loc[:, ['trade_date', 'open', 'high', 'low', 'close', 'vol']]
df.rename(
    columns={
        'trade_date': 'Date', 'open': 'Open',
        'high': 'High', 'low': 'Low',
        'close': 'Close', 'vol': 'Volume'},
    inplace=True)       # Redefine the column name to facilitate unified and standardized operation.
df['Date'] = pd.to_datetime(df['Date'])  # Convert the format of date column to facilitate drawing
df.set_index(['Date'], inplace=True)  # Date column as row index
df = df.sort_index()  # In reverse order, because the data of Tushare is the data of the latest trading day, which is displayed above the DataFrame. In reverse order, it can ensure that the time series of X-axis increases from left to right during mapping.
The second step is to use MPF make_ Marketcolors() function to set the color information of K-line. The result of this setting will be passed to MPF as an argument later make_ mpf_ Style() to set the custom style.
mc = mpf.make_marketcolors(
    up="red",  # Color of rising K line
    down="green",  # Color of falling K line
    edge="black",  # Color of candle box
    volume="blue",  # Color of trading volume column
    wick="black"  # Color of shadow line in candle chart
)

# There is also a parameter called alpha, which sets the candlestick face, with a value between 0.1-1. This setting is the color depth of the K-line candle. For example, when alpha is set to 0.6, the red candle becomes close to orange. Green becomes emerald green. Just try and choose according to your senses.
After mc is set, we will pass it to MPF make_ mpf_ The marketcolors parameter of style () to set the custom style.
The third step is to set the custom style.
Use MPF make_ mpf_ The style function has the following parameters:
-
base_mpf_style: inherit the built-in style. If you don't want to inherit, you don't need to set it. We don't set it here, just rely on customization.
-
mavcolors to set the moving average style, you must use the list parameter
-
facecolor sets the foreground color (coordinate system color)
-
edgecolor sets the border style
-
figcolor sets the fill color of the outer periphery of the image
-
gridcolor sets the color of gridlines
-
gridaxis sets the direction of grid lines. both directions are 'horizontal' horizontal and 'vertical'
-
gridstyle sets the gridline type, for example
'-'/'solid', '–'/'dashed', '-.'/'dashdot', ':'/'dotted', None/' '/'' -
y_on_right sets whether the y-axis position is on the right
-
rc uses the dict setting style of rcParams. If the content is the same as the above custom setting, the custom setting overrides the rcParams setting
This parameter is commonly written as:
rc={'font.family': 'SimHei', 'axes.unicode_minus': 'False'}
It is used to solve the problems of Chinese random code and non display of negative numbers of images generated by mplfinance library. -
marketcolors is the attribute of the K-line we defined in the previous step. Just pass it in.
s = mpf.make_mpf_style(
    gridaxis='both',
    gridstyle='-.',
    y_on_right=True,
    marketcolors=mc,
    edgecolor='b',
    figcolor='r',
    facecolor='y',
    gridcolor='c')
Step 4: start using MPF Plot() draws and passes in the style s set above
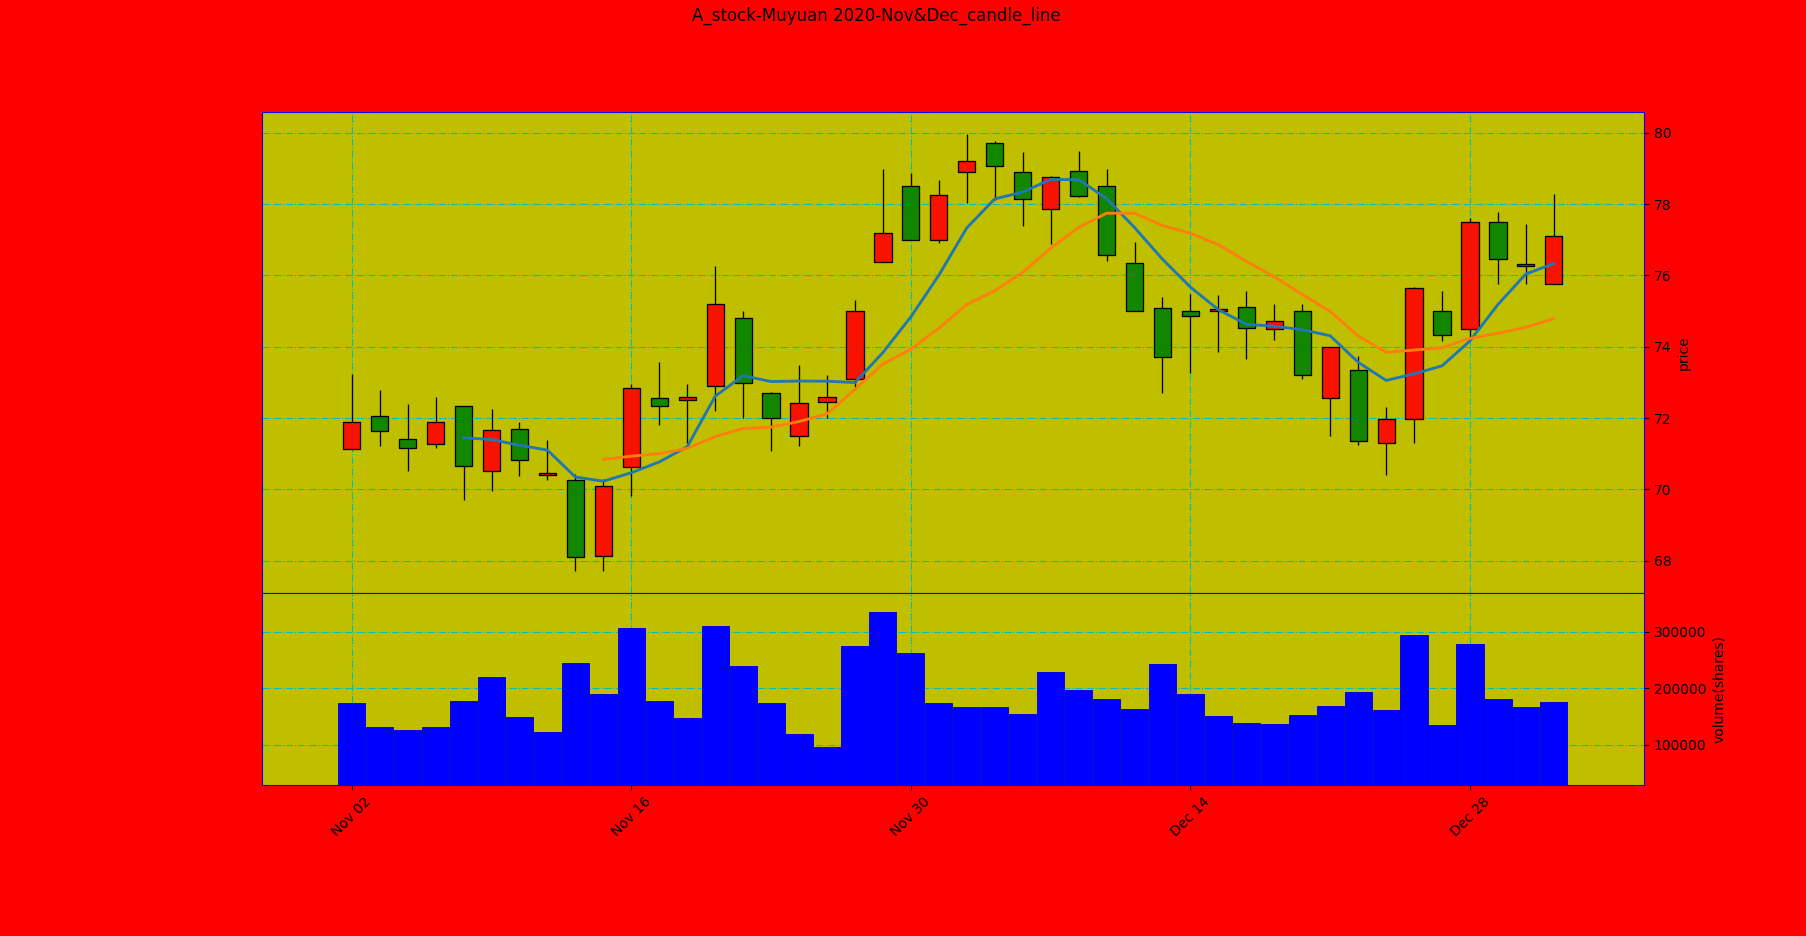
mpf.plot(df.loc['2020-11': '2020-12'], type='candle', ylabel="price", style=s, title='A_stock-Muyuan 2020-Nov&Dec_candle_line', mav=(5, 10), volume=True, ylabel_lower="volume(shares)")
The final effect is shown in the figure:
Er... After looking for it for a long time, it seems that there is a disadvantage in the mplfinance library.
The source code searched for a long time and did not find the parameters of the picture that can customize the background image,
Perhaps considering that financial quantification does not need a second dimension.
This is undoubtedly a big blow to the second yuan house.
Forget it, Matplotlib Although the sentence of pyplot is longer, it's still very good, ha ha ha.