I Instructions before installation
-
The following steps are operated in centos 7 in VMware. The ip address is 192.168.161.128;
Note that it's best to unify the version when installing, otherwise many problems will appear later. Search the official website for the corresponding image and check the version under the Tags tag. At present, my latest Tags is 7.12.1, so the version number is uniformly added when pulling the image. Official website image address
-
Before setting up an ELK, Docker needs to be familiar with the relevant instructions of Docker, such as copying container file docker cp, forcibly deleting container: docker rm -f container id, creating network: docker network create elk, viewing logs: docker logs container, etc.
-
To facilitate the attachment of subsequent files, first create the following directory / usr/local/elk, and then execute mkdir /usr/local/elk/{elasticsearch,kibana,logstash} to create three corresponding directories. Therefore, the following operations are performed under / usr/local/elk unless otherwise specified.
-
In order to communicate between containers, you need to create a network with docker: docker network create elk.
II Install Docker
You can install docker step by step according to the official website. It's very simple.
Install Docker Engine on CentOS
After installation, you can see the following version: docker -v
View docker details: docker info
III Docker installation ElasticSearch
1. Search, download and view images
# Search image
docker search elasticsearch
# Pull the image of version 7.12.1
docker pull elasticsearch:7.12.1
# View all mirrors
docker images
2. Copy the configuration file
# Run elasticsearch
docker run -d --name es --net elk -P -e "discovery.type=single-node" elasticsearch:7.12.1
# Enter the container to view the configuration file path
docker exec -it es /bin/bash
cd config
In config, you can see elasticsearch YML configuration file, and then execute pwd. You can see that the current directory is: / usr/share/elasticsearch/config, so exit the container and execute the copy of the file:
# Copy the / search / elask configuration file into the / elastr / local container
docker cp es:/usr/share/elasticsearch/config/elasticsearch.yml elasticsearch/

# Modify file permissions
chmod 666 elasticsearch/elasticsearch.yml

# Create the data directory under the elasticsearch directory and modify the permissions at the same time
chmod -R 777 elasticsearch/data
Note: the permission of the file to be modified here is writable. Otherwise, after mounting, modify the configuration file externally, and the configuration file inside the container will not be changed. At the same time, create a data directory for mounting.
3. Re run the container and mount:
# Delete the old container first
docker rm -f es

# Run new container
docker run -d --name es \
--net elk \
-p 9200:9200 -p 9300:9300 \
-e "discovery.type=single-node" \
--privileged=true \
-v $PWD/elasticsearch/elasticsearch.yml:/usr/share/elasticsearch/config/elasticsearch.yml \
-v $PWD/elasticsearch/data/:/usr/share/elasticsearch/data \
elasticsearch:7.12.1
explain:
- -p (lowercase) mapping port number, host port: container port
- -P (uppercase) specifies the port number for the container at random
- -v mount the container
- – name specifies the container alias
- – net connection to the specified network
- -e specifies the environment variable when starting the container
- -d background running container
- – privileged=true enables the container to mount directories
4. View container
# View containers in operation
docker ps

# View container log
docker logs es

curl localhost:9200
If the log is correct, you can use curl ip:9200 to view the results, or you can use the browser to enter http://ip:9200 see. At this point, the elasticsearch installation is complete.
At the same time, we can see the data in the container in the data directory, and the modifications in the host will also be synchronized to the interior of the container.
IV Docker installation elasticsearch head (optional)
Note: This is the visual interface of ES. It is convenient to check whether the log has been successfully entered into es during later debugging. For items that do not have to be installed, you can also skip this step.
1. Pull the image
docker pull mobz/elasticsearch-head:5
2. Operation container
docker run -d --name es_admin --net elk -p 9100:9100 mobz/elasticsearch-head:5
Note: here -- net elk is used, that is, the network created between us;
If it is not created, you need to modify the configuration accessories in the next step. If it is created as before, you can skip it directly.
3. Edit profile (optional)
#Copy the configuration file to the current directory
docker cp es_admin:/usr/src/app/Gruntfile.js ./
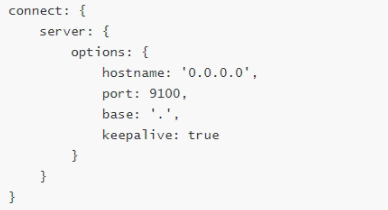
Edit the configuration file and add: hostname: '0.0.0.0' under connect - > server - > options
#Copy the file back
docker cp Gruntfile.js es_admin:/usr/src/add/
# Restart container
docker restart es_admin
Because vi and vim are not installed inside the image, it cannot be edited directly inside the container. We need to copy it and overwrite it after modification.
After restarting the container, pass http://ip:9100 Access to query the data in ES.
4. There is no data problem on the page
If the nodes and indexes are completely displayed after opening the page, but no data is displayed in the data browsing, we need to change a configuration file because the strict verification of the request header is added after ES 6 (we installed version 7.12.1):
docker cp es_admin:/usr/src/app/_site/vendor.js ./
vi vendor.js
docker cp vendor.js es_admin:/usr/src/app/_site/
There are a lot of contents in this configuration file. Here you need to understand some operations of vim:
Press ESC to enter the command mode, then: set nu displays the line number, and then: the line number jumps to the corresponding line.
Here we need to modify: (note that the whole line is not replaced)
Line 6886: contentType: "application/json;charset=UTF-8"
Line 7573: contentType === "application/json;charset=UTF-8"
After the change, copy the configuration file back to the container. You can refresh the page directly without restarting.
V Docker installation Kibana
The steps are roughly the same as elasticsearch:
1. Pull the image
docekr search kibana
docker pull kibana: 7.12.1

# Start the kibana container and connect to the same network
docker run -d --name kibana --net elk -P -e "ELASTICSEARCH_HOSTS=http://es:9200" -e "I18N_LOCALE=zh-CN" kibana:7.12.1
Note: - e "elasticsearch_hosts"= http://es:9200 "Indicates the connection to the elasticsearch container just started, because in the same network (elk), the address can be directly filled in the container name + port, that is, es: 9200 or http://192.168.161.128:9200 , i.e http://ip: Port.
2. Copy files
docker cp kibana:/usr/share/kibana/config/kibana.yml kibana/

chmod 666 kibana/kibana.yml
After copying, modify the configuration file, mainly elastissearch Hosts and add I18N Locale configuration:
- The es address is changed to the es address just installed. Because of the isolation of the container, it's best to fill in here http://ip:9200 ;
- kibana interface is in English by default, and I18N can be added to the configuration file Locale: zh CN (note that there is a space after the colon).
In this way, with the configuration file, you don't have to specify the environment variable through - e when starting the container.
#
# ** THIS IS AN AUTO-GENERATED FILE **
#

# Default Kibana configuration for docker target
server.name: kibana
server.host: "0"
# elasticsearch address
elasticsearch.hosts: [ "http://192.168.161.128:9200" ]
monitoring.ui.container.elasticsearch.enabled: true
# Open the Sinicization of kibana
i18n.locale: zh-CN
Note: if you start by mounting a configuration file, elasticsearch Hosts this needs to be filled in http://ip:9200 , instead of using the container name, otherwise kibana connection es will fail.
3. Reopen a container
#Delete the original unmounted container
docker rm -f kibana

# Start the container and mount it
docker run -d --name kibana \
-p 5601:5601 \
-v $PWD/kibana/kibana.yml:/usr/share/kibana/config/kibana.yml \
--net elk \
kibana:7.12.1
4. View results
Open the browser and enter: http://ip:5601 Open kibana console. If it fails to open successfully, you can use: docker logs kibana to check the container log to see if it runs incorrectly, etc.
Please refer to the official website: Install Kibana with Docker
Vi Docker installation LogStash
Continue to install Logtash as above:
1. Pull the image and copy the configuration
docker pull logstash:7.12.1

docker run -d -P --name logstash --net elk logstash:7.12.1

# Copy data
docker cp logstash:/usr/share/logstash/config logstash/
docker cp logstash:/usr/share/logstash/data logstash/
docker cp logstash:/usr/share/logstash/pipeline logstash/

#Folder empowerment
chmod -R 777 logstash/
2. Modify the corresponding configuration file
- Modify logstash.config under logstash/config YML file, mainly modify the address of es:
http.host: "0.0.0.0"
xpack.monitoring.elasticsearch.hosts: [ "http://192.168.161.128:9200" ]
- Modify logstash. Under logstash/pipeline Conf file:
input {
  tcp {
    mode => "server"
    host => "0.0.0.0"  # Allow any host to send logs
    port => 5044
    codec => json_lines    # data format
  }
}

output {
  elasticsearch {
      hosts  => ["http://192.168.161.128:9200 "] # elasticsearch address and port
      index  => "elk"         # Specify index name
      codec  => "json"
  }
  stdout {
    codec => rubydebug
  }
}
3. Start the container and mount it
#Note to delete the previous container first
docker rm -f logstash

# Mount and mount the container
docker run -d --name logstash --net elk \
--privileged=true \
-p 5044:5044 -p 9600:9600 \
-v $PWD/logstash/data/:/usr/share/logstash/data \
-v $PWD/logstash/config/:/usr/share/logstash/config \
-v $PWD/logstash/pipeline/:/usr/share/logstash/pipeline \
logstash:7.12.1
4. View log
docker logs -f logstash
Every time you start the container, you'd better check the log to facilitate the subsequent steps. If there is a problem, you can see which problem is and solve it easily.
VII Create springboot application
This is relatively simple, mainly including several configuration files:
- pom.xml file, introducing the dependency of logstash:
<dependency>
        <groupId>net.logstash.logback</groupId>
        <artifactId>logstash-logback-encoder</artifactId>
        <version>6.6</version>
</dependency>
- Create a log / logback spring XML file under resource, which we mainly fill in here
< destination > IP: Port < / destination >, and the < pattern > label can be modified according to personal usage.
<?xml version="1.0" encoding="UTF-8"?>
<configuration>
    <include resource="org/springframework/boot/logging/logback/base.xml" />
    <appender name="LOGSTASH" class="net.logstash.logback.appender.LogstashTcpSocketAppender">
        <destination>192.168.161.128:5044</destination>
        <!-- Log output code -->
        <encoder charset="UTF-8" class="net.logstash.logback.encoder.LogstashEncoder">
            <providers>
                <timestamp>
                    <timeZone>UTC</timeZone>
                </timestamp>
                <pattern>
                    <pattern>
                        {
                        <!--es Index name -->
                        "index":"elk",
                        <!--apply name -->
                        "appname":"${spring.application.name}",
                        <!--Print time -->
                        "timestamp": "%d{yyyy-MM-dd HH:mm:ss.SSS}",
                        <!--Thread name -->
                        "thread": "%thread",
                        <!--log level -->
                        "level": "%level",
                        <!--Log name -->
                        "logger_name": "%logger",
                        <!--log information -->
                        "message": "%msg",
                        <!--Log stack -->
                        "stack_trace": "%exception"
                        }
                    </pattern>
                </pattern>
            </providers>
        </encoder>
    </appender>
    <root level="INFO">
        <appender-ref ref="LOGSTASH" />
        <appender-ref ref="CONSOLE" />
    </root>
</configuration>
- Finally, modify the application YML file:
logging:
  config: classpath:log/logback-spring.xml
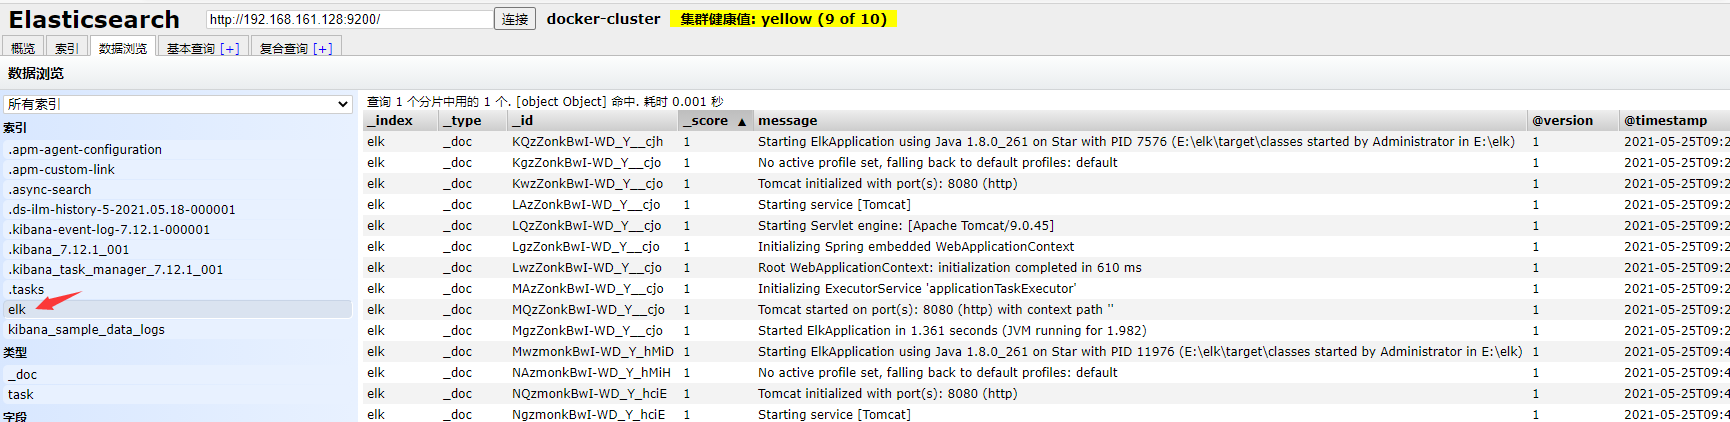
After startup, you can see the output log in the elastic search head interface:
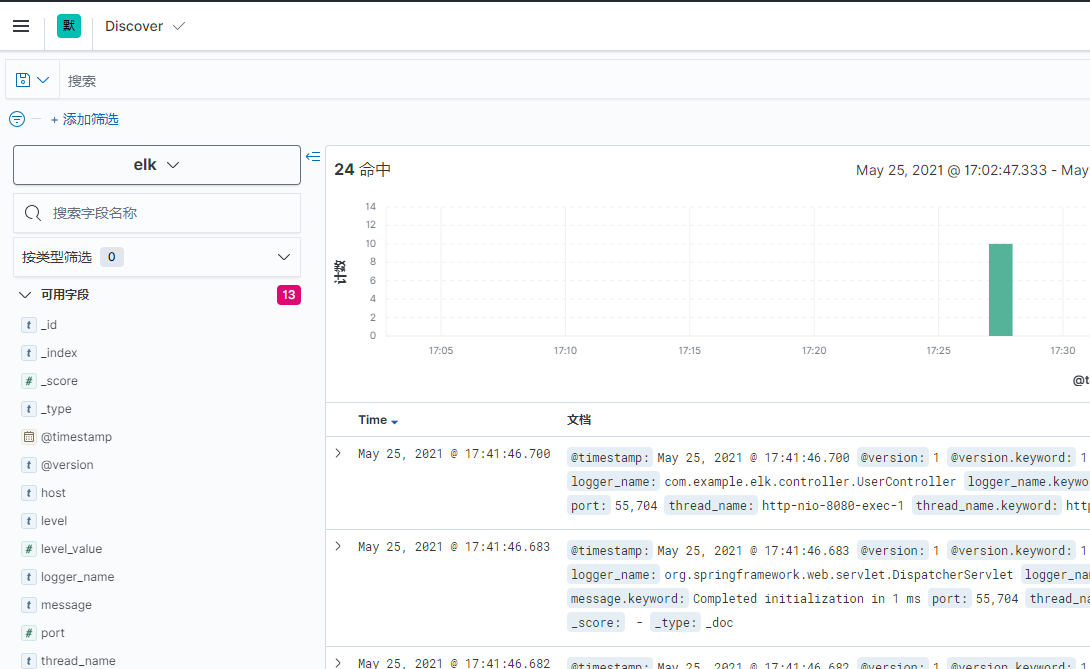
At the same time, you can see the index elk added on kibana page:
So far, the process of building an elk with Docker has been completed.
VII Postscript
During the construction of ELK, the following problems are encountered, which are hereby recorded:
1. Insufficient docker pull memory
Since I built it on centos 7 installed by VMware, the memory attached to the root directory is small when installing the system. Therefore, when docker pulls the image, it will prompt that there is insufficient memory at the Logstash step and I don't want to reinstall the system. Therefore, you can change the default directory of container volume download by editing docker's configuration file.
# View the default download address of docker
docker info | grep "Docker Root Dir"

# Create directory
mkdir /home/docker-root

# Edit profile
vi /usr/lib/systemd/system/docker.service
Editing docker In the Service configuration file, find ExecStart under the [Service] node and add: - graph = / home / docker root after it. Docker root is the directory just created:
[Service]
ExecStart=/usr/bin/dockerd --graph=/home/docker-root
Finally, restart docker:
systemctl daemon-reload
systemctl restart docker
systemctl enable docker
2.Logstash port mapping
Edit logstash When using the conf file, it should be noted that the exposed ports also need container mapping, otherwise the springboot will not be connected to logstash, such as:
input {
  tcp {
    mode => "server"
    host => "0.0.0.0"  # Allow any host to send logs
    port => 5044
    codec => json_lines    # data format
  }
}
Here, any host is allowed to send logs through port 5044. When starting the container, you need -p 5044:5044 to map out the port at the same time, otherwise the springboot will not be connected to logstash during startup.
3. Insufficient memory when starting the container
When starting elasticsearch or logstash container, there may be insufficient memory. We can modify the memory allocation by editing and modifying the specified file:
# Find JVM Options file
find / -name jvm.options
Find the corresponding JVM Options modifies - Xms (minimum memory) and - Xmx (maximum memory) in the file.
Or when you start the elasticsearch container, you can directly add the environment variables as shown below, but the logstash is not found at present. You can modify the JVM Options to modify.
-e "ES_JAVA_OPTS=-Xms1g -Xmx1g"