Nagios is a commonly used open source monitoring software. Nagios is flexible and portable so that it can be used flexibly according to its actual situation. However, Nagios has a disadvantage that the drawing is not perfect enough, so Nagios has a short board when analyzing monitoring data. However, because of the flexibility of Nagios, Nagios can display graphical reports in other ways. Today, I will briefly talk about the official Nagiosgraph plug-in, which is implemented by Perl. So when using the Nagiosgraph plug-in, we need to ensure that Perl is installed in the system and the corresponding cpan source is configured, so that we can install it. Source configuration has been mentioned before, but it is not explained here. You can refer to it if you need to: http://jim123.blog.51cto.com/4763600/1895093 . Nagiosgraph plug-in's official download address: https://sourceforge.net/projects/nagiosgraph/files/ It is recommended to download the latest stable version. Before installing and deploying, it is necessary to check whether there are dependency packages needed to install plug-ins in the system.
[root@localhost nagiosgraph-1.5.2]# perl install.pl --check-prereq#Like this, all plug-ins are installed.
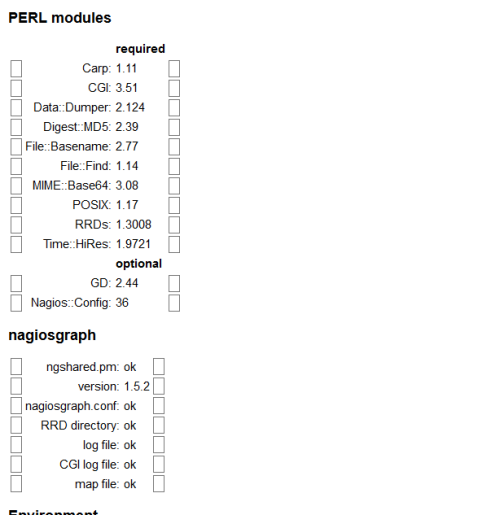
checking required PERL modules
  Carp...1.11
  CGI...3.51
  Data::Dumper...2.124
  Digest::MD5...2.39
  File::Basename...2.77
  File::Find...1.14
  MIME::Base64...3.08
  POSIX...1.17
  RRDs...1.3008
  Time::HiRes...1.9721
checking optional PERL modules
  GD...2.44
  Nagios::Config...36
checking nagios installation
  found nagios exectuable at /usr/local/nagios/bin/nagios
  found nagios init script at /etc/init.d/nagios
checking web server installation
  found apache executable at /usr/sbin/httpd
  found apache init script at /etc/init.d/httpd
If you find out which one is not installed, it is recommended to install after configuring yum source or apt source, such as GD drawing installation:
[root@localhost nagiosgraph-1.5.2]# yum -y install perl-GD
There is usually a lack of Nagios::Config module installed under Perl, which is installed using cpan after configuring the cpan source.
[root@localhost nagiosgraph-1.5.2]# cpan Nagios::Config#Note that sometimes there is a lack of Digest::MD5 modules installed in the same order.
After resolving all dependencies, you can start to install the configuration. When installing, you will be prompted with the default option to press Enter directly to proceed to the next step.
[root@localhost nagiosgraph-1.5.2]# perl install.pl
After installation, you should pay attention to it. Finally, you will be prompted to make some configuration changes and operation methods in Nagios, such as:
# process nagios performance data using nagiosgraph
process_performance_data=1
service_perfdata_file=/tmp/perfdata.log
service_perfdata_file_template=$LASTSERVICECHECK$||$HOSTNAME$||$SERVICEDESC$||$SERVICEOUTPUT$||$SERVICEPERFDATA$
service_perfdata_file_mode=a
service_perfdata_file_processing_interval=30
service_perfdata_file_processing_command=process-service-perfdata-for-nagiosgraph
#Modify the Nagios configuration file and add it to nagios.cfg

/bin/systemctl restart  httpd.service


  * In the nagios commands file (command.cfg),
    add these lines:

# command to process nagios performance data for nagiosgraph
define command {
  command_name process-service-perfdata-for-nagiosgraph
  command_line /usr/local/nagiosgraph/bin/insert.pl
}
#Add and modify command.cfg configuration file

  * In the apache configuration file (httpd.conf),
    add this line:

Include /usr/local/nagiosgraph/etc/nagiosgraph-apache.conf
#Add the inclusion of nagiosgraph to the httpd configuration file for Nagios
  * Check the nagios configuration:

/usr/local/nagios/bin/nagios -v /path/to/nagios.cfg

  * Restart nagios to start data collection:

/etc/init.d/nagios restart

  * Restart apache to enable display of graphs:

/etc/init.d/httpd restart
#Finally, configure after multiple checks restart
  * To enable graph links and mouseovers, see README sections:
       Displaying Per-Service and Per-Host Graph Icons and Links
       Displaying Graphs in Nagios Mouseovers
Open the page configuration check page as Nagios: http://IP/nagiosgraph/cgi-bin/showconfig.cgi 
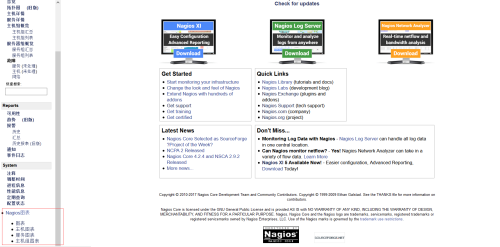
After confirming that there is no problem, go to the share folder of Nagios and modify the PHP page file side.php of Nagios to add the link of Nagiosgraph to make pseudo-static page:
<?php $nagiosgraph_path = '/nagiosgraph/cgi-bin';?>
<li><a >Nagios Chart</a></li>

<ul>

<li><a href="<?php echo $nagiosgraph_path;?>/show.cgi" target="<?php echo $link_target;?>">Chart</a></li>
<li><a href="<?php echo $nagiosgraph_path;?>/showhost.cgi" target="<?php echo $link_target;?>">Host diagram</a></li>
<li><a href="<?php echo $nagiosgraph_path;?>/showservice.cgi" target="<?php echo $link_target;?>">Service chart</a></li>
<li><a href="<?php echo $nagiosgraph_path;?>/showgroup.cgi" target="<?php echo $link_target;?>">Host group chart</a></li>

</ul>
</li>
Finally, under the Nagios page, there is a graph link for Nagiosgraph s. 
According to the host and service to be selected, the configuration of Nagiosgraph depends on Perl configuration or is relatively simple, but the generated graph is not very perfect, but it can also satisfy some simple daily analysis, but if it needs better, it can be implemented by other software or plug-ins, Nagiosgraph display.
