summary:
What is a sequential database?
What is a time series database? The simplest definition is that the data format contains the data of Timestamp field, such as the temperature of a certain time environment, CPU utilization, etc. However, what data does not contain Timestamp? In fact, almost all data can be marked with a Timestamp field. A more important attribute of time series data is how to query it, including data filtering, calculation and so on.
As the mainstream sequential database, influxdb has strong performance. It is mainly used for monitoring equipment in NetDevOps.
lnfluxdb is an open source distributed time series, time and index database, which is written in go language without external dependence. It has three characteristics:
- Time series: flexible use of time related functions (such as maximum, minimum, summation, etc.);
- Metrics: calculate a large amount of real-time data;
- Event: it supports any event data. In other words, we can operate on the data of any event.
To install InfluxDB:
Install using docker compose:
influxdb.yaml:
version: '3'
services:
  # influxdb container
  influxDB:
    image: "influxdb"
    user: root
    environment:
      - INFLUXDB_DB=devdb   # database
      - INFLUXDB_ADMIN_USER=admin
      - INFLUXDB_ADMIN_PASSWORD=Cisc0123
      - INFLUXDB_USER=devdbuser
      - INFLUXDB_USER_PASSWORD=Cisc0123
    volumes:
      - /influx/influxdb:/var/lib/influxdb  # Data volume
      - /network_protocal/practice_work/influx_db/init-influxdb.sh:/docker-entrypoint-initdb.d/init-influxdb.sh  # Initialization script
    networks:
      - influx_net  # network
    ports:
      - "8086:8086"
    restart: always

  # Making graphical interface with grafana
  grafana:
    # Image name
    image: "grafana/grafana"
    user: root
    volumes:
      - /influx/grafana:/var/lib/grafana
    networks:
      - influx_net
    # Open port
    ports:
      - "3000:3000"
    depends_on:
      - "influxDB"
    restart: always

# Create network
networks:
  influx_net:
    driver: bridge
init-influxdb.sh: initialize the script and configure the policy of storing data in devdb database. The default data is stored for 3 weeks
#!/bin/bash

set -e

influx <<-EOSQL
create retention policy "devdb_rp_policy" on "devdb" duration 3w replication 1 default
EOSQL
In influxdb Yaml use the command under the same folder to create a container:
docker-compose -f influxdb.yaml up -d
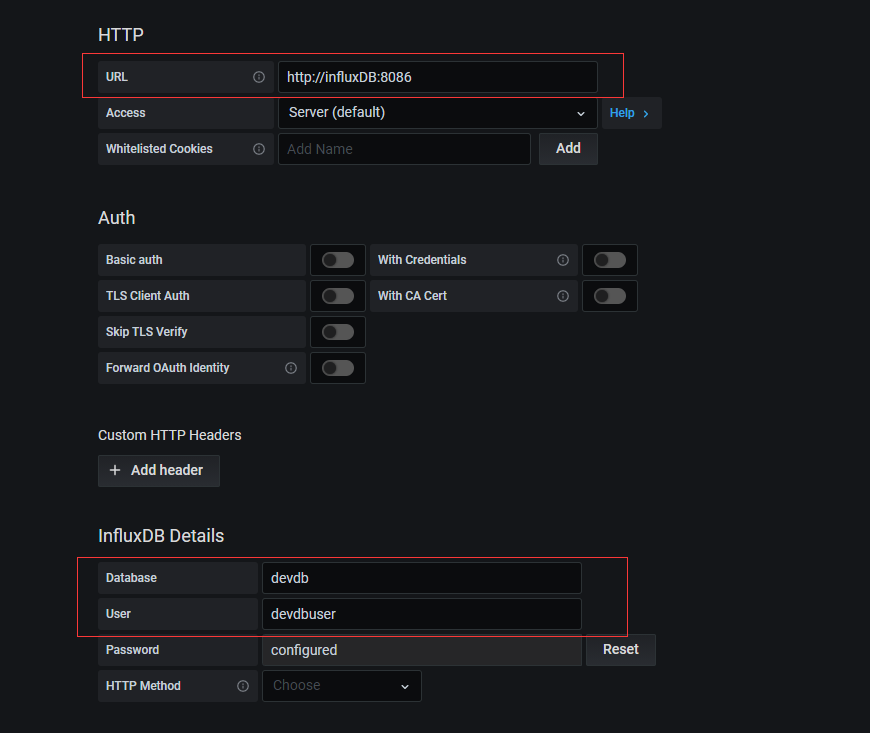
You can output on the viewer: http://192.168.0.166:3000/ , log in to grafana, and the account password is admin/admin by default. After logging in, connect to influxdb:
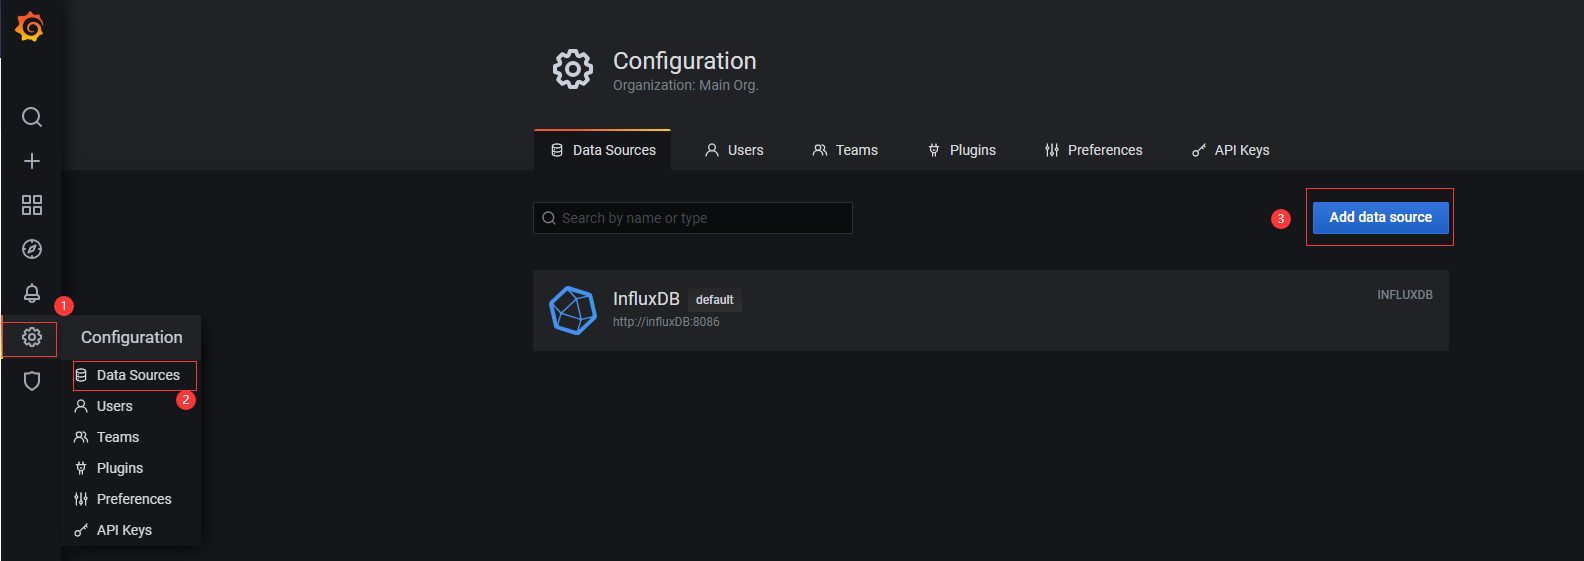
Select influxdb and fill in relevant parameters:
Basic operations of influxdb:
Note: it is recommended that the basic operations be defined when writing yaml files.
-
Enter influxdb:
docker exec -it influx_db_influxDB_1((container name) influx
-
Create database:
create database devdb
-
Use database:
use devdb
-
Create ordinary users:
CREATE USER "devdbuser" WITH PASSWORD 'Cisc0123'
-
Create administrator:
CREATE USER admin WITH PASSWORD 'Cisc0123' WITH ALL PRIVILEGES
-
Delete user:
drop user admin
-
Give ordinary users database permissions:
grant all on devdb to devdbuser
-
Create retention policies
create retention policy "devdb_rp_policy" on "devdb" duration 3w replication 1 default
-
modify
alter retention policy "devdb_rp_policy" on "devdb" duration 30d default
-
View retention policies
show retention policies on "devdb"
-
Delete retention policies
drop retention policy "devdb_rp_policy" on devdb
python practice:
Purpose of the experiment:
Use SNMP to obtain MEM utilization, write to influxdb, and then render through influxdb.
Experimental equipment:
CSR1000v, snmp has been configured, and the IP address is 192.168.0.66.
Experimental steps:
1. Test connectivity with influxdb:
influxdb_init_connect.py:
from influxdb import InfluxDBClient

influx_host = '192.168.0.166'
router_ip = "192.168.0.66"
snmp_community = "tcpipro"

if __name__ == '__main__':
    # Use the system administrator to query information
    client = InfluxDBClient(influx_host, 8086, 'admin', 'Cisc0123')

    # view the database
    print(client.get_list_database())
    # Create database
    print(client.create_database('testdb'))
    print(client.get_list_database())
    # Delete database
    print(client.drop_database('testdb'))
    print(client.get_list_database())

    # Using devdbuser to view information
    client = InfluxDBClient(influx_host, 8086, 'devdbuser', 'Cisc0123', 'devdb')
    measurements_result = client.query('show measurements;')  # Displays the tables in the database
    print(f"Result: {format(measurements_result)}")

    retention_result = client.query('show retention policies on "devdb";')  # Displays the tables in the database
    print(f"Result: {format(retention_result)}")
Test result: it can connect to devdb in influxdb.

2. Prepare snmpv2_get function:
snmpv2_get.py:
from pysnmp.hlapi import *


def snmpv2_get(ip, community, oid, port=161):
    # Varbindings is a list, and the type of each element in the list is ObjectType (the object of this type represents MIB variable)
    error_indication, error_status, error_index, var_binds = next(
        getCmd(SnmpEngine(),
               CommunityData(community),
               UdpTransportTarget((ip, port)),
               ContextData(),
               ObjectType(ObjectIdentity(oid)))
    )

    # error handling
    if error_indication:
        print(error_indication)
    elif error_index:
        print('%s at %s' % (
            error_status,
            error_index and var_binds[int(error_index) - 1][0] or '?'
        )
              )
        # If the returned result is more than one line, it needs to be spliced and returned
    result = ""

    for varBind in var_binds:
        # Return results
        result = result + varBind.prettyPrint()
        # The returned is a tuple, OID and string result
        # print(result)
        return result.split("=")[0].strip(), result.split("=")[1].strip()
3. Organize the data format and write the following to influxdb:
influxdb_monior_router.py:
import time
import datetime
from snmpv2_get import snmpv2_get
from influxdb import InfluxDBClient
from influxdb_init_connect import router_ip, snmp_community, influx_host


client = InfluxDBClient(influx_host, 8086, 'devdbuser', 'Cisc0123', 'devdb')

while True:
    # ----------------------Write memory data------------------------

    # cpmCPUMemoryUsed
    mem_usage = snmpv2_get(router_ip, snmp_community, "1.3.6.1.4.1.9.9.109.1.1.1.1.12.7", port=161)
    # cpmCPUMemoryFree
    mem_free = snmpv2_get(router_ip, snmp_community, "1.3.6.1.4.1.9.9.109.1.1.1.1.13.7", port=161)
	# Format UTC time
    current_time = datetime.datetime.utcnow().isoformat("T")

    # Organization data information
    cpu_mem_body = [
        {
            "measurement": "router_monitor",
            "time": current_time,
            "tags": {
                "device_ip": router_ip,
                "device_type": "IOS-XE"
            },
            "fields": {
                "mem_usage": int(mem_usage[1]),
                "mem_free": int(mem_free[1]),
            },
        }
    ]

    # Collect data information every five seconds and write it to influxdb
    client.write_points(cpu_mem_body)
    time.sleep(5)
The data information here is a list, which can store multiple JSON data:
- "measurement": "router_monitor", which is the table name;
- “time”: current_time is a timestamp and must exist;
- The "tags" field is convenient for searching;
- The "fields" field is the recorded data information and cannot be retrieved.
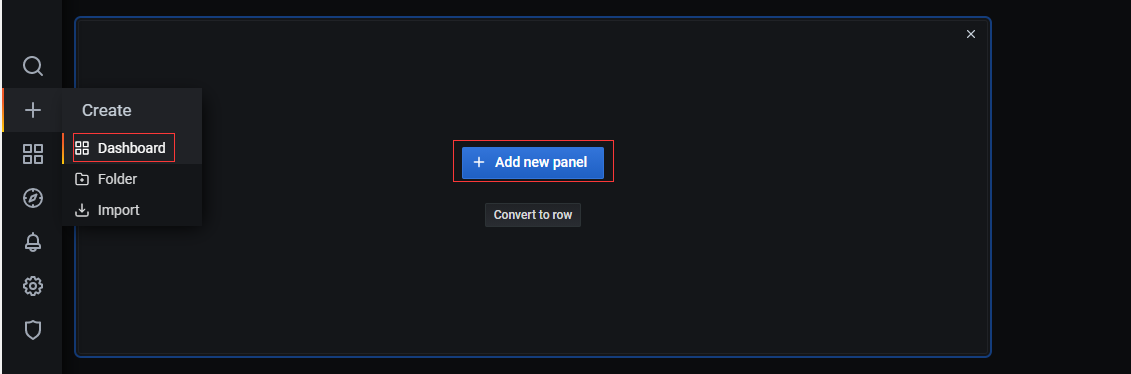
4. Create dashboard in grafana:
Create a dashboard using SQL statements:
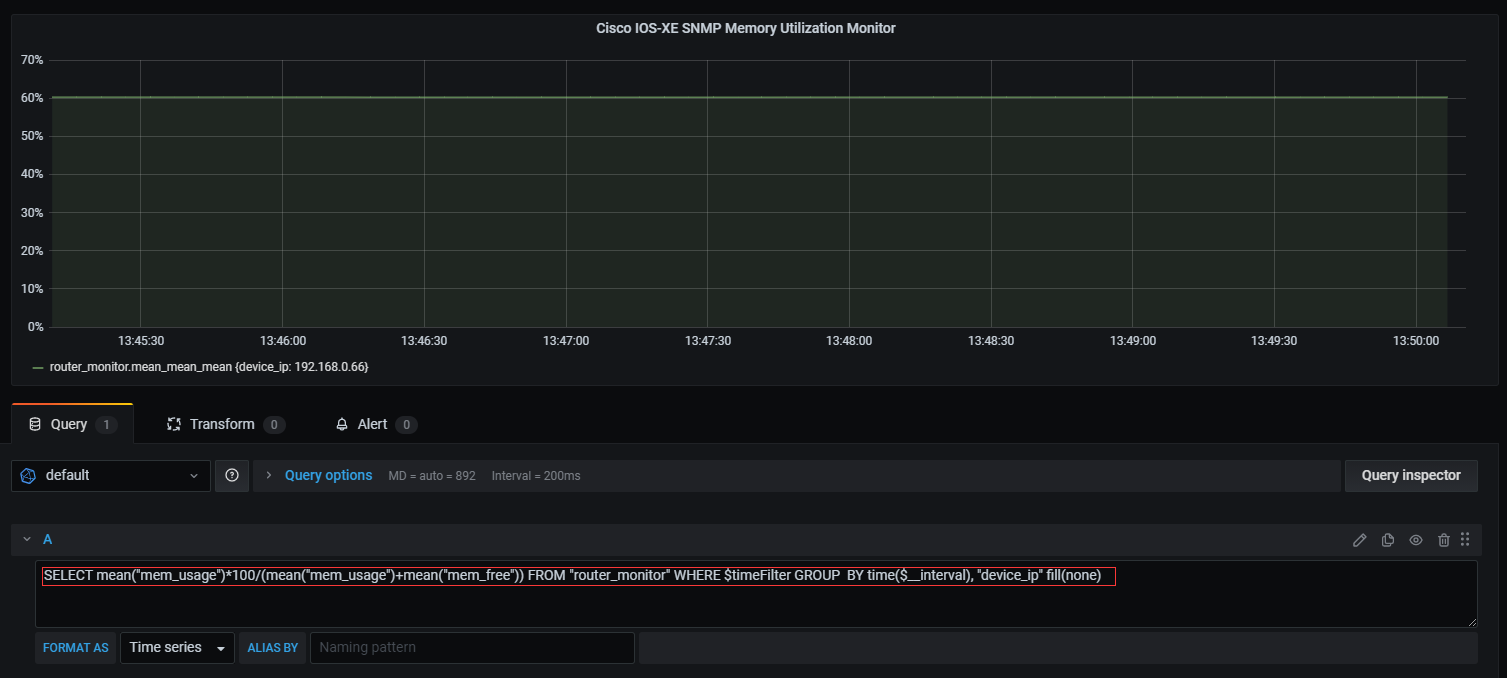
The statement is as follows:
SELECT mean("mem_usage")*100/(mean("mem_usage")+mean("mem_free")) FROM "router_monitor" WHERE $timeFilter GROUP BY time($__interval), "device_ip" fill(none)
reference material:
https://www.bilibili.com/video/BV1SV41127HU?from=search&seid=13988085653859648559