The installation method of Nightingale has been discussed before, and then it will enter the stage of use.
text
Article environment
- Nightingale V5 three
- node_exporter 1.3.1
- telegraf 1.21.3
- CentOS 7.9
Node exporter section
Node exporter is the official collector of promethues, and its installation method is very simple.
Download the node exporter package
Because github domestic access is sometimes prone to reset, the source of Nanjing University is adopted.
wget https://s3.jcloud.sjtu.edu.cn/899a892efef34b1b944a19981040f55b-oss01/github-release/prometheus/node_exporter/releases/download/v1.3.1/node_exporter-1.3.1.linux-amd64.tar.gz
Unzip the node exporter package
Finally, we get a binary file.
mkdir /opt/node_exporter
mv node_exporter-1.3.1.linux-amd64.tar.gz /opt/node_exporter
cd /opt/node_exporter/
tar xzvf node_exporter-1.3.1.linux-amd64.tar.gz
cd node_exporter-1.3.1.linux-amd64/
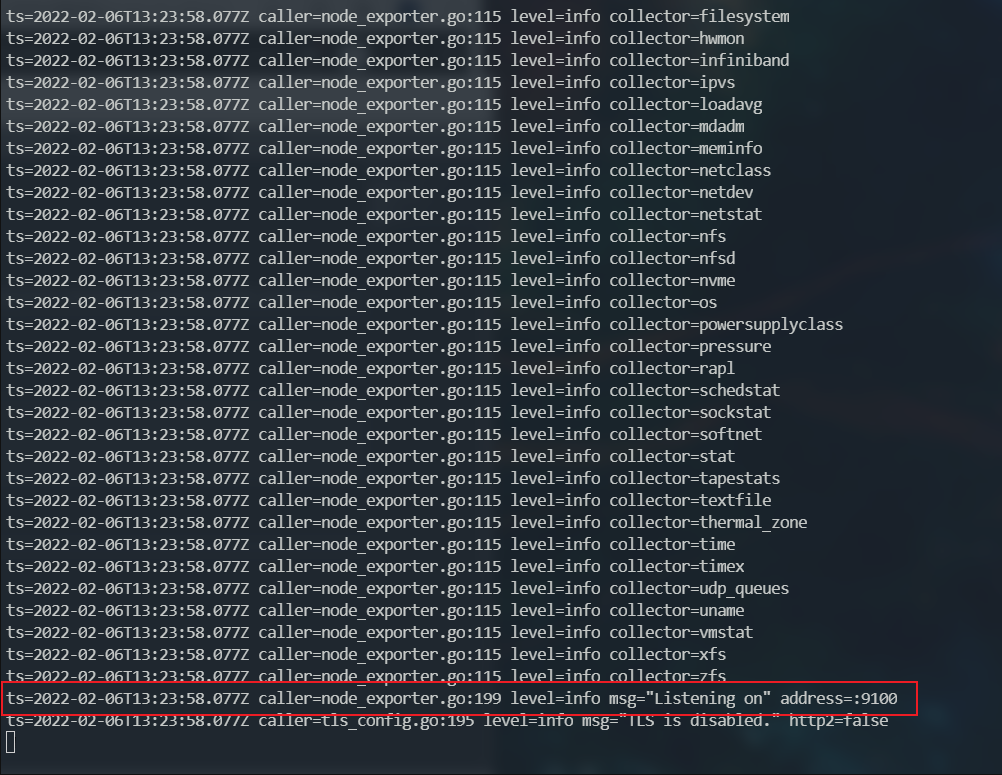
Run node exporter
If the word "Listening on" appears, it is normal
./node_exporter
Promethues configuration
Find Prometheus YML, because everyone's environment is different, the address of the file is also different. Here we only demonstrate the configuration. Finally, we need to pay attention to the format.
- job_name: "local"
    static_configs:
      - targets: ["10.240.99.198:9100"]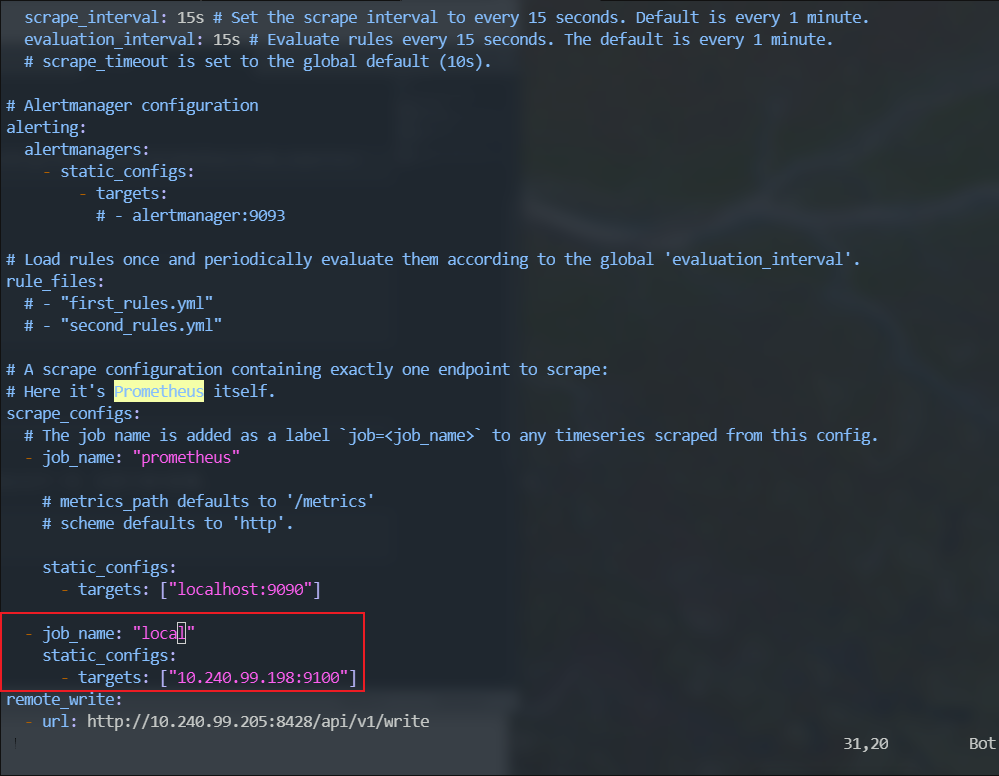
Prometheus configuration hot refresh
curl -X POST http://127.0.0.1:9090/-/reload
Configure node_ Exporter SYSTEMd daemon
mkdir /usr/local/node_exporter
mv /opt/node_exporter/node_exporter-1.3.1.linux-amd64/node_exporter /usr/local/node_exporter/
[Unit]
Description=node_exporter
After=network.target

[Service]
Type=simple
User=root
ExecStart=/usr/local/node_exporter/node_exporter
Restart=on-failure

[Install]
WantedBy=multi-user.target
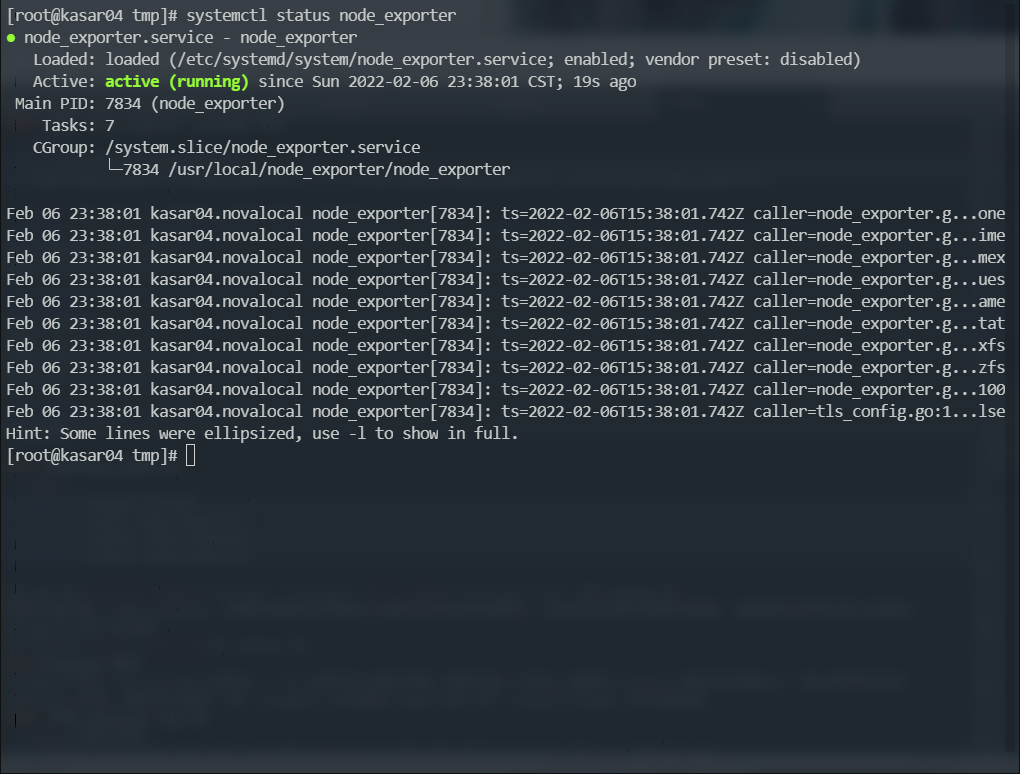
Start node_exporter
systemctl daemon-reload
systemctl start node_exporter
systemctl enable node_exporter
systemctl status node_exporter
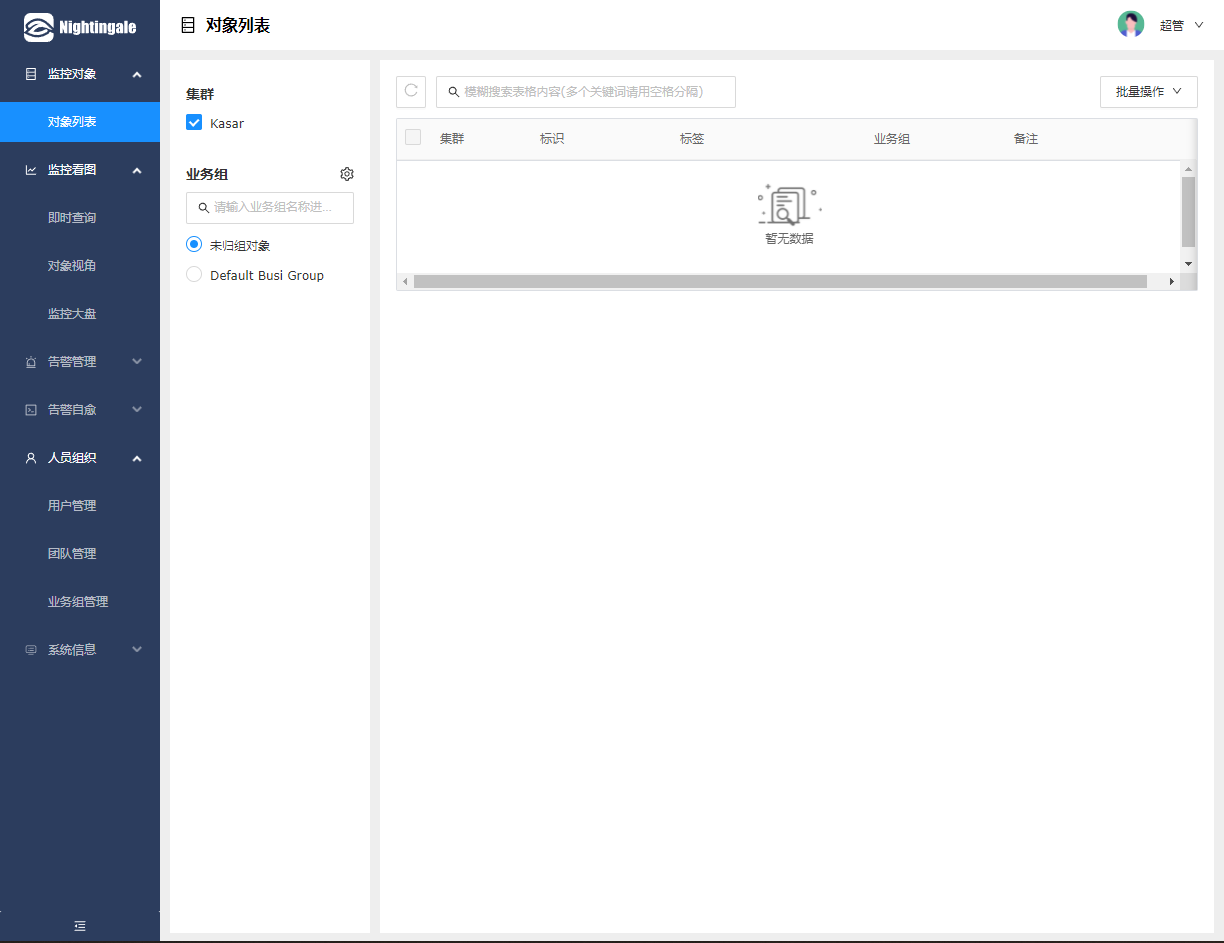
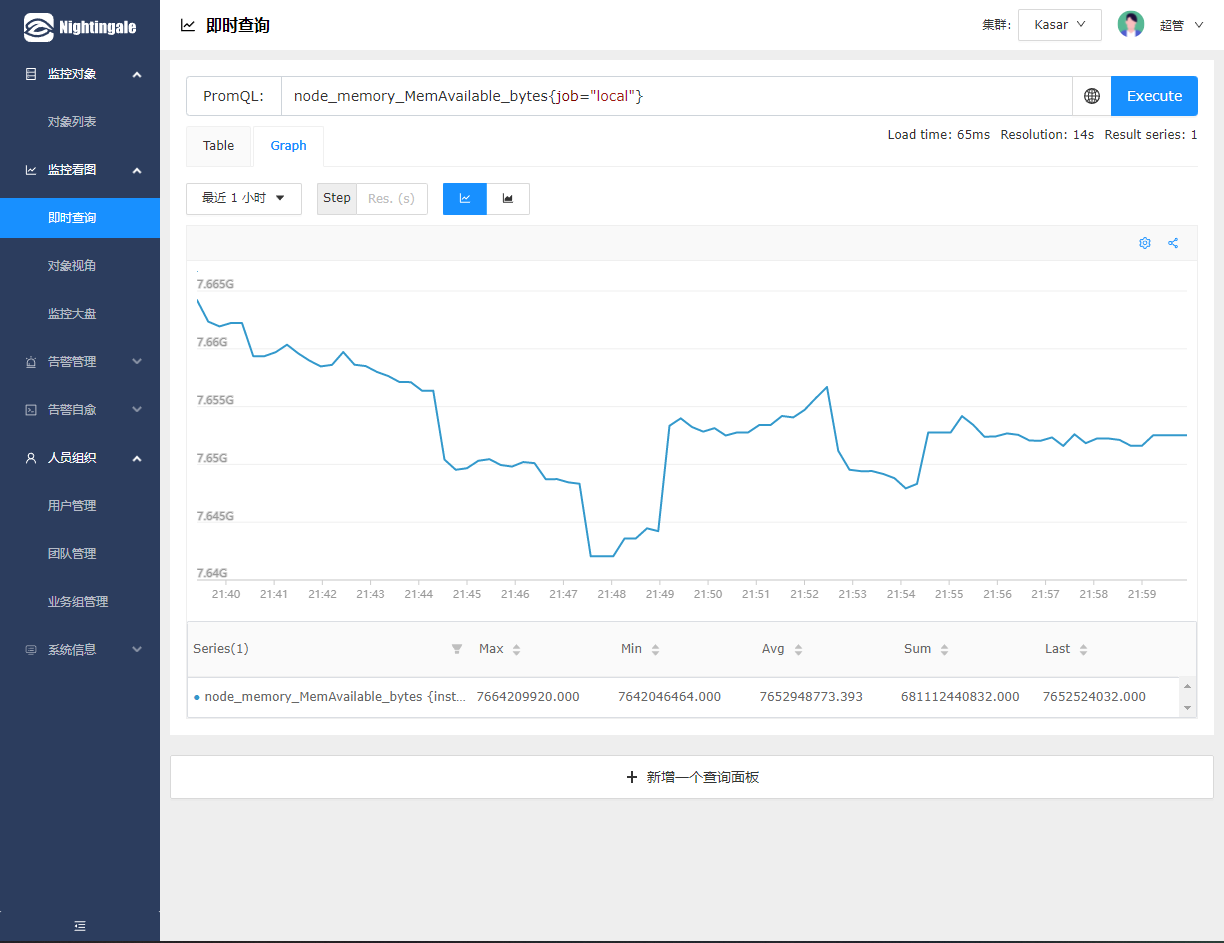
Note that node_ The data collected by the exporter cannot be seen in the Nightingale, but in the object list. The data can only be seen in the real-time query. If you want to see the resource list, you can only monitor it by telegraf.
telegraf section
Telegraf is an all-in-one architecture. A binary system can handle various collection capabilities such as machines, network devices, middleware, databases and Statsd. Compared with scattered exporters, the maintenance cost is lower. Telegraf supports docking with Nightingale through the output plugin OpenTSDB.
Download the telegraf rpm package
wget https://mirrors.nju.edu.cn/influxdata/yum/el8-x86_64/telegraf-1.21.3-1.x86_64.rpm
Install telegraf
yum localinstall telegraf-1.21.3-1.x86_64.rpm -y
Modify telegraf configuration
Empty the original configuration and paste the following configuration. The places that need to be modified are host and port. Fill in them according to your own situation.
[global_tags]

[agent]
  interval = "10s"
  round_interval = true
  metric_batch_size = 1000
  metric_buffer_limit = 10000
  collection_jitter = "0s"
  flush_interval = "10s"
  flush_jitter = "0s"
  precision = ""
  hostname = ""
  omit_hostname = false

[[outputs.opentsdb]]
  host = "http://10.240.99.198"
  port = 19000
  http_batch_size = 50
  http_path = "/opentsdb/put"
  debug = false
  separator = "_"

[[inputs.cpu]]
  percpu = true
  totalcpu = true
  collect_cpu_time = false
  report_active = true

[[inputs.disk]]
  ignore_fs = ["tmpfs", "devtmpfs", "devfs", "iso9660", "overlay", "aufs", "squashfs"]

[[inputs.diskio]]

[[inputs.kernel]]

[[inputs.mem]]

[[inputs.processes]]

[[inputs.system]]
  fielddrop = ["uptime_format"]

[[inputs.net]]
  ignore_protocol_stats = true
Restart telegraf
service telegraf restart
systemctl enable telegraf
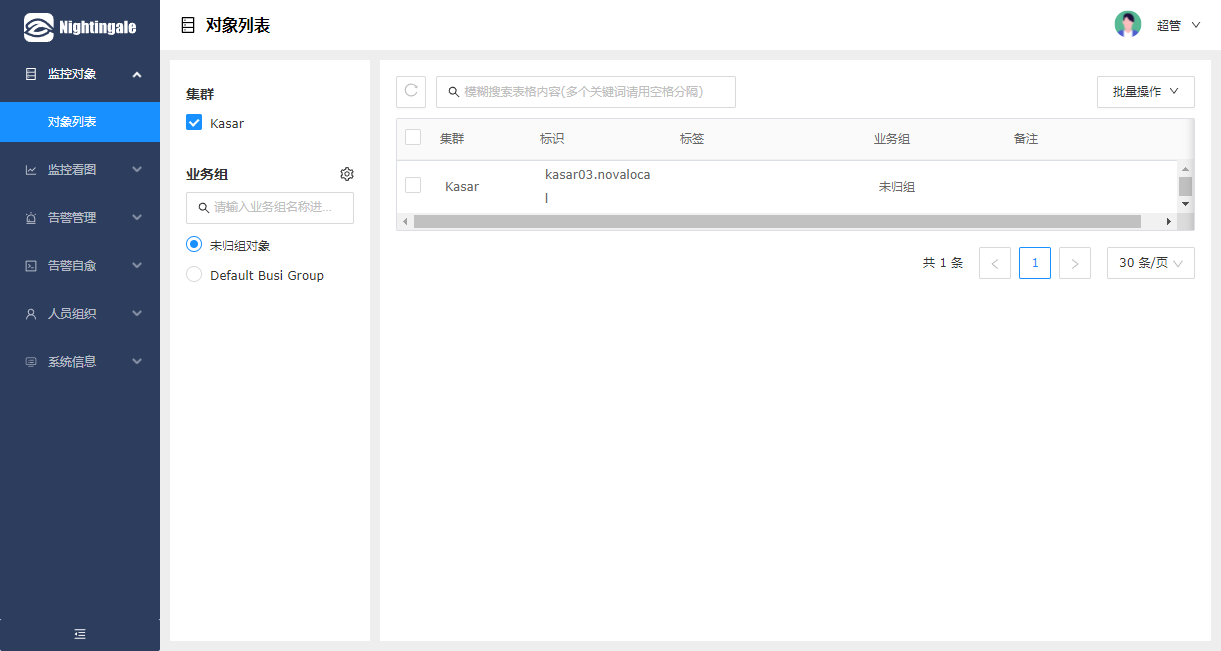
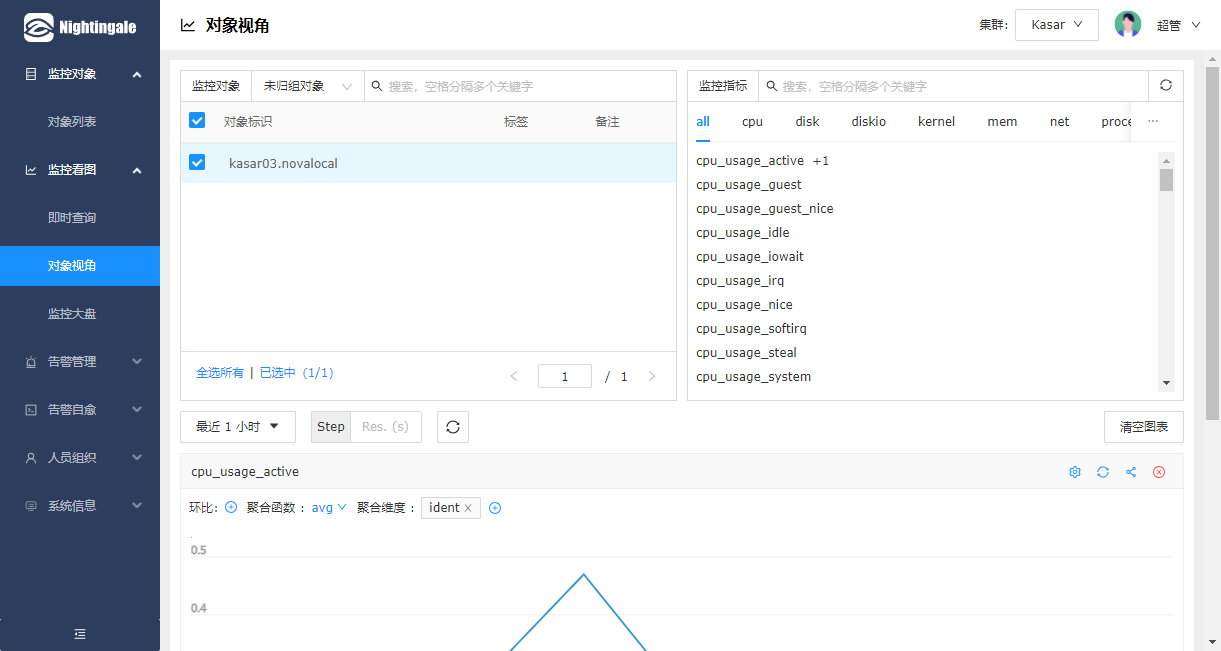
View Nightingale front end
At this point, you can see that there is a host that has just started telegraf in the ungrouped object. And the corresponding monitoring indicators can be seen in the monitoring diagram – > object perspective.
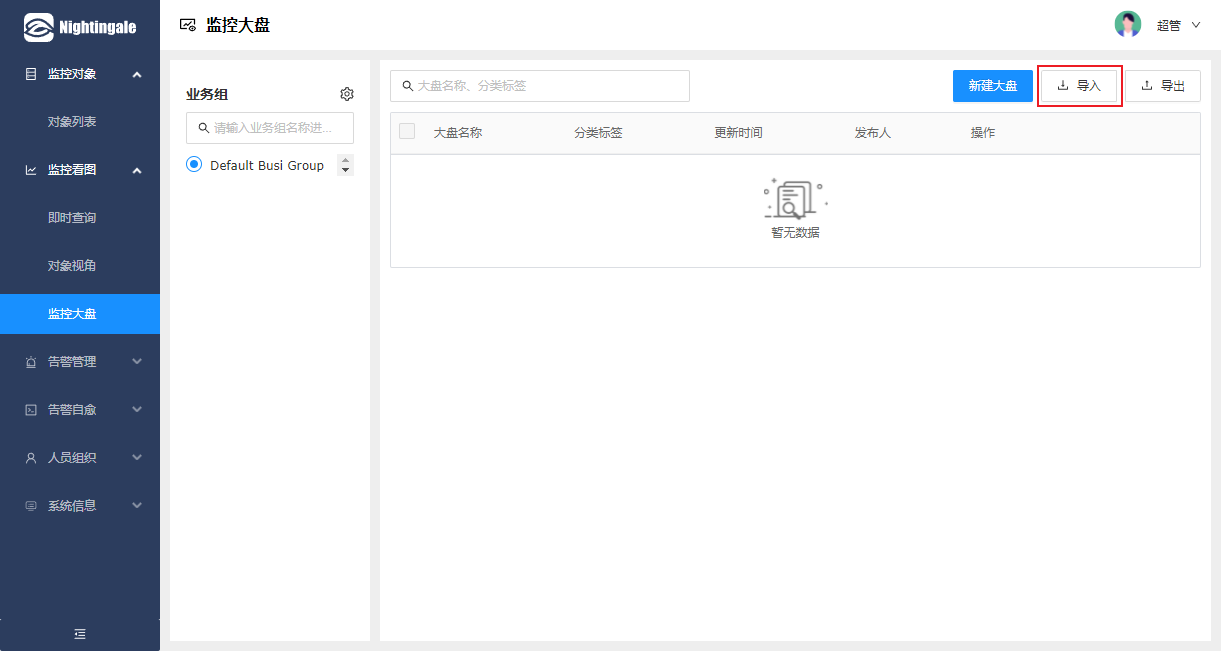
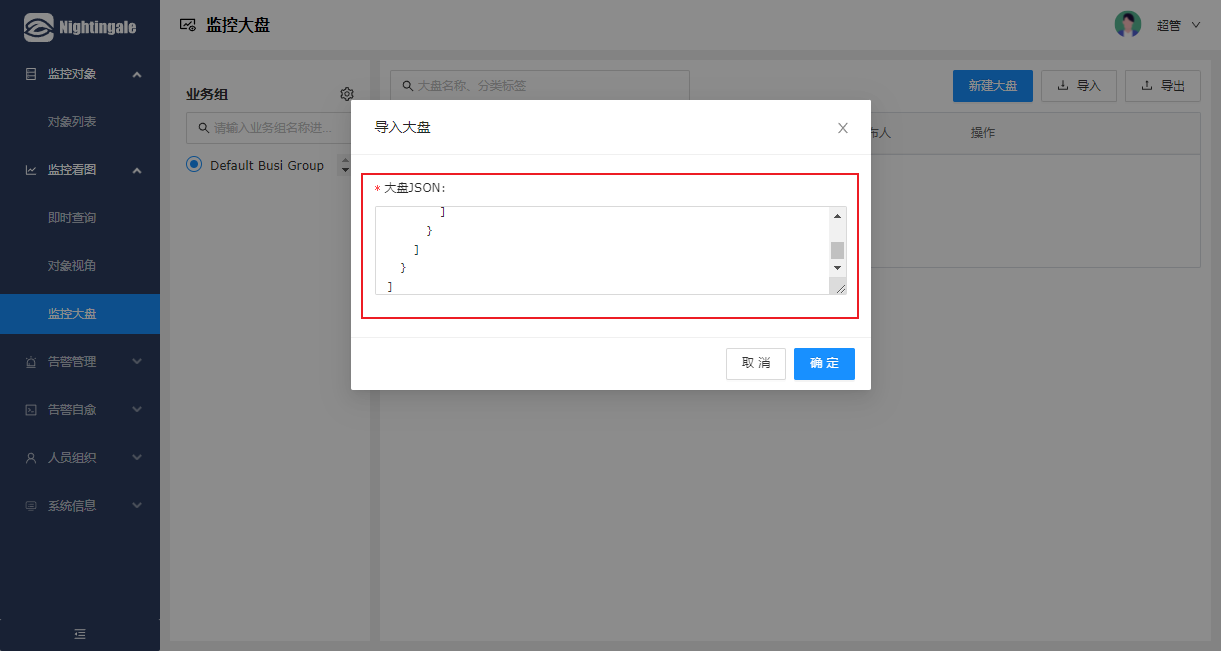
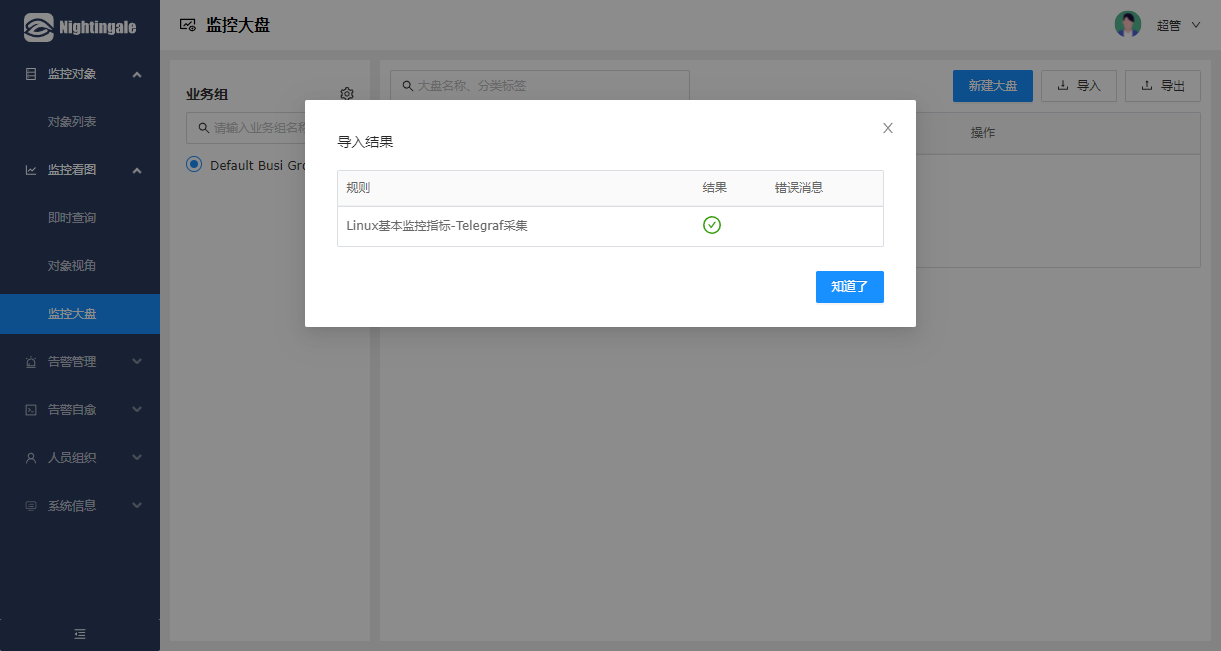
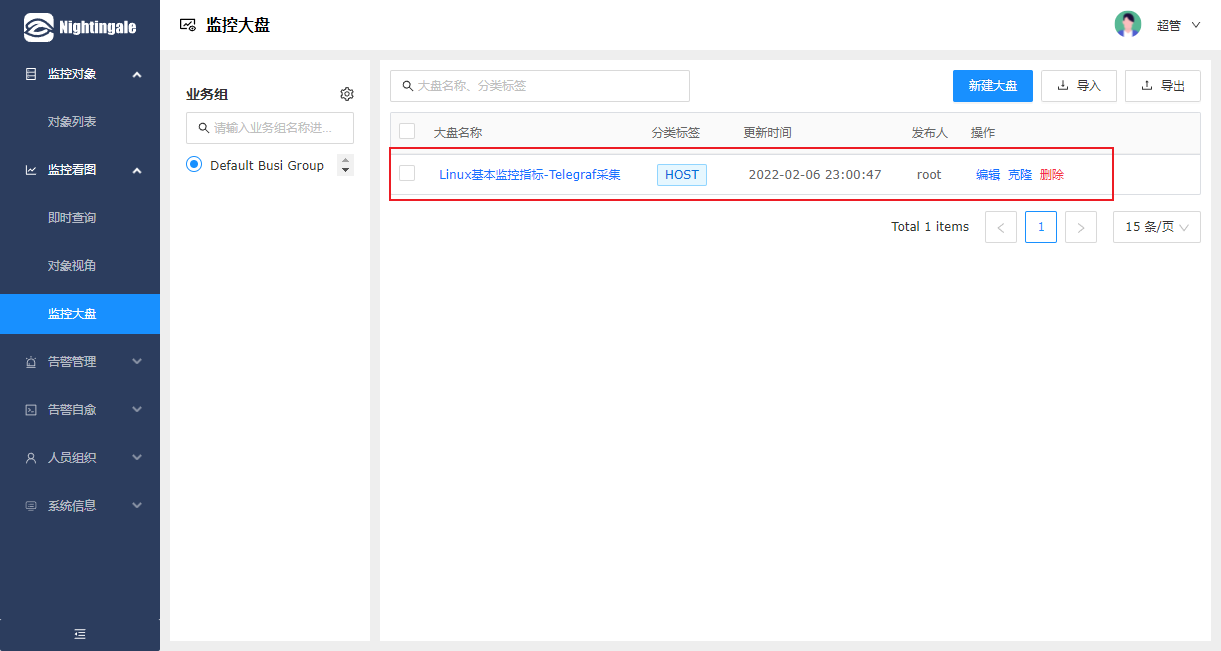
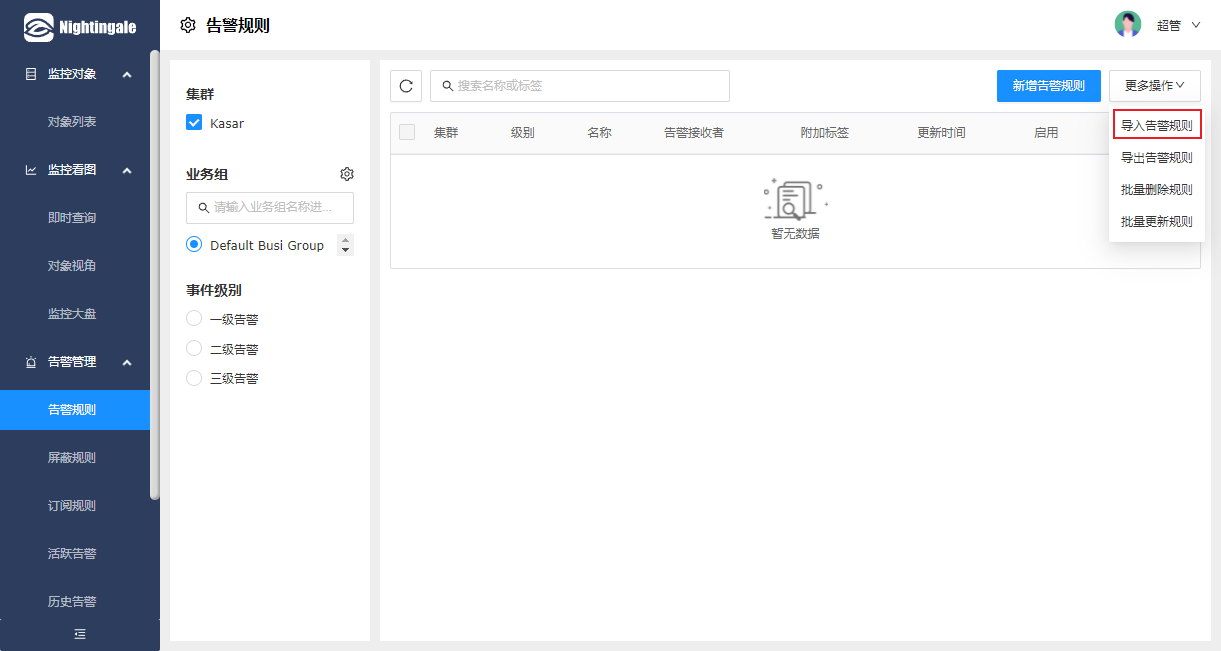
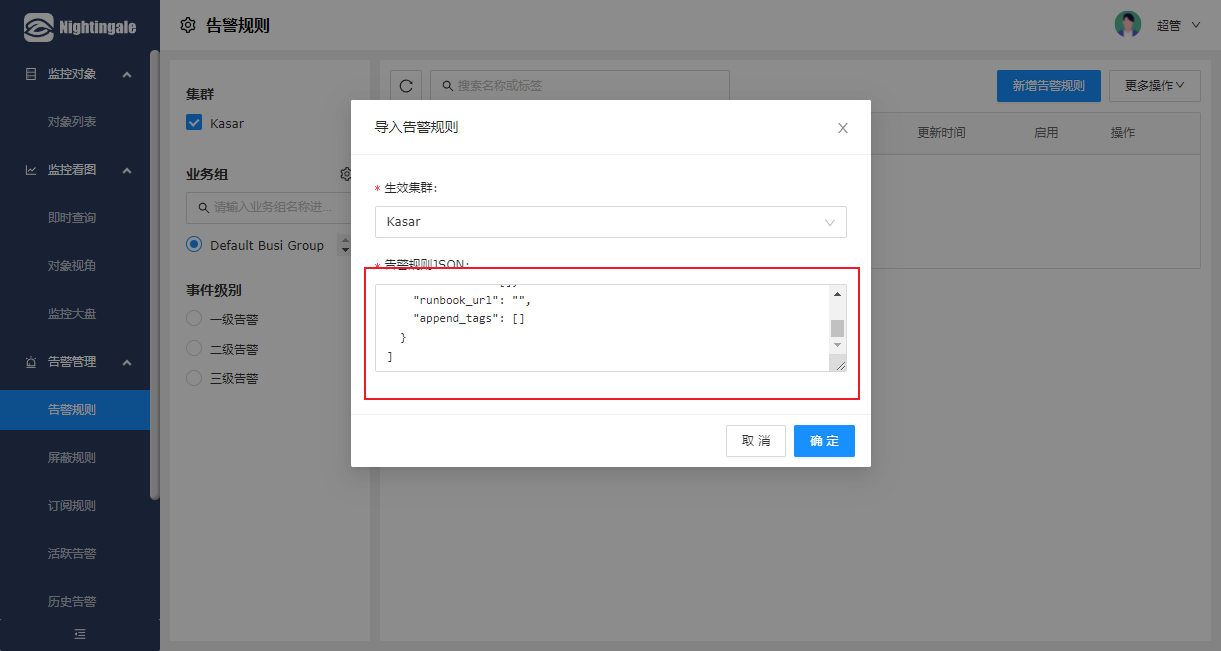
Import official monitoring market
Enter the monitoring market and click Import
[
{
"name": "Linux Basic monitoring indicators-Telegraf collection",
"tags": "HOST",
"configs": "{\"var\":[{\"name\":\"host\",\"definition\":\"label_values(mem_used_percent, ident)\"}]}",
"chart_groups": [
{
"name": "Default chart group",
"weight": 0,
"charts": [
{
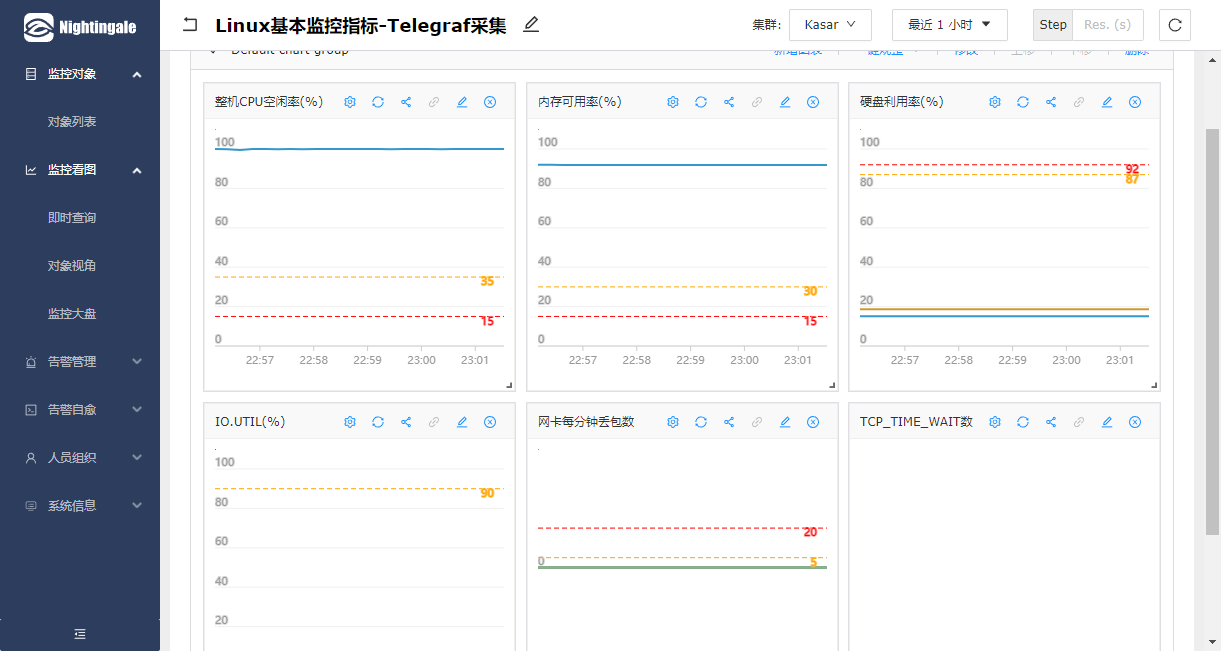
"configs": "{\"name\":\"complete machine CPU Idle rate(%)\",\"QL\":[{\"PromQL\":\"cpu_usage_idle{cpu=\\\"cpu-total\\\", ident=\\\"$host\\\"}\"}],\"yplotline1\":35,\"yplotline2\":15,\"legend\":false,\"highLevelConfig\":{\"shared\":true,\"sharedSortDirection\":\"asc\",\"precision\":\"origin\",\"formatUnit\":1000},\"version\":1,\"layout\":{\"h\":2,\"w\":8,\"x\":0,\"y\":0,\"i\":\"0\"}}",
"weight": 0
},
{
"configs": "{\"name\":\"Memory availability(%)\",\"QL\":[{\"PromQL\":\"mem_available_percent{ident=\\\"$host\\\"}\"}],\"yplotline1\":30,\"yplotline2\":15,\"legend\":false,\"highLevelConfig\":{\"shared\":true,\"sharedSortDirection\":\"asc\",\"precision\":\"origin\",\"formatUnit\":1000},\"version\":1,\"layout\":{\"h\":2,\"w\":8,\"x\":8,\"y\":0,\"i\":\"1\"}}",
"weight": 0
},
{
"configs": "{\"name\":\"Hard disk utilization(%)\",\"QL\":[{\"PromQL\":\"disk_used_percent{ident=\\\"$host\\\"}\"}],\"yplotline1\":87,\"yplotline2\":92,\"legend\":false,\"highLevelConfig\":{\"shared\":true,\"sharedSortDirection\":\"desc\",\"precision\":\"origin\",\"formatUnit\":1000},\"version\":1,\"layout\":{\"h\":2,\"w\":8,\"x\":16,\"y\":0,\"i\":\"2\"}}",
"weight": 0
},
{
"configs": "{\"name\":\"IO.UTIL(%)\",\"QL\":[{\"PromQL\":\"rate(diskio_io_time{ident=\\\"$host\\\"}[1m])/10\"}],\"yplotline1\":90,\"yplotline2\":null,\"legend\":false,\"highLevelConfig\":{\"shared\":true,\"sharedSortDirection\":\"desc\",\"precision\":\"origin\",\"formatUnit\":1000},\"version\":1,\"layout\":{\"h\":2,\"w\":8,\"x\":0,\"y\":2,\"i\":\"3\"}}",
"weight": 0
},
{
"configs": "{\"name\":\"Packet loss per minute of network card (PCs.)\",\"QL\":[{\"PromQL\":\"increase(net_drop_in{ident=\\\"$host\\\"}[1m])\",\"Legend\":\"net_drop_in ident:{{ident}} interface:{{interface}}\"},{\"PromQL\":\"increase(net_drop_out{ident=\\\"$host\\\"}[1m])\",\"Legend\":\"net_drop_out ident:{{ident}} interface:{{interface}}\"}],\"yplotline1\":5,\"yplotline2\":20,\"legend\":false,\"highLevelConfig\":{\"shared\":true,\"sharedSortDirection\":\"desc\",\"precision\":\"short\",\"formatUnit\":1000},\"version\":1,\"layout\":{\"h\":2,\"w\":8,\"x\":8,\"y\":2,\"i\":\"4\"}}",
"weight": 0
},
{
"configs": "{\"name\":\"TCP_TIME_WAIT quantity\",\"QL\":[{\"PromQL\":\"netstat_tcp_time_wait{ident=\\\"$host\\\"}\"}],\"yplotline1\":null,\"yplotline2\":20000,\"legend\":false,\"highLevelConfig\":{\"shared\":true,\"sharedSortDirection\":\"desc\",\"precision\":\"short\",\"formatUnit\":1000},\"version\":1,\"layout\":{\"h\":2,\"w\":8,\"x\":16,\"y\":2,\"i\":\"5\"}}",
"weight": 0
}
]
}
]
}
]
appendix
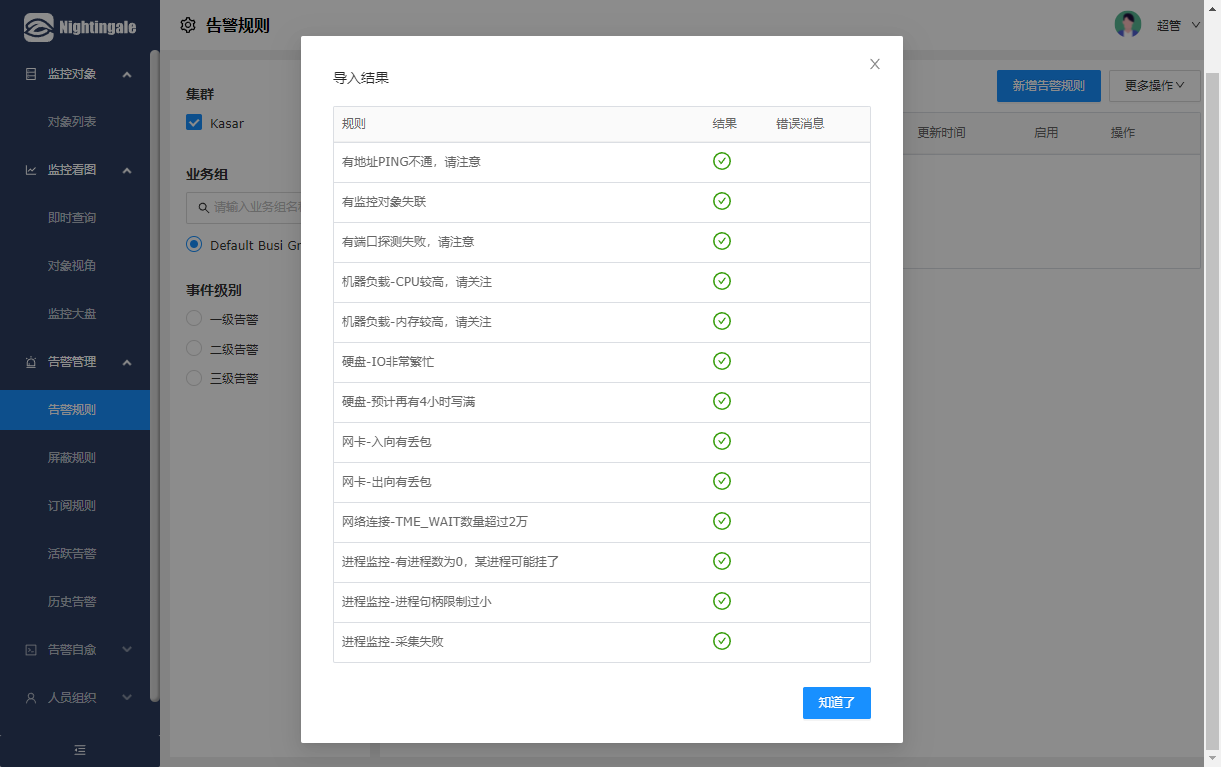
Linux common alarm rules
[
  {
    "name": "Have address PING No, please pay attention",
    "note": "",
    "severity": 1,
    "disabled": 0,
    "prom_for_duration": 60,
    "prom_ql": "ping_result_code != 0",
    "prom_eval_interval": 15,
    "enable_stime": "00:00",
    "enable_etime": "23:59",
    "enable_days_of_week": [
      "1",
      "2",
      "3",
      "4",
      "5",
      "6",
      "0"
    ],
    "notify_recovered": 1,
    "notify_channels": [
      "email",
      "dingtalk",
      "wecom"
    ],
    "notify_repeat_step": 60,
    "callbacks": [],
    "runbook_url": "",
    "append_tags": []
  },
  {
    "name": "Lost contact with monitoring objects",
    "note": "",
    "severity": 1,
    "disabled": 0,
    "prom_for_duration": 60,
    "prom_ql": "target_up != 1",
    "prom_eval_interval": 15,
    "enable_stime": "00:00",
    "enable_etime": "23:59",
    "enable_days_of_week": [
      "1",
      "2",
      "3",
      "4",
      "5",
      "6",
      "0"
    ],
    "notify_recovered": 1,
    "notify_channels": [
      "email",
      "dingtalk",
      "wecom"
    ],
    "notify_repeat_step": 60,
    "callbacks": [],
    "runbook_url": "",
    "append_tags": []
  },
  {
    "name": "Port detection failed, please note",
    "note": "",
    "severity": 1,
    "disabled": 0,
    "prom_for_duration": 60,
    "prom_ql": "net_response_result_code != 0",
    "prom_eval_interval": 15,
    "enable_stime": "00:00",
    "enable_etime": "23:59",
    "enable_days_of_week": [
      "1",
      "2",
      "3",
      "4",
      "5",
      "6",
      "0"
    ],
    "notify_recovered": 1,
    "notify_channels": [
      "email",
      "dingtalk",
      "wecom"
    ],
    "notify_repeat_step": 60,
    "callbacks": [],
    "runbook_url": "",
    "append_tags": []
  },
  {
    "name": "Machine load-CPU High, please pay attention",
    "note": "",
    "severity": 3,
    "disabled": 0,
    "prom_for_duration": 60,
    "prom_ql": "cpu_usage_idle{cpu=\"cpu-total\"} < 25",
    "prom_eval_interval": 15,
    "enable_stime": "00:00",
    "enable_etime": "23:59",
    "enable_days_of_week": [
      "1",
      "2",
      "3",
      "4",
      "5",
      "6",
      "0"
    ],
    "notify_recovered": 1,
    "notify_channels": [
      "email",
      "dingtalk",
      "wecom"
    ],
    "notify_repeat_step": 60,
    "callbacks": [],
    "runbook_url": "",
    "append_tags": []
  },
  {
    "name": "Machine load-High memory, please pay attention",
    "note": "",
    "severity": 2,
    "disabled": 0,
    "prom_for_duration": 60,
    "prom_ql": "mem_available_percent < 25",
    "prom_eval_interval": 15,
    "enable_stime": "00:00",
    "enable_etime": "23:59",
    "enable_days_of_week": [
      "1",
      "2",
      "3",
      "4",
      "5",
      "6",
      "0"
    ],
    "notify_recovered": 1,
    "notify_channels": [
      "email",
      "dingtalk",
      "wecom"
    ],
    "notify_repeat_step": 60,
    "callbacks": [],
    "runbook_url": "",
    "append_tags": []
  },
  {
    "name": "Hard disk-IO Very busy",
    "note": "",
    "severity": 2,
    "disabled": 0,
    "prom_for_duration": 60,
    "prom_ql": "rate(diskio_io_time[1m])/10 > 99",
    "prom_eval_interval": 15,
    "enable_stime": "00:00",
    "enable_etime": "23:59",
    "enable_days_of_week": [
      "1",
      "2",
      "3",
      "4",
      "5",
      "6",
      "0"
    ],
    "notify_recovered": 1,
    "notify_channels": [
      "email",
      "dingtalk",
      "wecom"
    ],
    "notify_repeat_step": 60,
    "callbacks": [],
    "runbook_url": "",
    "append_tags": []
  },
  {
    "name": "Hard disk-It is expected to be full in another four hours",
    "note": "",
    "severity": 1,
    "disabled": 0,
    "prom_for_duration": 60,
    "prom_ql": "predict_linear(disk_free[1h], 4*3600) < 0",
    "prom_eval_interval": 15,
    "enable_stime": "00:00",
    "enable_etime": "23:59",
    "enable_days_of_week": [
      "1",
      "2",
      "3",
      "4",
      "5",
      "6",
      "0"
    ],
    "notify_recovered": 1,
    "notify_channels": [
      "email",
      "dingtalk",
      "wecom"
    ],
    "notify_repeat_step": 60,
    "callbacks": [],
    "runbook_url": "",
    "append_tags": []
  },
  {
    "name": "network card-Incoming packet loss",
    "note": "",
    "severity": 3,
    "disabled": 0,
    "prom_for_duration": 60,
    "prom_ql": "increase(net_drop_in[1m]) > 0",
    "prom_eval_interval": 15,
    "enable_stime": "00:00",
    "enable_etime": "23:59",
    "enable_days_of_week": [
      "1",
      "2",
      "3",
      "4",
      "5",
      "6",
      "0"
    ],
    "notify_recovered": 1,
    "notify_channels": [
      "email",
      "dingtalk",
      "wecom"
    ],
    "notify_repeat_step": 60,
    "callbacks": [],
    "runbook_url": "",
    "append_tags": []
  },
  {
    "name": "network card-Outgoing packet loss",
    "note": "",
    "severity": 3,
    "disabled": 0,
    "prom_for_duration": 60,
    "prom_ql": "increase(net_drop_out[1m]) > 0",
    "prom_eval_interval": 15,
    "enable_stime": "00:00",
    "enable_etime": "23:59",
    "enable_days_of_week": [
      "1",
      "2",
      "3",
      "4",
      "5",
      "6",
      "0"
    ],
    "notify_recovered": 1,
    "notify_channels": [
      "email",
      "dingtalk",
      "wecom"
    ],
    "notify_repeat_step": 60,
    "callbacks": [],
    "runbook_url": "",
    "append_tags": []
  },
  {
    "name": "network connections-TME_WAIT More than 20000",
    "note": "",
    "severity": 2,
    "disabled": 0,
    "prom_for_duration": 60,
    "prom_ql": "netstat_tcp_time_wait > 20000",
    "prom_eval_interval": 15,
    "enable_stime": "00:00",
    "enable_etime": "23:59",
    "enable_days_of_week": [
      "1",
      "2",
      "3",
      "4",
      "5",
      "6",
      "0"
    ],
    "notify_recovered": 1,
    "notify_channels": [
      "email",
      "dingtalk",
      "wecom"
    ],
    "notify_repeat_step": 60,
    "callbacks": [],
    "runbook_url": "",
    "append_tags": []
  },
  {
    "name": "Process monitoring-The number of processes is 0. A process may hang",
    "note": "",
    "severity": 1,
    "disabled": 0,
    "prom_for_duration": 60,
    "prom_ql": "procstat_lookup_running == 0",
    "prom_eval_interval": 15,
    "enable_stime": "00:00",
    "enable_etime": "23:59",
    "enable_days_of_week": [
      "1",
      "2",
      "3",
      "4",
      "5",
      "6",
      "0"
    ],
    "notify_recovered": 1,
    "notify_channels": [
      "email",
      "dingtalk",
      "wecom"
    ],
    "notify_repeat_step": 60,
    "callbacks": [],
    "runbook_url": "",
    "append_tags": []
  },
  {
    "name": "Process monitoring-The process handle limit is too small",
    "note": "",
    "severity": 3,
    "disabled": 0,
    "prom_for_duration": 60,
    "prom_ql": "procstat_rlimit_num_fds_soft < 2048",
    "prom_eval_interval": 15,
    "enable_stime": "00:00",
    "enable_etime": "23:59",
    "enable_days_of_week": [
      "1",
      "2",
      "3",
      "4",
      "5",
      "6",
      "0"
    ],
    "notify_recovered": 1,
    "notify_channels": [
      "email",
      "dingtalk",
      "wecom"
    ],
    "notify_repeat_step": 60,
    "callbacks": [],
    "runbook_url": "",
    "append_tags": []
  },
  {
    "name": "Process monitoring-Collection failed",
    "note": "",
    "severity": 1,
    "disabled": 0,
    "prom_for_duration": 60,
    "prom_ql": "procstat_lookup_result_code != 0",
    "prom_eval_interval": 15,
    "enable_stime": "00:00",
    "enable_etime": "23:59",
    "enable_days_of_week": [
      "1",
      "2",
      "3",
      "4",
      "5",
      "6",
      "0"
    ],
    "notify_recovered": 1,
    "notify_channels": [
      "email",
      "dingtalk",
      "wecom"
    ],
    "notify_repeat_step": 60,
    "callbacks": [],
    "runbook_url": "",
    "append_tags": []
  }
]
Write at the end
The introduction is basically finished here. On the whole, there are two conclusions. If the exporter is used as the collector, the Nightingale only acts as a function similar to grafana, that is, query. If the telegraf is used as the collector, it is a normal monitoring application. Later, it will focus on the telegraf plug-in