The previous article has preliminarily explained that telegraf monitors network devices through snmp plugins. In the actual monitoring work, the monitoring of network devices is relatively complex, especially for large frame devices, which are prone to thousands of monitoring items. If it is written one by one, it must be impractical, Therefore, this article will provide a way of automatic discovery to automatically create the corresponding monitoring items.
text
Article environment
- Nightingale V5 three
- telegraf 1.21.3
- CE6800 (Huawei)
OID related information
This paper will demonstrate the incoming and outgoing traffic of the switch port. The following table shows the commonly used monitoring items. If there is any deviation, please adjust it yourself.
name | OID | data type | remarks |
|---|---|---|---|
ifName | .1.3.6.1.2.1.31.1.1.1.1 | OCTET STRING{(0,255)} | Port name |
ifAlias | .1.3.6.1.2.1.31.1.1.1.18 | OCTET STRING{(0,242)} | Port alias |
ifOperStatus | .1.3.6.1.2.1.2.2.1.8 | INTEGER | Port status: up(1),down(2) |
ifHighSpeed | .1.3.6.1.2.1.31.1.1.1.15 | Gauge32 | Current port rate |
ifHCInOctets | .1.3.6.1.2.1.31.1.1.1.6 | Counter64 | Inflow flow |
ifHCOutOctets | .1.3.6.1.2.1.31.1.1.1.10 | Counter64 | Outlet flow |
ifInErrors | .1.3.6.1.2.1.2.2.1.14 | Counter32 | Wrong incoming direction |
ifOutErrors | .1.3.6.1.2.1.2.2.1.20 | Counter32 | Wrong direction package |
ifType | .1.3.6.1.2.1.2.2.1.3 | INTEGER | port type |
ifOutDiscards | .1.3.6.1.2.1.2.2.1.19 | Counter32 | Exit packet loss |
ifInDiscards | .1.3.6.1.2.1.2.2.1.13 | Counter32 | Entry packet loss |
Production ideas of monitoring items
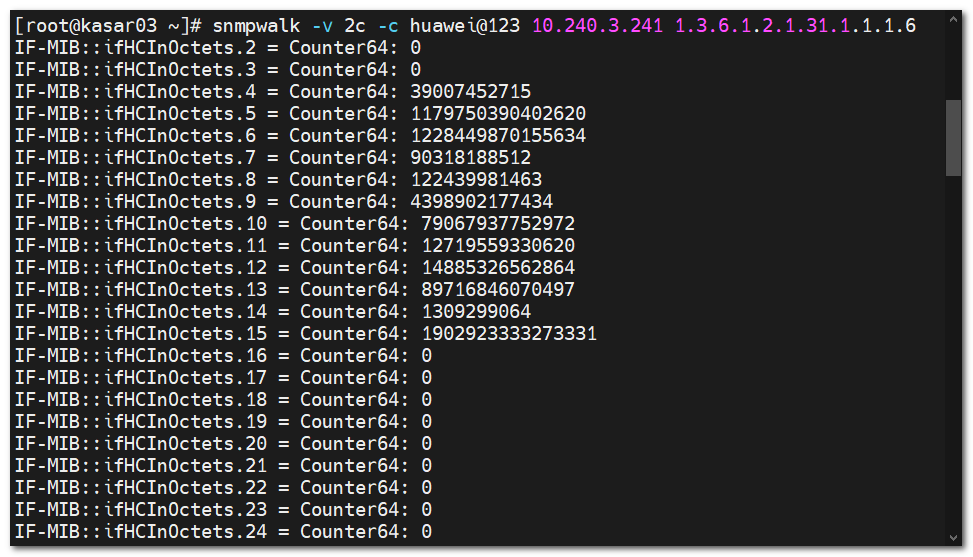
When making monitoring items, we need two points. The first is to write monitoring items more clearly, and the other is to facilitate filtering later (filtering will be put in the next article). What do you mean? According to the above table, the OID (ifHCInOctets) of the flow in the inflow direction is 1.3.6.1.2.1.31.1.1.1.6. It is found that there are many monitoring items through snmpwalk.
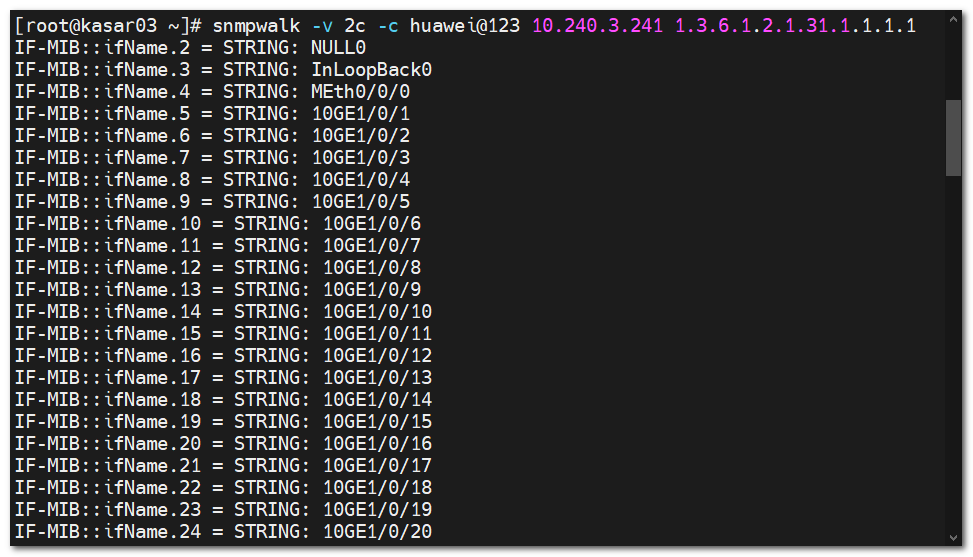
So how do you know which is which? At this time, you also need to query other monitoring items to know that this OID is the port name. The OID is 1.3.6.1.2.1.31.1.1.1.1. The port name can be seen from the result of this OID query.
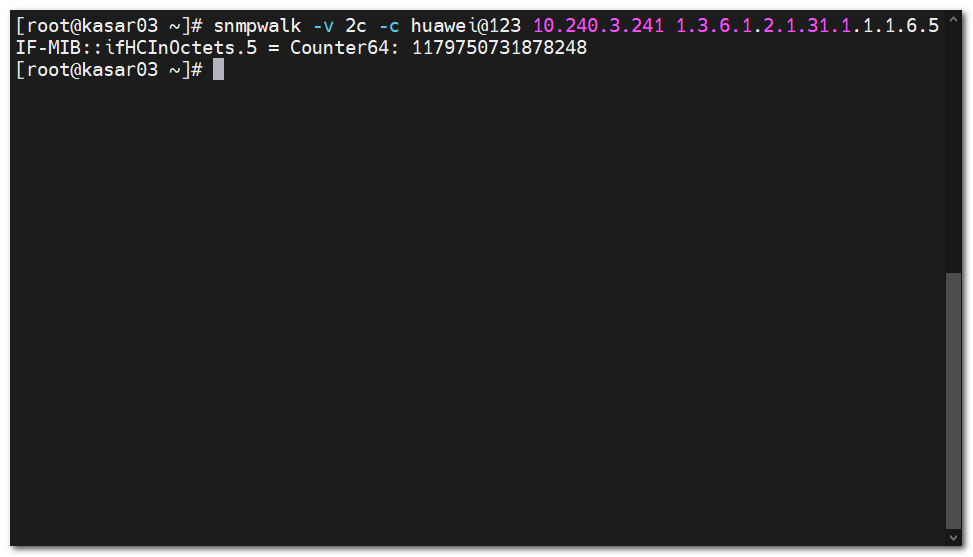
So how do these two results correspond? Careful friends can find that the last result of the two OIDs is the same. For example, we already know that the OID of 10GE1/0/1 is if-mib:: ifname 5 (1.3.6.1.2.1.31.1.1.1.1.5), then add. 5 to the OID of the flow in the inlet direction to test, and the following results can be obtained.
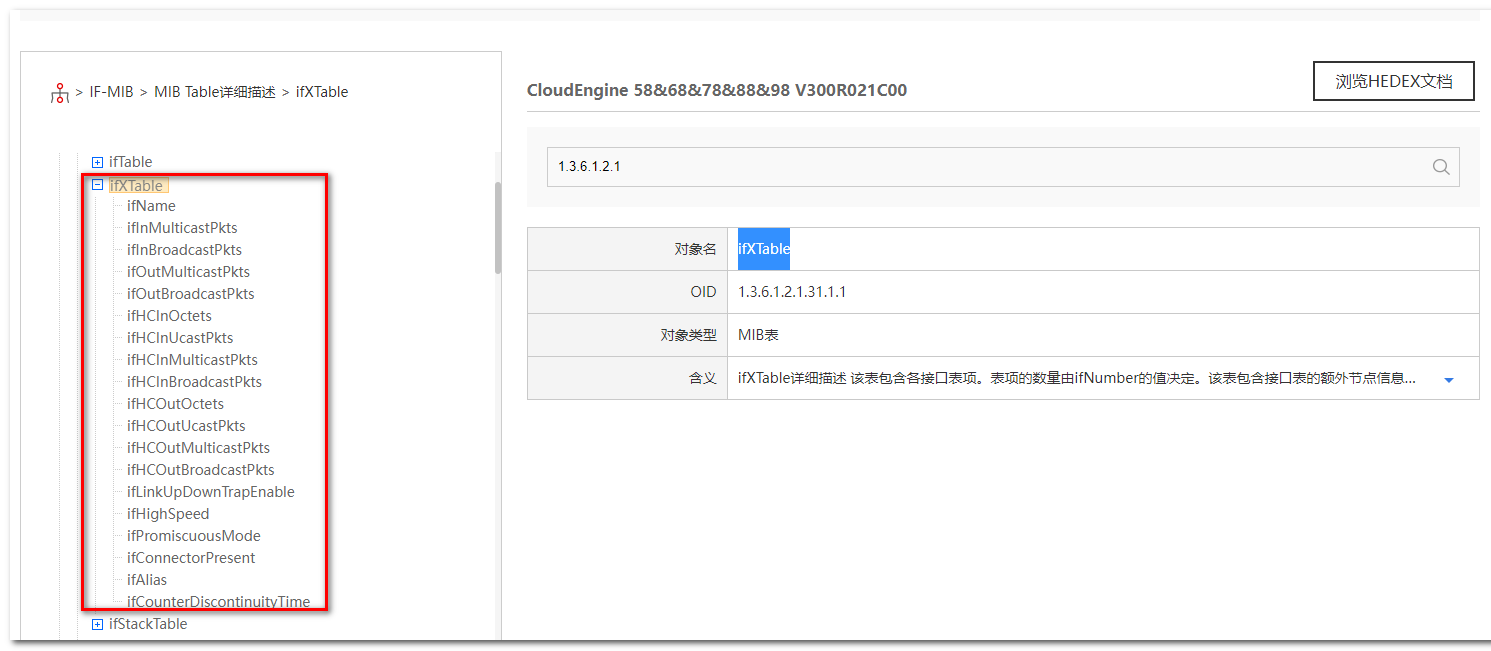
At this point, we can basically determine the whole logic. Through the comparison of the above tables, we can find that the prefixes 1.3.6.1.2.1.2.2 (ifTable) and 1.3.6.1.2.1.31.1.1 (ifxTable) are the same, and these OID s come from these two tables. So how to choose when writing configuration? Use ifxTable first.
telegraf configuration
[global_tags]
[agent]
  interval = "30s"
  round_interval = true
  metric_batch_size = 1000
  metric_buffer_limit = 10000
  collection_jitter = "0s"
  flush_interval = "30s"
  flush_jitter = "0s"
  precision = ""
  hostname = "test"
  omit_hostname = false


[[outputs.opentsdb]]
  host = "http://10.0.0.13"
  port = 19000
  http_batch_size = 50
  http_path = "/opentsdb/put"
  debug = false
  separator = "_"

[[inputs.snmp]]
agents = ["10.240.3.241"]
timeout = "5s"
version = 2
community = "huawei@123"
agent_host_tag = "ident"
retries = 1

[[inputs.snmp.table]]
oid = "1.3.6.1.2.1.31.1.1"
name = "interface"
inherit_tags = ["source"]
 [[inputs.snmp.table.field]]
 oid = "1.3.6.1.2.1.2.2.1.2"
 name = "port_name"
 is_tag = true
 [[inputs.snmp.table.field]]
 oid = "1.3.6.1.2.1.31.1.1.1.18"
 name = "port_alias"
 is_tag = true
 [[inputs.snmp.table.field]]
 oid = "1.3.6.1.2.1.2.2.1.8"
 name = "port_status"
 is_tag = true
 [[inputs.snmp.table.field]]
 oid = "1.3.6.1.2.1.2.2.1.3"
 name = "port_type"
 is_tag = true
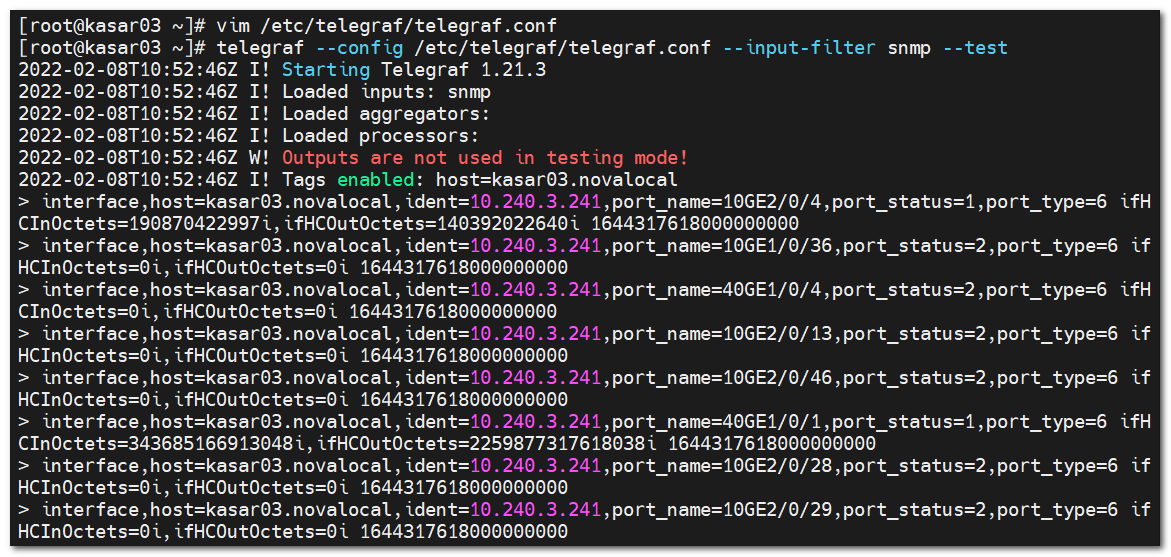
Configuration test
telegraf --config /etc/telegraf/telegraf.conf --input-filter snmp --test
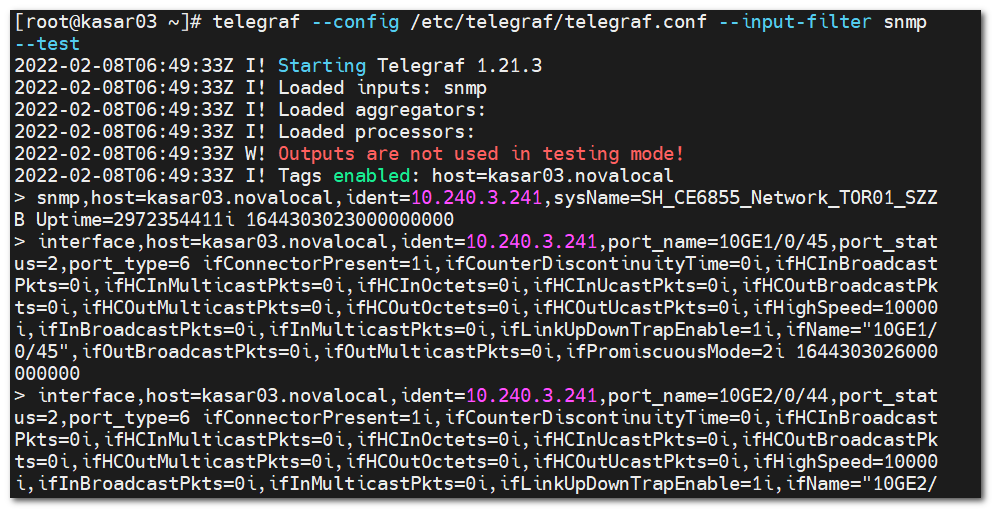
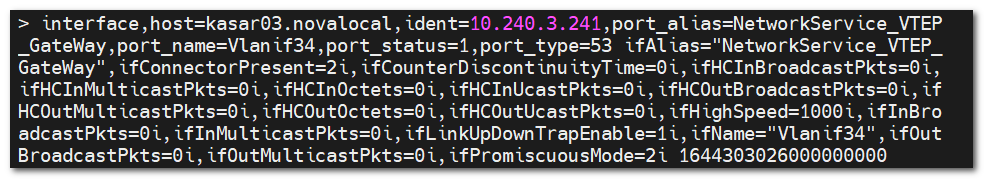
From the above figure, we can see that there are many useless monitoring items. Take Vlanif34 monitoring item as an example. Through the comparison of the following two figures, it can be concluded that the finally obtained monitoring items are all the values in user-defined + ifxTable.
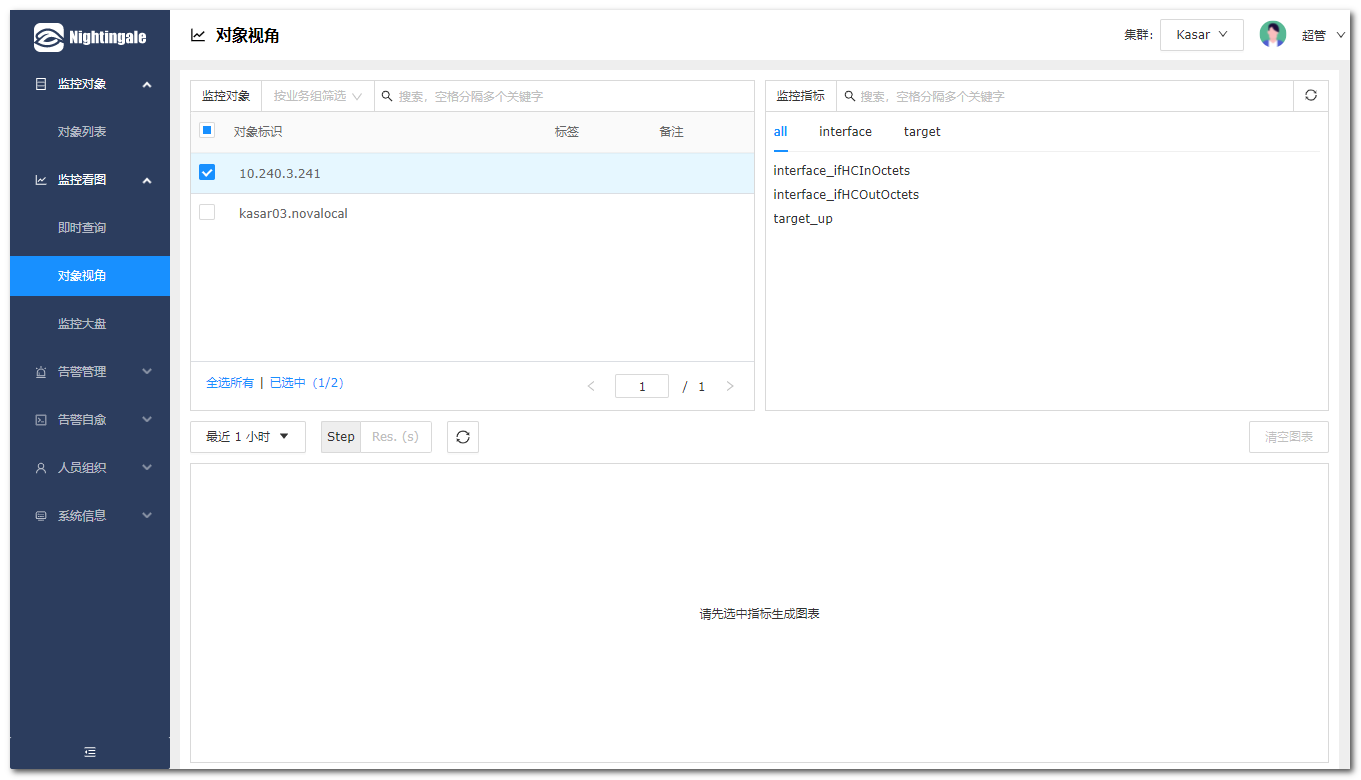
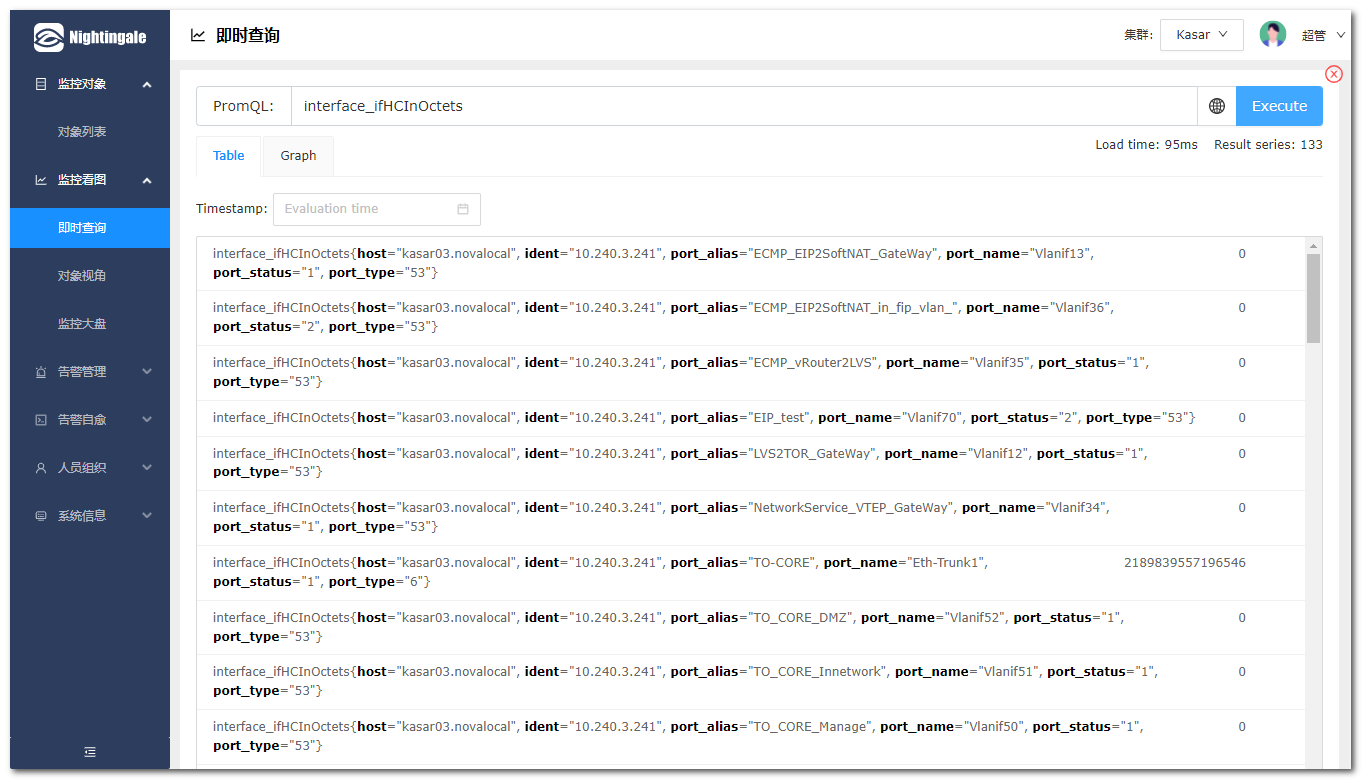
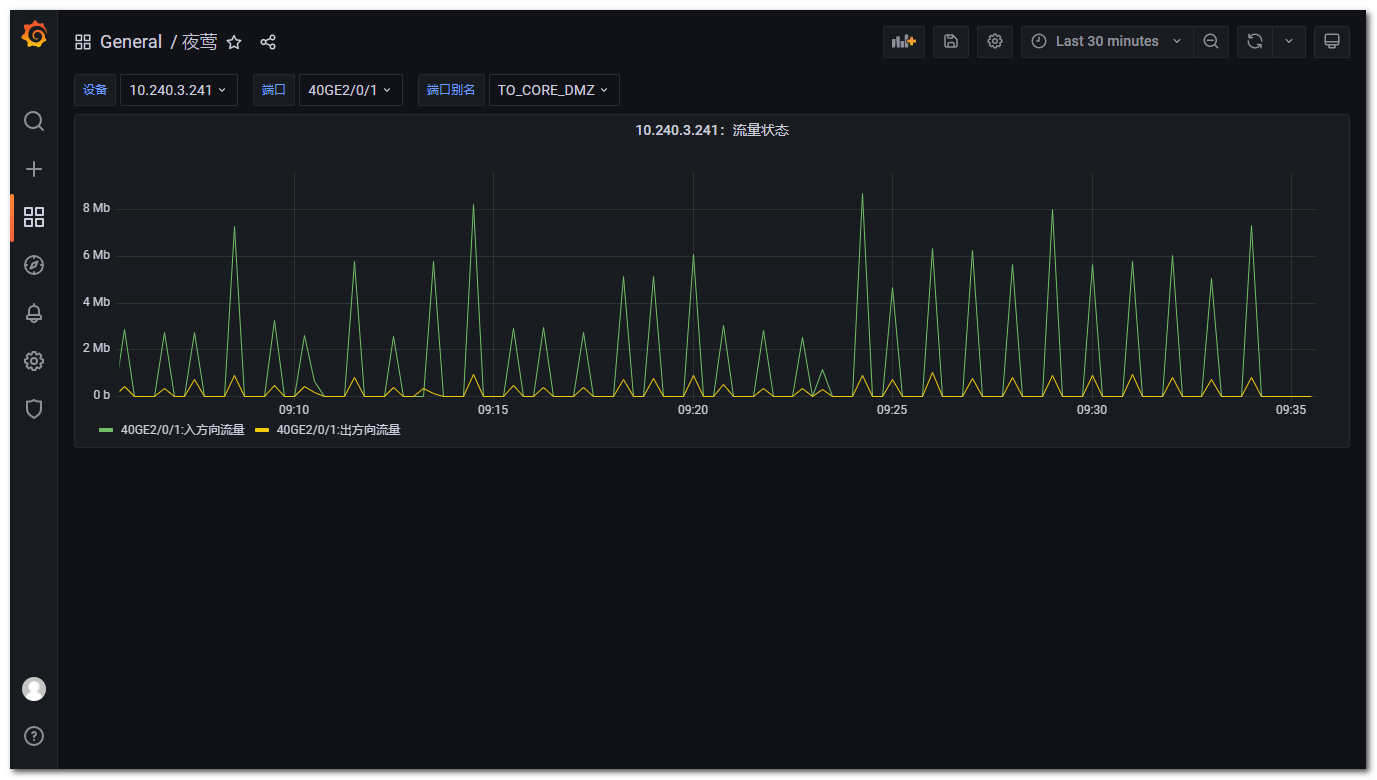
Restart telegraf to see the front-end effect
This step is only for demonstration, which is unnecessary in practice to avoid redundant monitoring items
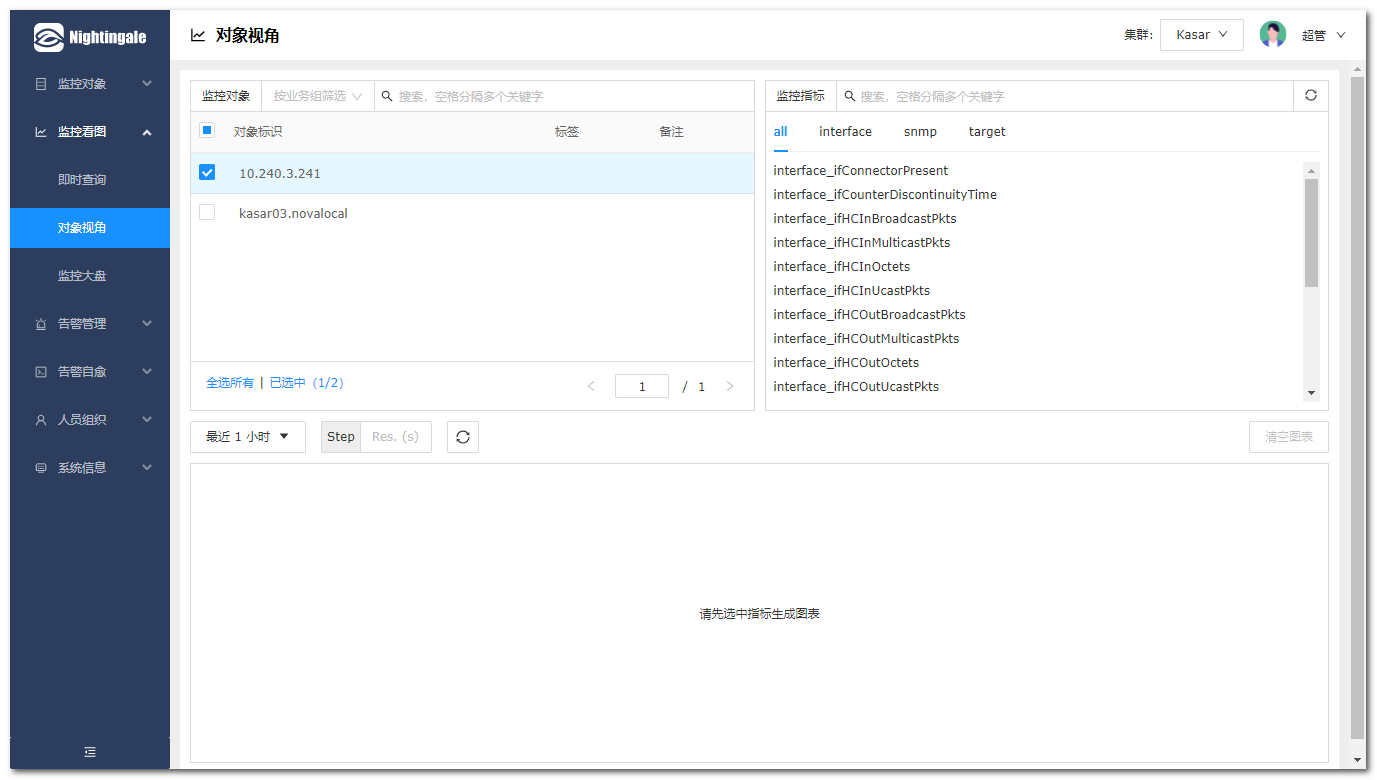
The effect of the front-end is more clear, and the redundant monitoring items are more clear. So how to filter out the redundant monitoring items?
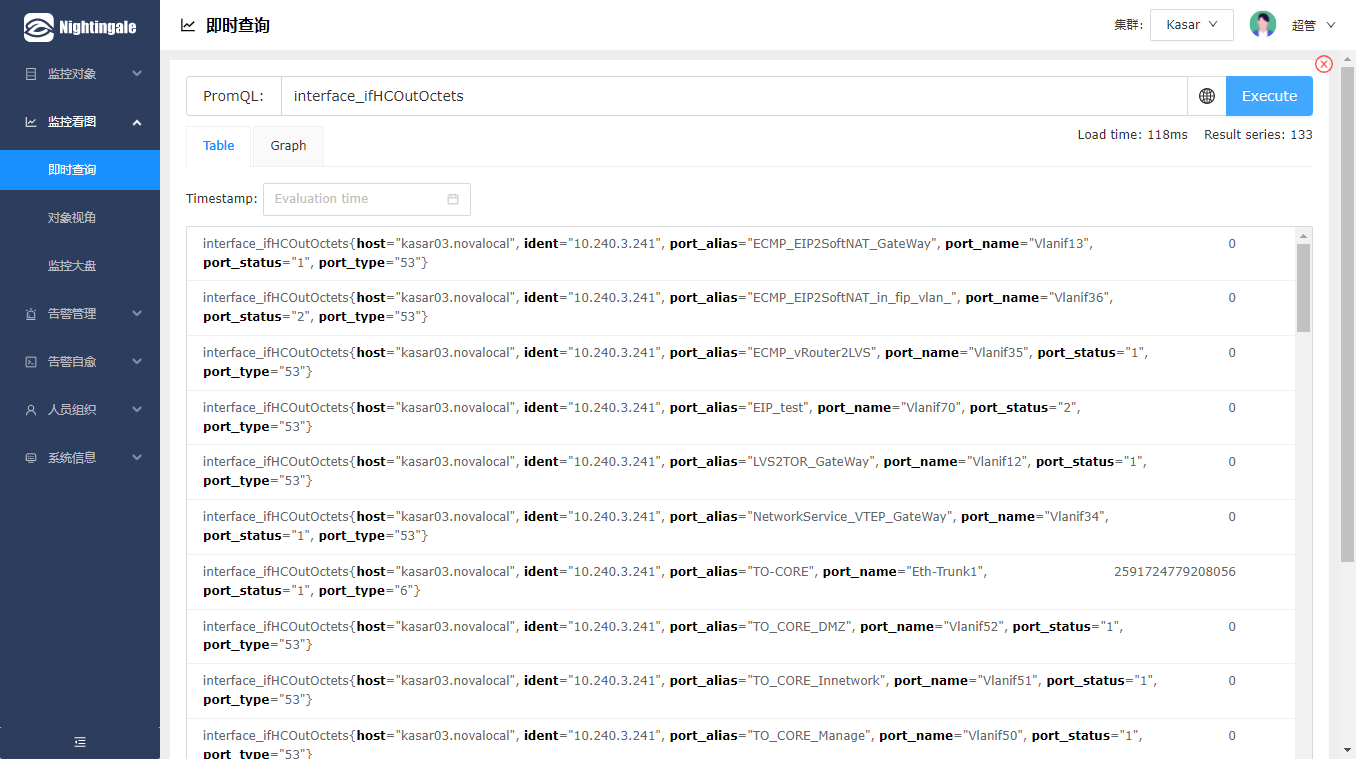
It can be found in inputs Add fieldpass to SNMP to realize filtering. The filter parameters that can be added for monitoring items are as follows:
fieldpass can be processed to match the name of the monitoring item before collection
fielddrop monitoring items matching this name will not be collected
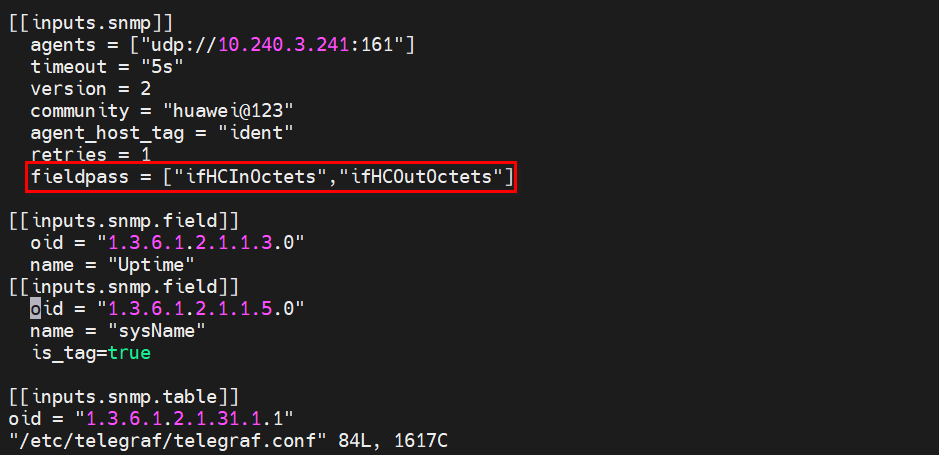
[global_tags]
[agent]
  interval = "30s"
  round_interval = true
  metric_batch_size = 1000
  metric_buffer_limit = 10000
  collection_jitter = "0s"
  flush_interval = "30s"
  flush_jitter = "0s"
  precision = ""
  hostname = "test"
  omit_hostname = false


[[outputs.opentsdb]]
  host = "http://10.0.0.13"
  port = 19000
  http_batch_size = 50
  http_path = "/opentsdb/put"
  debug = false
  separator = "_"

[[inputs.snmp]]
agents = ["10.240.3.241"]
timeout = "5s"
version = 2
community = "huawei@123"
agent_host_tag = "ident"
retries = 1
fieldpass = ["ifHCInOctets","ifHCOutOctets"]

[[inputs.snmp.table]]
oid = "1.3.6.1.2.1.31.1.1"
name = "interface"
inherit_tags = ["source"]
 [[inputs.snmp.table.field]]
 oid = "1.3.6.1.2.1.2.2.1.2"
 name = "port_name"
 is_tag = true
 [[inputs.snmp.table.field]]
 oid = "1.3.6.1.2.1.31.1.1.1.18"
 name = "port_alias"
 is_tag = true
 [[inputs.snmp.table.field]]
 oid = "1.3.6.1.2.1.2.2.1.8"
 name = "port_status"
 is_tag = true
 [[inputs.snmp.table.field]]
 oid = "1.3.6.1.2.1.2.2.1.3"
 name = "port_type"
 is_tag = true
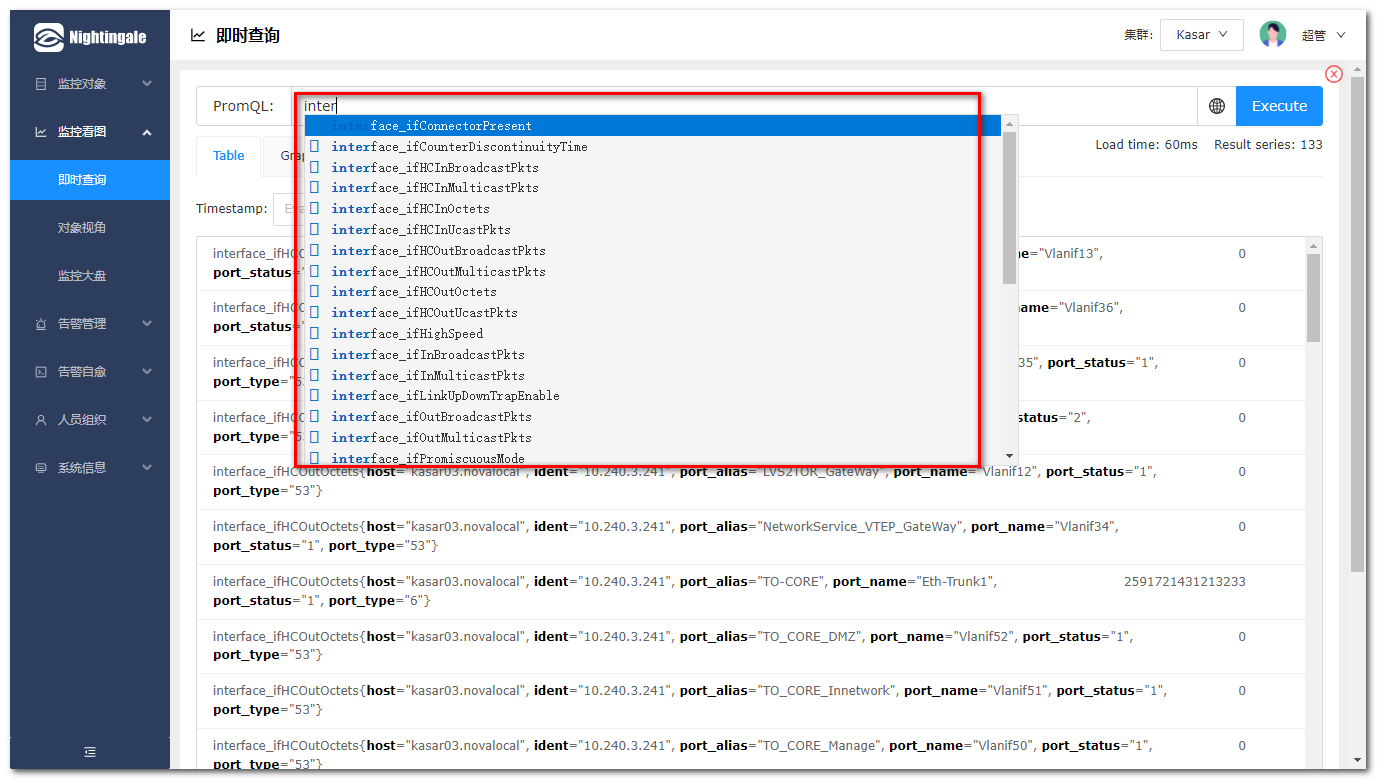
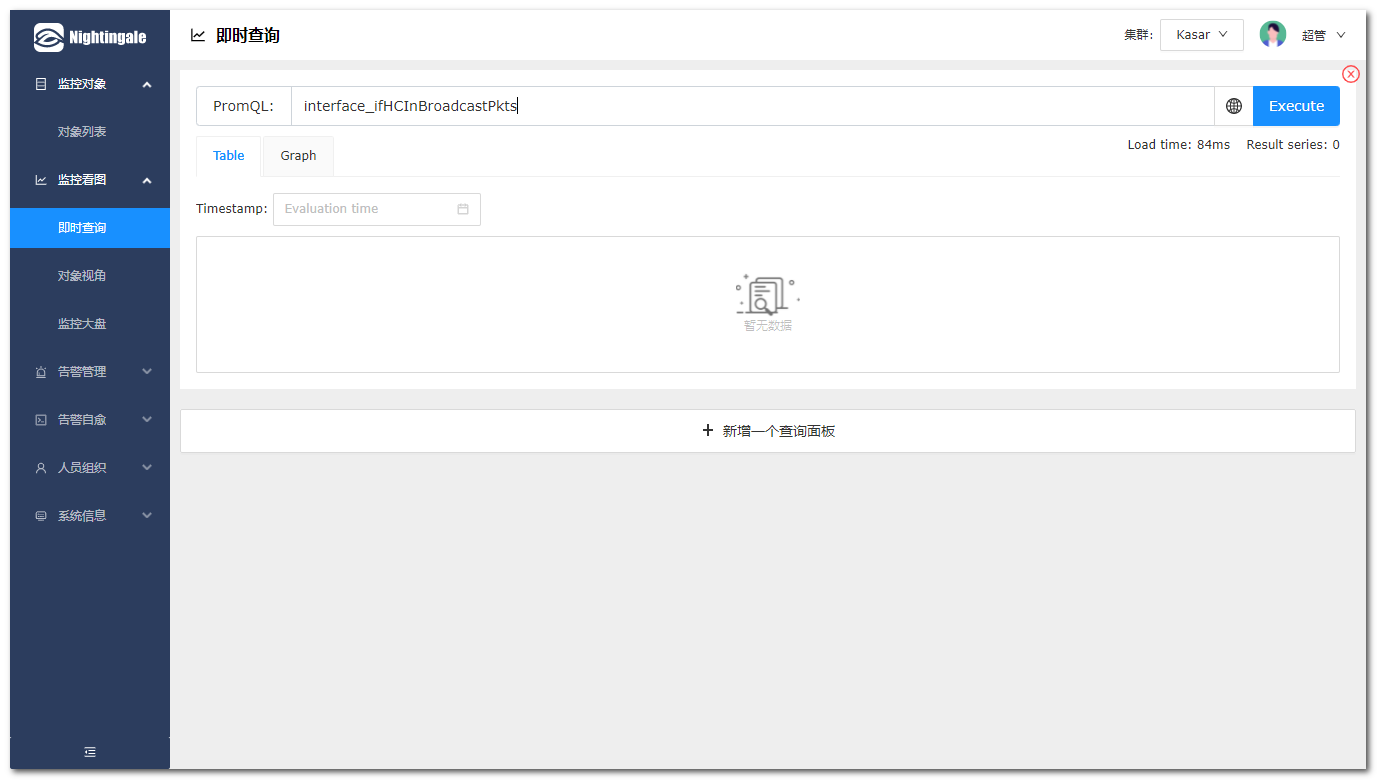
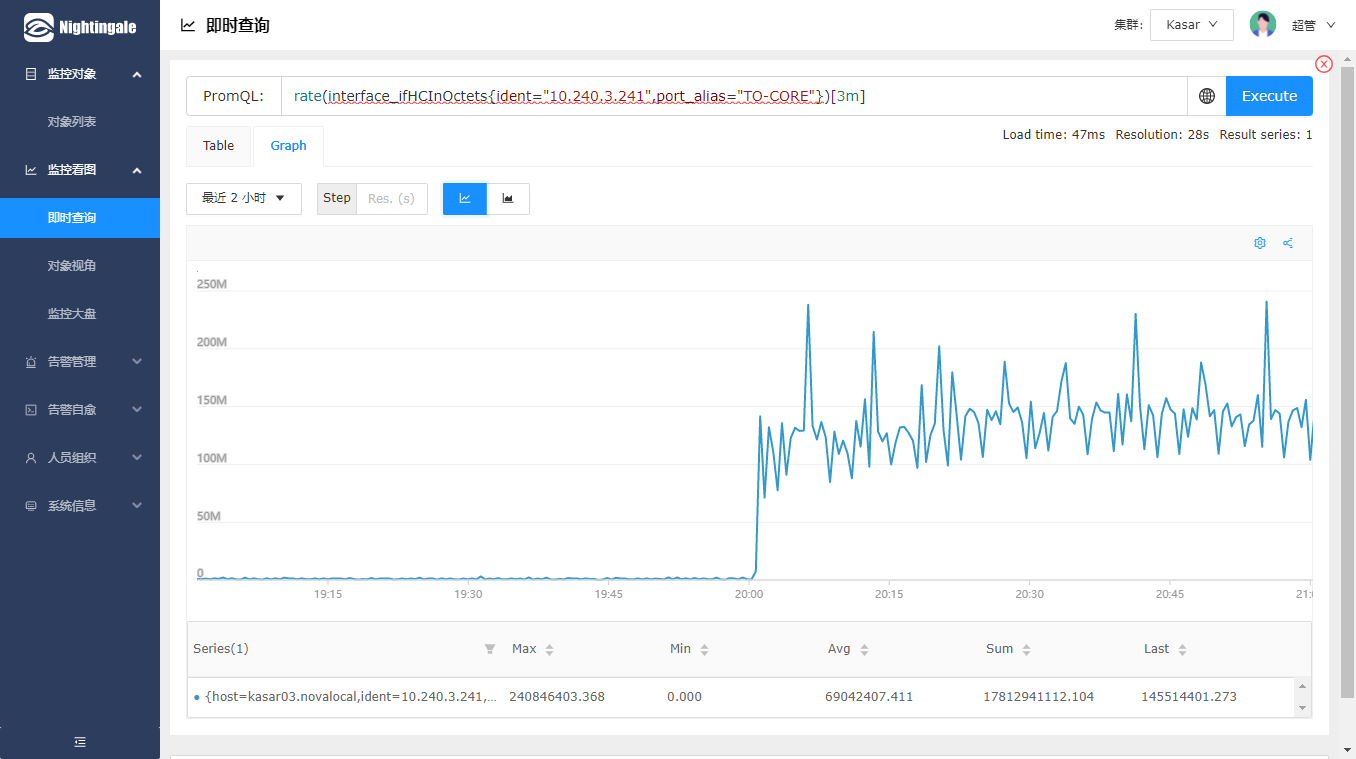
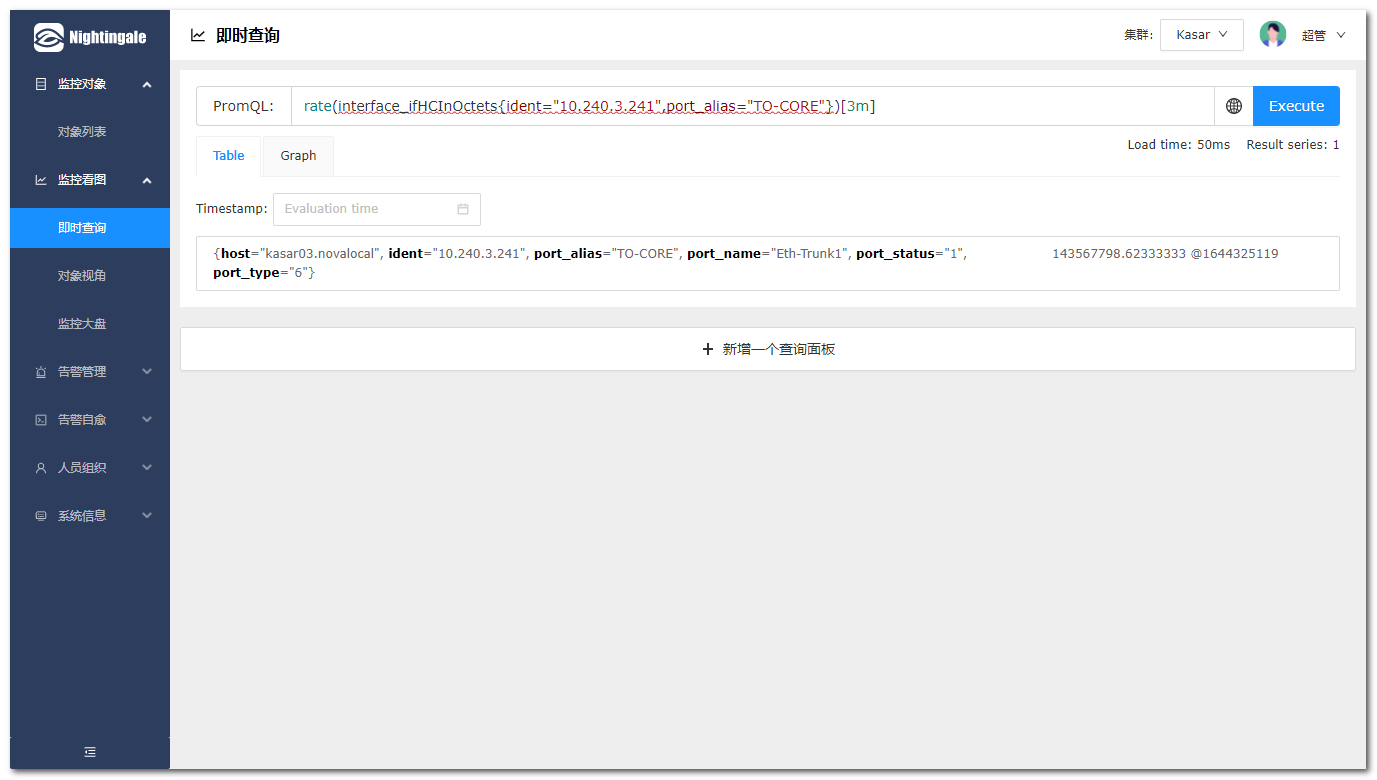
Final effect
Write at the end
In fact, many problems will be encountered after a series of operations. You will know from the actual operation. Since the Nightingale has relatively weak drawing function after the monitoring is completed, it needs to draw with the help of grafana, so it also needs to consider the setting of variables, which will undoubtedly increase the difficulty of defining label and metric. A final article will be published in the next issue, which will be explained in detail