🥳 Welcome interested partners to do something meaningful together! Translator: oil-oil
I launched a weekly translation program, Warehouse address,Access address
There is still a shortage of like-minded partners. They are purely personal interests. Of course, they will also help to improve English and front-end skills. Requirements: English is not too bad, github is proficient, persistent, modest and responsible for what you do.
If you want to participate, you can wx You can also send issue messages to the warehouse. My blog also has specific personal contact information: daodaolee.cn
In this article, I will explore heap memory allocation in Node, and then try to increase the memory to the limit that hardware can bear. Then we will find some practical ways to monitor the process of the Node to debug memory related problems.
OK, start when you are ready!
You can pull the relevant code in the warehouse clone the code from my GitHub.
Introduction to V8 garbage collection
First, let's briefly introduce the V8 garbage collector. The storage allocation method of memory is heap, which is divided into several generational areas.
The generation of an object varies with age in its life cycle.
The generation is divided into the younger generation and the older generation, while the younger generation is also divided into the new generation and the middle generation. As objects survive garbage collection, they also join the older generation.
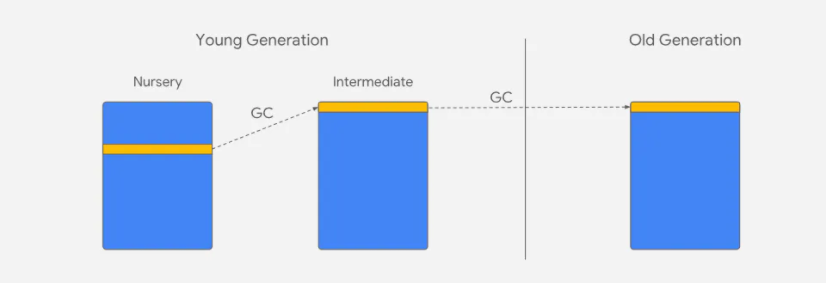
The basic principle of the generational hypothesis is that most objects are young. Based on this, the V8 garbage collector only promotes objects that survive garbage collection. As objects are copied to adjacent areas, they eventually enter the older generation.
In the Node, memory consumption is mainly divided into three aspects:
- Code - where the code is executed
- Call stack - used to store functions and local variables with primitive types (numbers, strings, or Booleans)
- Heap memory
Heap memory is our main focus today.
Now that you know more about the garbage collector, it's time to allocate some memory on the heap!
function allocateMemory(size) {
  // Simulate allocation of bytes
  const numbers = size / 8;
  const arr = [];
  arr.length = numbers;
  for (let i = 0; i < numbers; i++) {
    arr[i] = i;
  }
  return arr;
}
In the call stack, local variables are destroyed as the function call ends. The base type number never enters heap memory, but is allocated in the call stack. However, the object arr will go into the heap and may survive garbage collection.
Is heap memory limited?
Now let's do a brave test -- push the Node process to the limit to see where it will run out of heap memory:
const memoryLeakAllocations = [];

const field = "heapUsed";
const allocationStep = 10000 * 1024; // 10MB

const TIME_INTERVAL_IN_MSEC = 40;

setInterval(() => {
  const allocation = allocateMemory(allocationStep);

  memoryLeakAllocations.push(allocation);

  const mu = process.memoryUsage();
  // # bytes / KB / MB / GB
  const gbNow = mu[field] / 1024 / 1024 / 1024;
  const gbRounded = Math.round(gbNow * 100) / 100;

  console.log(`Heap allocated ${gbRounded} GB`);
}, TIME_INTERVAL_IN_MSEC);
In the above code, we allocated about 10 mb at an interval of 40 milliseconds, providing enough time for garbage collection to promote the surviving objects to the old age. process. Memory usage is a tool for reclaiming rough metrics about heap utilization. As heap allocation grows, the heap used field records the size of the heap. This field records the number of bytes in RAM and can be converted to mb.
Your results may be different. Windows 10 laptops with 32GB of memory will get the following results:
Heap allocated 4 GB
Heap allocated 4.01 GB

<--- Last few GCs --->

[18820:000001A45B4680A0] 26146 ms: Mark-sweep (reduce) 4103.7 (4107.3) -> 4103.7 (4108.3) MB, 1196.5 / 0.0 ms (average mu = 0.112, current mu = 0.000) last resort GC in old space requested

<--- JS stacktrace --->

FATAL ERROR: CALL_AND_RETRY_LAST Allocation failed - JavaScript heap out of memory
Here, the garbage collector will try to compress memory as a last resort, and finally give up and throw an "out of heap memory" exception. This process reached the limit of 4.1GB, and it took 26.6 seconds to realize that the service was going to hang up.
Some of the reasons for the above results are unknown. The V8 garbage collector initially runs in a 32-bit browser process with strict memory constraints. These results suggest that memory constraints may have been inherited from legacy code.
At the time of writing, the above code runs under the latest version of LTS Node and uses a 64 bit executable. In theory, a 64 bit process should be able to allocate more than 4GB of space and easily grow to 16 TB of address space.
Expand memory allocation limit
node index.js --max-old-space-size=8000
This sets the maximum limit to 8GB. Be careful when doing so. My laptop has 32GB of space. I recommend setting it to the actual available space in RAM. Once the physical memory runs out, the process begins to occupy disk space through virtual memory. If you set the limit too high, you will get a new reason to change the computer. Here we try to avoid smoking the computer~
Let's run the code again with the limit of 8GB:
Heap allocated 7.8 GB
Heap allocated 7.81 GB

<--- Last few GCs --->

[16976:000001ACB8FEB330] 45701 ms: Mark-sweep (reduce) 8000.2 (8005.3) -> 8000.2 (8006.3) MB, 1468.4 / 0.0 ms (average mu = 0.211, current mu = 0.000) last resort GC in old space requested

<--- JS stacktrace --->

FATAL ERROR: CALL_AND_RETRY_LAST Allocation failed - JavaScript heap out of memory
This time, the heap size reached almost 8GB, but not completely. I suspect that there is some overhead in the Node process to allocate so much memory. This process takes 45.7 seconds to complete.
In a production environment, it may not take less than one minute to run out of memory. This is one of the reasons why monitoring and insight into memory consumption is helpful. Memory consumption will increase slowly over time, and it may take several days to know the problem. If the process continues to crash and there is an "out of heap memory" exception in the log, there may be a memory leak in the code.
The process may also consume more memory because it is processing more data. If resource consumption continues to grow, it may be time to decompose this monomer into micro services. This will reduce the memory pressure of a single process and allow the node to scale horizontally.
How to track node JS memory leak
process. The heapsused field of memoryusage is still useful. One way to debug memory leaks is to put the memory index in another tool for further processing. Since this implementation is not complex, it mainly analyzes how to implement it in person.
const path = require("path");
const fs = require("fs");
const os = require("os");

const start = Date.now();
const LOG_FILE = path.join(__dirname, "memory-usage.csv");

fs.writeFile(LOG_FILE, "Time Alive (secs),Memory GB" + os.EOL, () => {}); // Request - confirm
In order to avoid putting the heap allocation index in memory, we choose to write the results to CSV file to facilitate data consumption. The writeFile asynchronous function with callback is used here. The callback is empty to write to the file and continue without any further processing.
To get a progressive memory metric, add it to console log:
const elapsedTimeInSecs = (Date.now() - start) / 1000;
const timeRounded = Math.round(elapsedTimeInSecs * 100) / 100;

s.appendFile(LOG_FILE, timeRounded + "," + gbRounded + os.EOL, () => {}); // Request - confirm
The above code can be used to debug the heap memory growth over time in case of memory leakage. You can use some analysis tools to parse the native csv data to achieve a beautiful visualization.
If you are just in a hurry to see the data, you can directly use excel, as shown in the following figure:
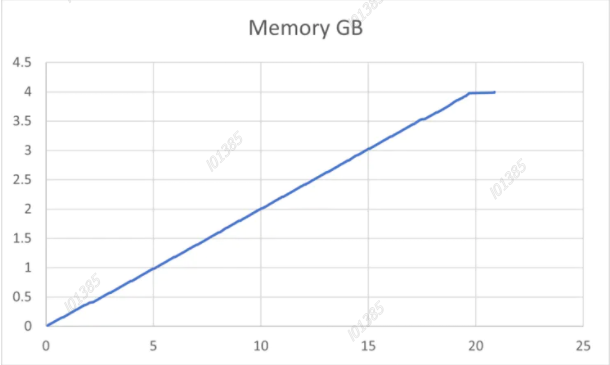
With a limit of 4.1GB, you can see that the memory utilization increases linearly in a short time. Memory consumption continues to grow and does not become flat, which indicates that there is a memory leak somewhere. When we debug this kind of problem, we should look for the part of code allocated at the end of the old generation.
If an object survives garbage collection, it may exist until the process terminates.
A more reusable way to use this memory leak detection code is to wrap it in its own time interval (because it doesn't have to exist in the main loop).
setInterval(() => {
  const mu = process.memoryUsage();
  // # bytes / KB / MB / GB
  const gbNow = mu[field] / 1024 / 1024 / 1024;
  const gbRounded = Math.round(gbNow * 100) / 100;

  const elapsedTimeInSecs = (Date.now() - start) / 1000;
  const timeRounded = Math.round(elapsedTimeInSecs * 100) / 100;

  fs.appendFile(LOG_FILE, timeRounded + "," + gbRounded + os.EOL, () => {}); // fire-and-forget
}, TIME_INTERVAL_IN_MSEC);
Note that the above methods cannot be used directly in the production environment. They just tell you how to debug memory leaks in the local environment. The actual implementation also includes automatic display, alarm and rotation log, so that the server will not run out of disk space.
Track nodes in the production environment JS memory leak
Although the above code is not feasible in a production environment, we have seen how to debug memory leaks. Therefore, as an alternative, the Node process can be wrapped in PM2 and so on of Daemon Yes.
Set the restart policy when the memory consumption reaches the limit:
pm2 start index.js --max-memory-restart 8G
The units can be K (kilobytes), M (megabytes), and G (gigabytes). Process restart takes about 30 seconds, so multiple nodes are configured through the load balancer to avoid interruption.
Another beautiful tool is the cross platform native module node-memwatch , which triggers an event when a memory leak in the running code is detected.
const memwatch = require("memwatch");

memwatch.on("leak", function (info) {
  // event emitted
  console.log(info.reason);
});
The event is triggered by leak, and a reason in its callback object will grow as the heap of continuous garbage collection grows.
Use AppSignal's Magic Dashboard to diagnose memory limitations
AppSignal has a magic dashboard for Monitoring heap growth Garbage collection statistics. 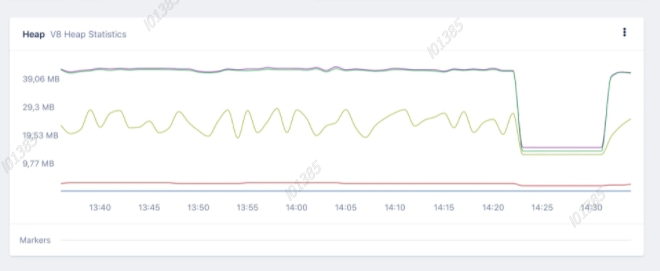
The above figure shows that the request stopped for 7 minutes around 14:25 to allow garbage collection to reduce memory pressure. Dashboards are also exposed when objects stay in old space for too long and cause memory leaks.
Summary: solve node JS memory limit and leak
In this article, we first understand the role of V8 garbage collector, and then explore whether there are heap memory restrictions and how to expand memory allocation restrictions.
Finally, we used some potential tools to pay close attention to node Memory leak in JS. We can see that the monitoring of memory allocation can be realized by using some rough tools and methods, such as memory usage and some debugging methods. Here, the analysis is still implemented manually.
Another option is to use professional tools such as AppSignal, which provides monitoring, alarm and beautiful visualization to diagnose memory problems in real time.
I hope you enjoy this quick introduction to memory limitation and diagnosing memory leaks.