stay node2vec code implementation and detailed analysis In, we discuss in detail how to use node2vec to embed the nodes of the graph, and finally get the vector representation of all nodes with a dimension of 128. With the help of the vector representation of nodes, we can analyze the nodes.
1.k-means
The simplest idea is to unsupervised classify nodes, specifically clustering, clustering similar nodes according to their vector representation. For k-means, please refer to: K of machine learning_ Means (with simple handwritten code) , I won't explain it in detail here. The code is directly given here:
def k_means(m, K):
    """
    :param m: node2vec Training results
    :param K: Number of categories
    :return: Clustering results
    """
    nodes = list(G.nodes)
    # Arbitrarily select K nodes as the initial clustering center
    centers = []
    temp = []
    for i in range(K):
        t = np.random.randint(0, len(nodes) - 1)
        if nodes[t] not in centers:
            temp.append(nodes[t])
            centers.append(m[nodes[t]])  # The center is a 128 dimensional vector

    # 50 iterations
    res = {}
    for i in range(K):
        res[i] = []

    for time in range(50):
        # clear
        for i in range(K):
            res[i].clear()
        # Calculate the distance from the vector of each point to the cluster center
        nodes_distance = {}
        for node in nodes:
            # Distance from node to central node
            node_distance = []
            for center in centers:
                node_distance.append(get_dis(m[node], center))
            nodes_distance[node] = node_distance  # Save the distance from the node to each center
        # Reclassify each node and select the nearest node for classification. The category is 0-5
        for node in nodes:
            temp = nodes_distance[node]  # Six distances are stored
            cls = temp.index(min(temp))
            res[cls].append(node)

        # Update cluster center
        centers.clear()
        for i in range(K):
            center = []
            for j in range(128):
                t = [m[node][j] for node in res[i]]  # The j-th coordinate of all node nodes in the i-th category
                center.append(np.mean(t))
            centers.append(center)

    return res
2.karate_club_graph
Karate_club_graph (): 34 nodes, each node represents members, while recording the relationship between paired members interacting outside the club. During the study period, there was a conflict between the administrator "John A" and the coach "Mr. Hi" (pseudonym), which led to the division of the club into two. Half of the members formed a new club around Mr. hi; the other members found a new coach or gave up karate.
Simply put, each node has a label (two labels in total). Let's output the following:
G = nx.karate_club_graph()
nodes = list(G.nodes.data())
print(nodes)
The output is as follows:
[(0, {'club': 'Mr. Hi'}), (1, {'club': 'Mr. Hi'}), (2, {'club': 'Mr. Hi'}), (3, {'club': 'Mr. Hi'}), (4, {'club': 'Mr. Hi'}), (5, {'club': 'Mr. Hi'}), (6, {'club': 'Mr. Hi'}), (7, {'club': 'Mr. Hi'}), (8, {'club': 'Mr. Hi'}), (9, {'club': 'Officer'}), (10, {'club': 'Mr. Hi'}), (11, {'club': 'Mr. Hi'}), (12, {'club': 'Mr. Hi'}), (13, {'club': 'Mr. Hi'}), (14, {'club': 'Officer'}), (15, {'club': 'Officer'}), (16, {'club': 'Mr. Hi'}), (17, {'club': 'Mr. Hi'}), (18, {'club': 'Officer'}), (19, {'club': 'Mr. Hi'}), (20, {'club': 'Officer'}), (21, {'club': 'Mr. Hi'}), (22, {'club': 'Officer'}), (23, {'club': 'Officer'}), (24, {'club': 'Officer'}), (25, {'club': 'Officer'}), (26, {'club': 'Officer'}), (27, {'club': 'Officer'}), (28, {'club': 'Officer'}), (29, {'club': 'Officer'}), (30, {'club': 'Officer'}), (31, {'club': 'Officer'}), (32, {'club': 'Officer'}), (33, {'club': 'Officer'})]
As you can see, all members are divided into two categories: Mr. Hi and office.
We draw the original diagram (different categories are marked with different colors):
color_map = []
ns = list(G.nodes.data())
nodes = list(g.nodes)
for node in nodes:
    if ns[node][1]['club'] == 'Mr. Hi':
        color_map.append('#DCBB8A')
    else:
        color_map.append('#98BBEF')
nx.draw(G, node_color=color_map, pos=pos, with_labels=True, node_size=1000)
plt.show()
As follows:

After using node2vec to obtain the vector representation of all nodes, the effect of clustering is as follows:
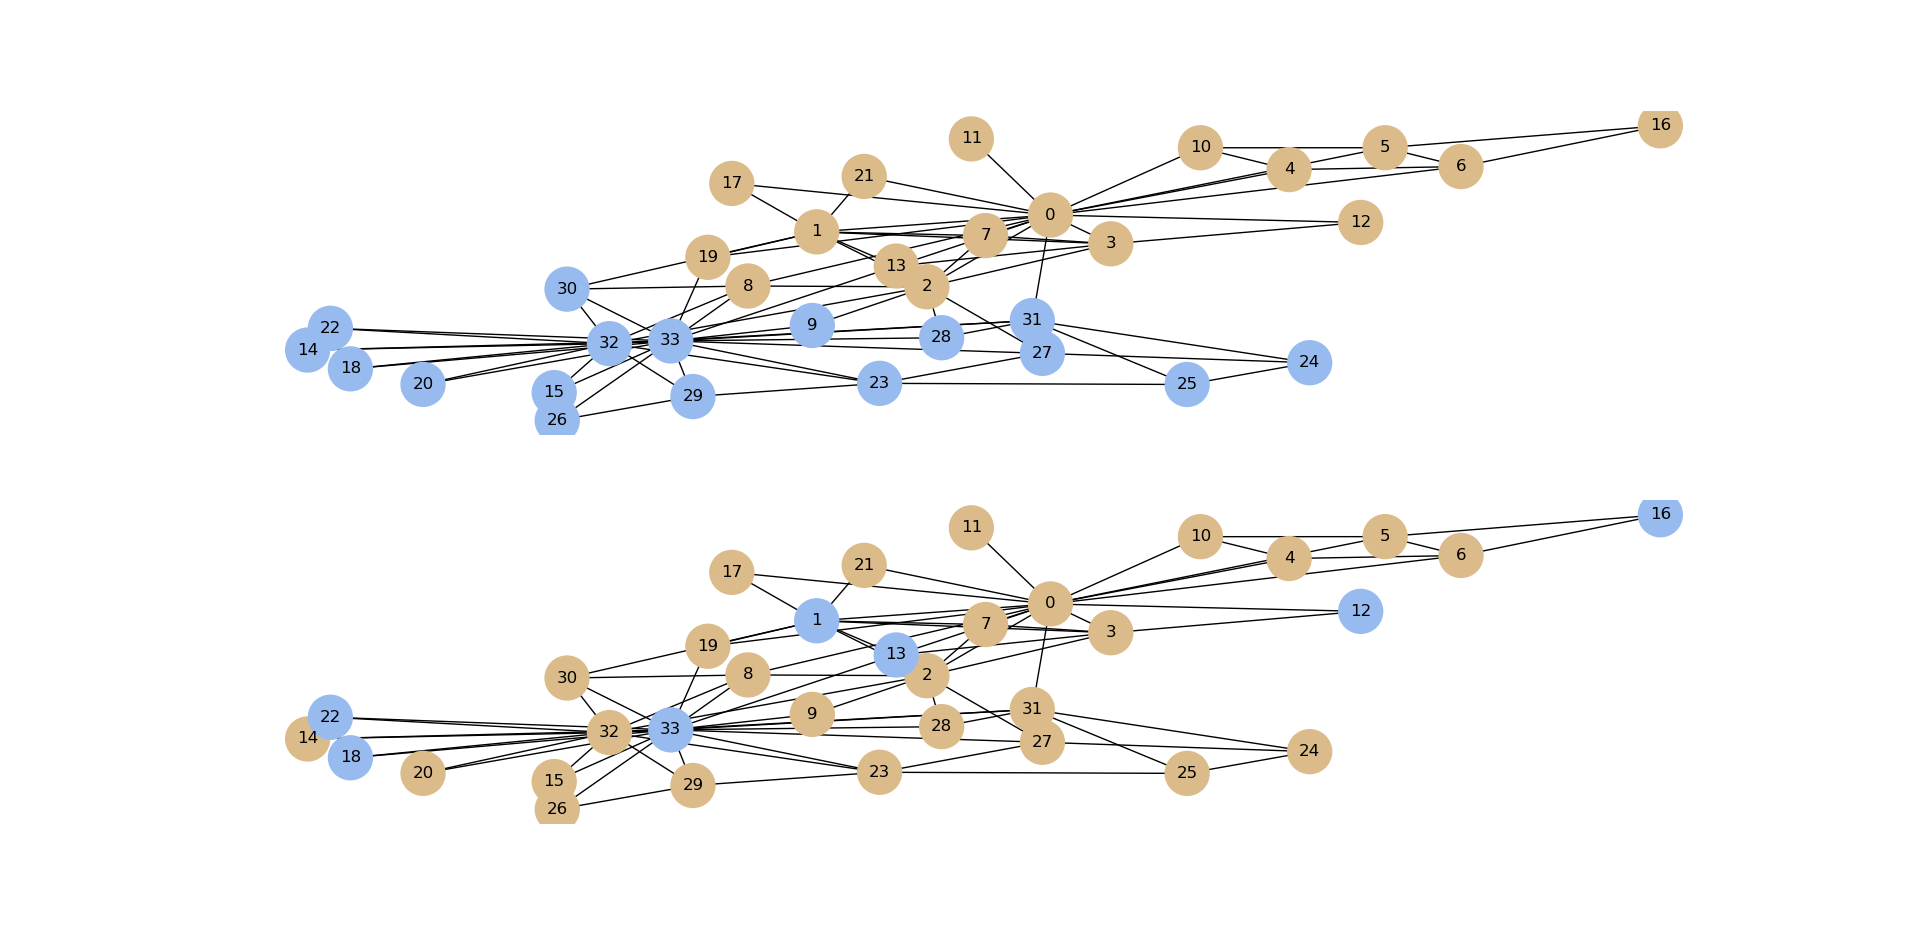
It can be found that the effect of node classification using clustering is very poor (node2vec is the figure below, and the figure above is the original figure)
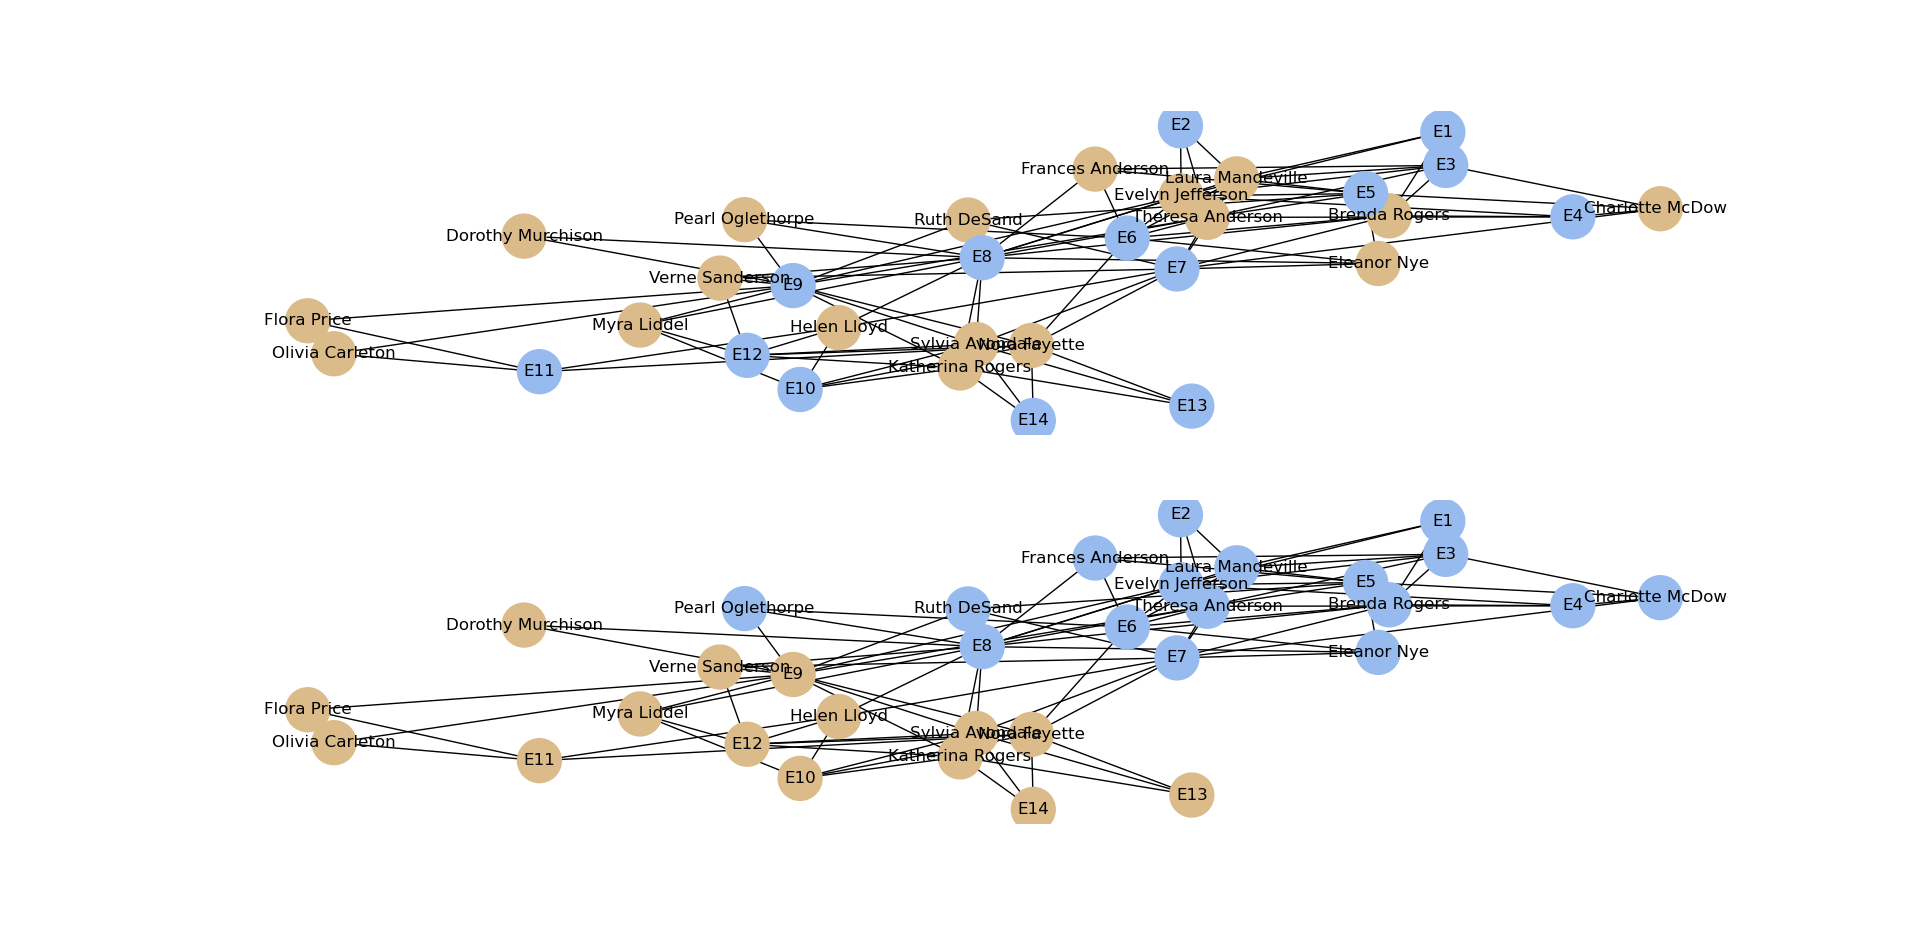
3.davis_southern_women_graph
The performance of the Davis Southern women's social network, node2vec, is as follows:
4. Summary
Using clustering to classify nodes directly, the effect is general!
Attachment: complete code of drawing:
def plot(g, m):
    """
    :param g: chart
    :param m: Vector representation of nodes
    :return: none
    """
    # Draw according to the original label
    pos = nx.spring_layout(G)

    color_map = []
    ns = list(G.nodes.data())
    nodes = list(g.nodes)
    for node in nodes:
        if ns[node][1]['club'] == 'Mr. Hi':
            color_map.append('#DCBB8A')
        else:
            color_map.append('#98BBEF')

    plt.subplot(2, 1, 1)
    nx.draw(G, node_color=color_map, pos=pos, with_labels=True, node_size=1000)

    K = 2
    res = k_means(m, K)

    colors = ['#DCBB8A', '#98BBEF', 'navy', 'indigo', 'orange', 'blue']
    color_map.clear()
    for node in nodes:
        for i in range(len(res)):
            if node in res[i]:
                color_map.append(colors[i])
                break
    # draw
    plt.subplot(2, 1, 2)
    nx.draw(G, node_color=color_map, pos=pos, with_labels=True, node_size=1000)
    plt.show()