High CPU of application service caused by serialization problem
The phenomenon of CPU soaring is very common, but in fact, it is not particularly complex to find and solve it. Here are some common cases of CPU soaring, and the solutions and relevant troubleshooting and solving processes are given.
Before analysis, review several knowledge points:
CPU performance index:
load average: load. When viewed by linux, it is usually displayed as follows:
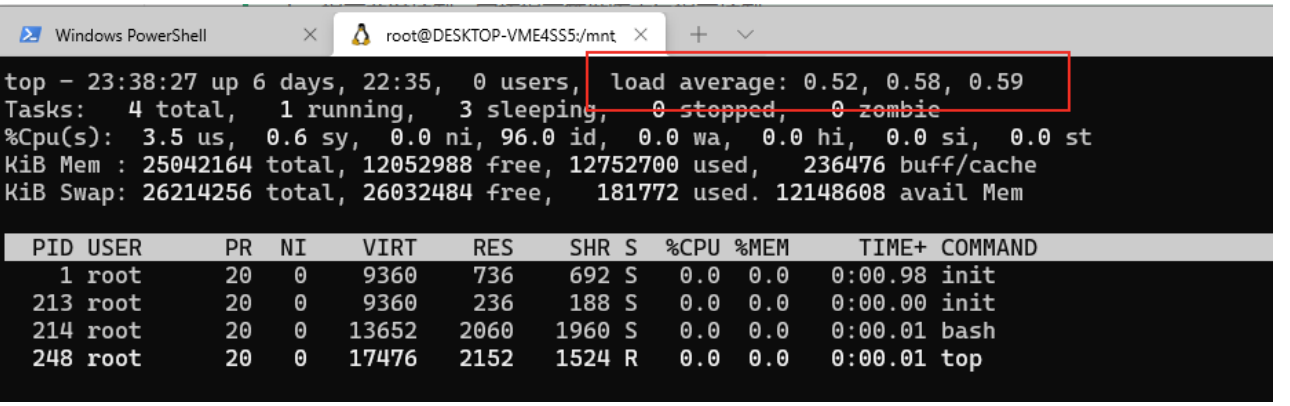
It represents the average load of the system for 1 minute, 5 minutes and 15 minutes.
The analogy of image can be referred to Understanding Linux CPU Load - when should you be worried? | Scout APM Blog
Another figurative metaphor: CPU load and utilization are indistinguishable - Yunxi blog Park (cnblogs.com)
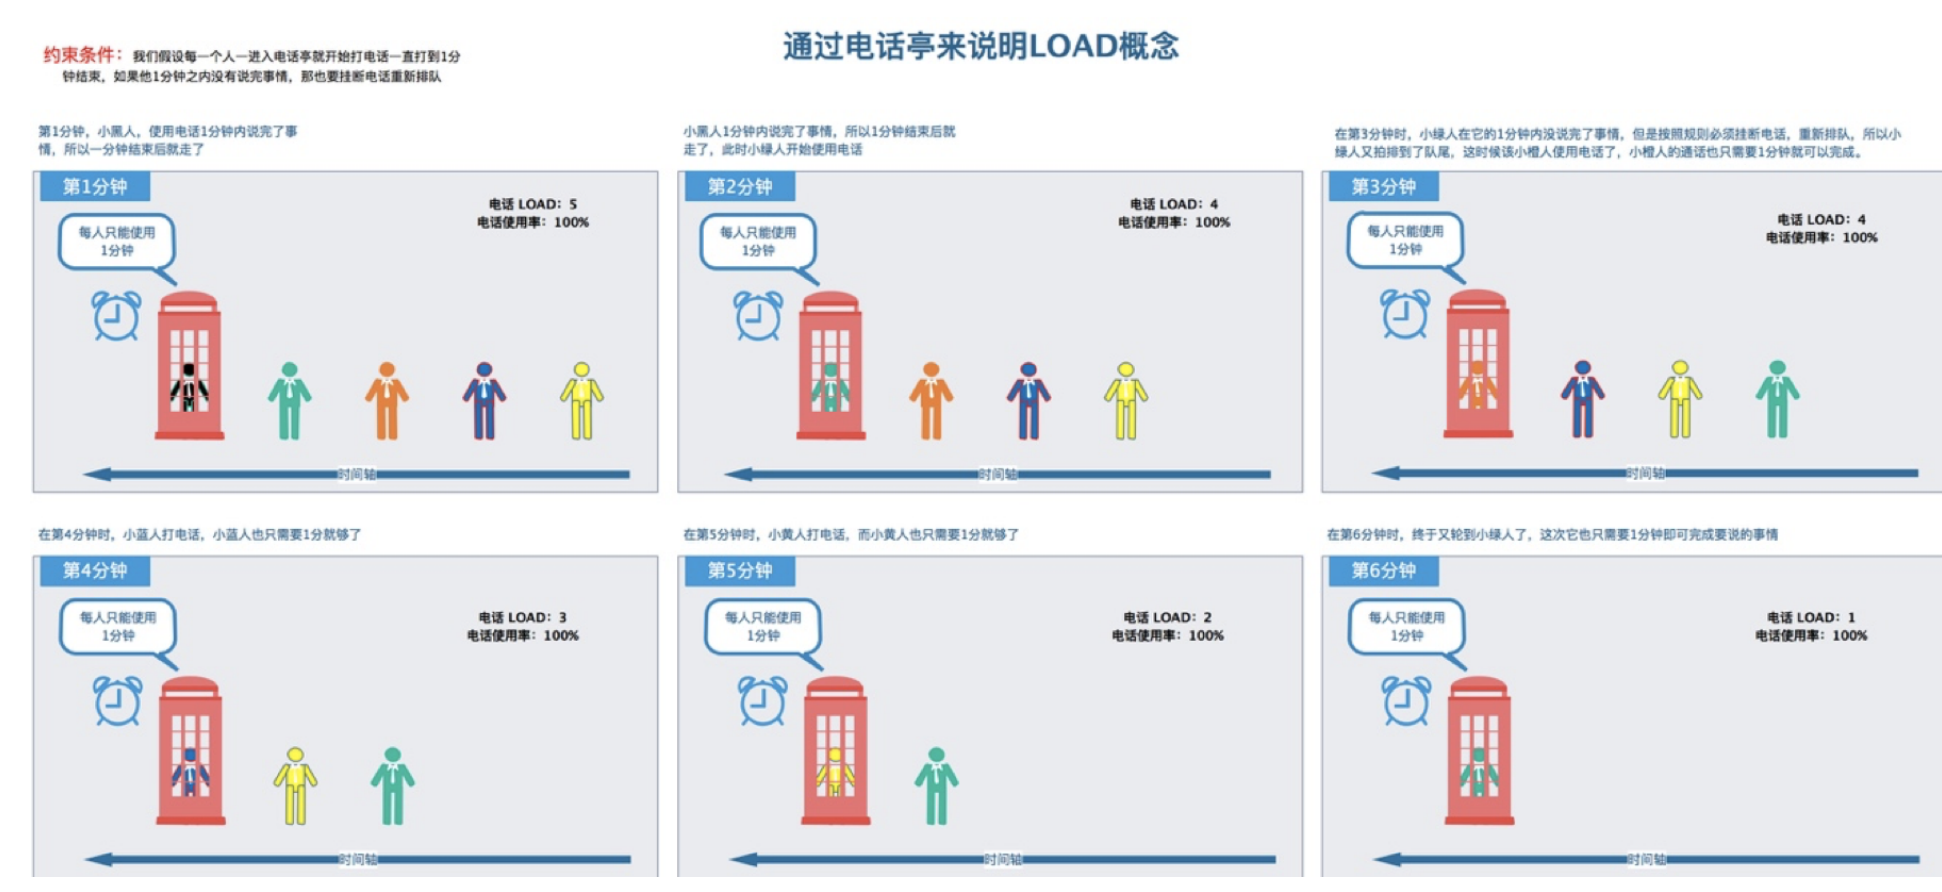
In the figure above, a telephone booth can be understood as a CPU core. From the process shown in the figure above, we can see the concept of load, and the utilization rate is always 100%.
Utilization rate
%Cpu(s): percentage of CPU occupied by user space
%CPU: percentage of CPU time used since the last update

see
cat /proc/cpuinfo
grep -c 'model name' /proc/cpuinfo
Experiment 1: observe CPU utilization
 public static void main(String[] args) {
        try {
            //Simulated CPU usage
            cpu50(Integer.parseInt(args[0]));
        } catch (NumberFormatException e) {
            e.printStackTrace();
        }
    }

    public static void cpu50(int num) {
        for (int i = 0; i < num; i++) {
            new Thread(() -> {
                while (true) {
                    long time_start;

                    int fulltime = 100;
                    int runtime = 50;
                    while (true) {
                        time_start = System.currentTimeMillis();
                        while ((System.currentTimeMillis() - time_start) < runtime) {
                        }
                        try {
                            Thread.sleep(fulltime - runtime);
                        } catch (InterruptedException e) {
                            return;
                        }
                    }
                }
            }).start();
        }


    }
Start: java -jar 2_cpu-0.0.1-SNAPSHOT.jar 8 > log.file 2>&1 &
Experiment 2: positioning CPU elevation
Method 1:
 1-Start: java -jar
 2_cpu-0.0.1-SNAPSHOT.jar 8 > log.file 2>&1 & 2-Generally speaking, the application server is usually only deployed java Application, can top Let's confirm whether it is java Command caused by application: top
 3-If yes, view java Approach ID,Command: jps -l
 4-Find out the best non CPU Thread, command: top -Hp pid 25128
 5-Will thread ID Convert to hexadecimal, command: printf "%x\n" thread  ID 623c 25148
 6-export java Stack information, according to the thread of the previous step ID Find results: Command: jstack 11976 >stack.txt grep 2ed7 stack.txt -A 20

Method 2:
Online tools: https://gceasy.io/ft-index.jsp
1-The snapshot file exported in method 1 can be uploaded to the website
High CPU of application service caused by serialization problem
1. Problems found
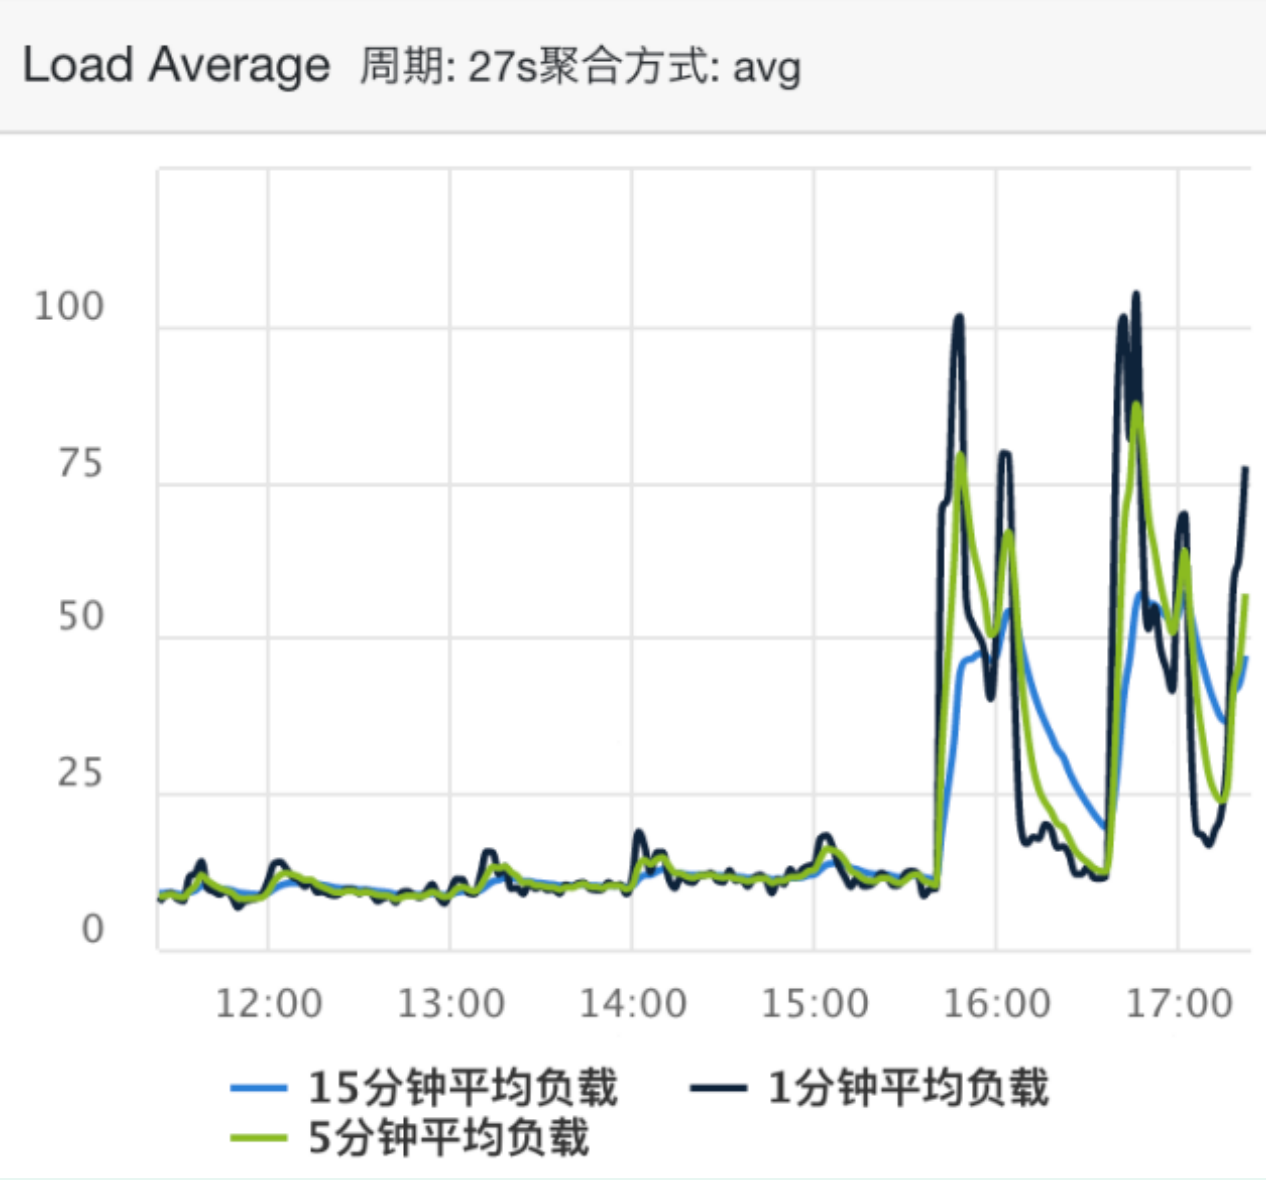
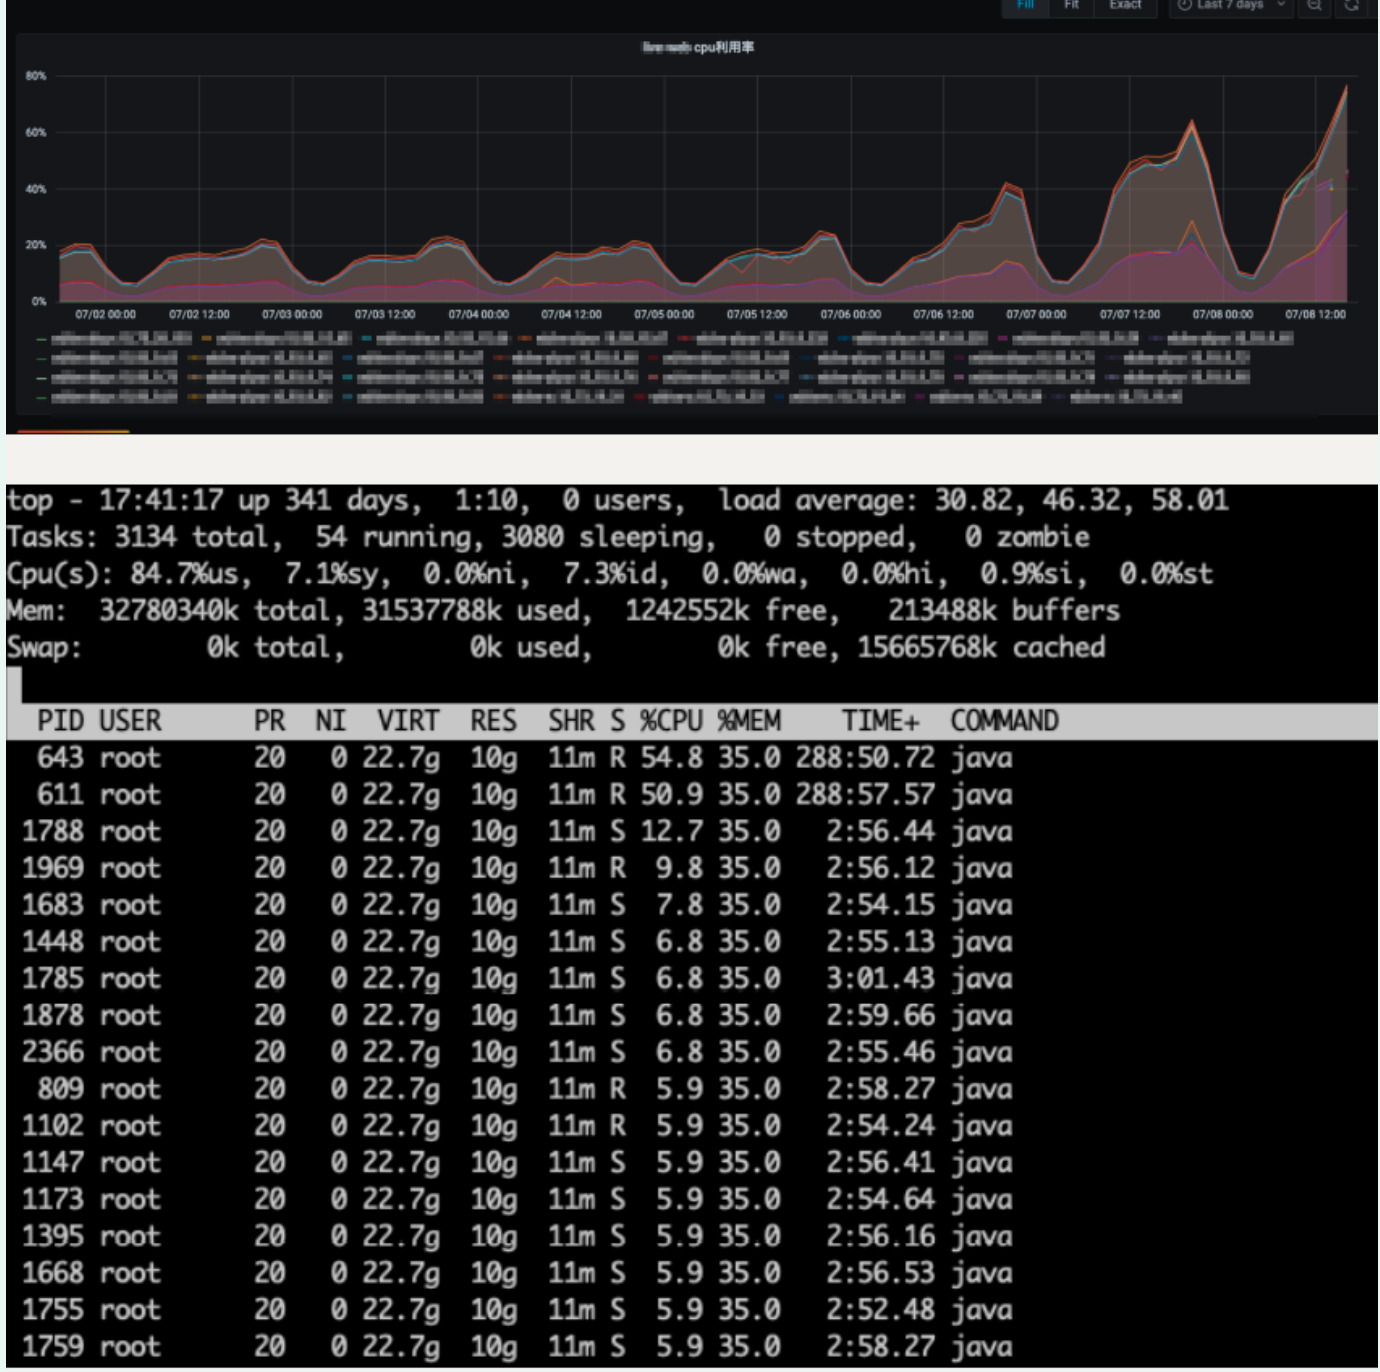
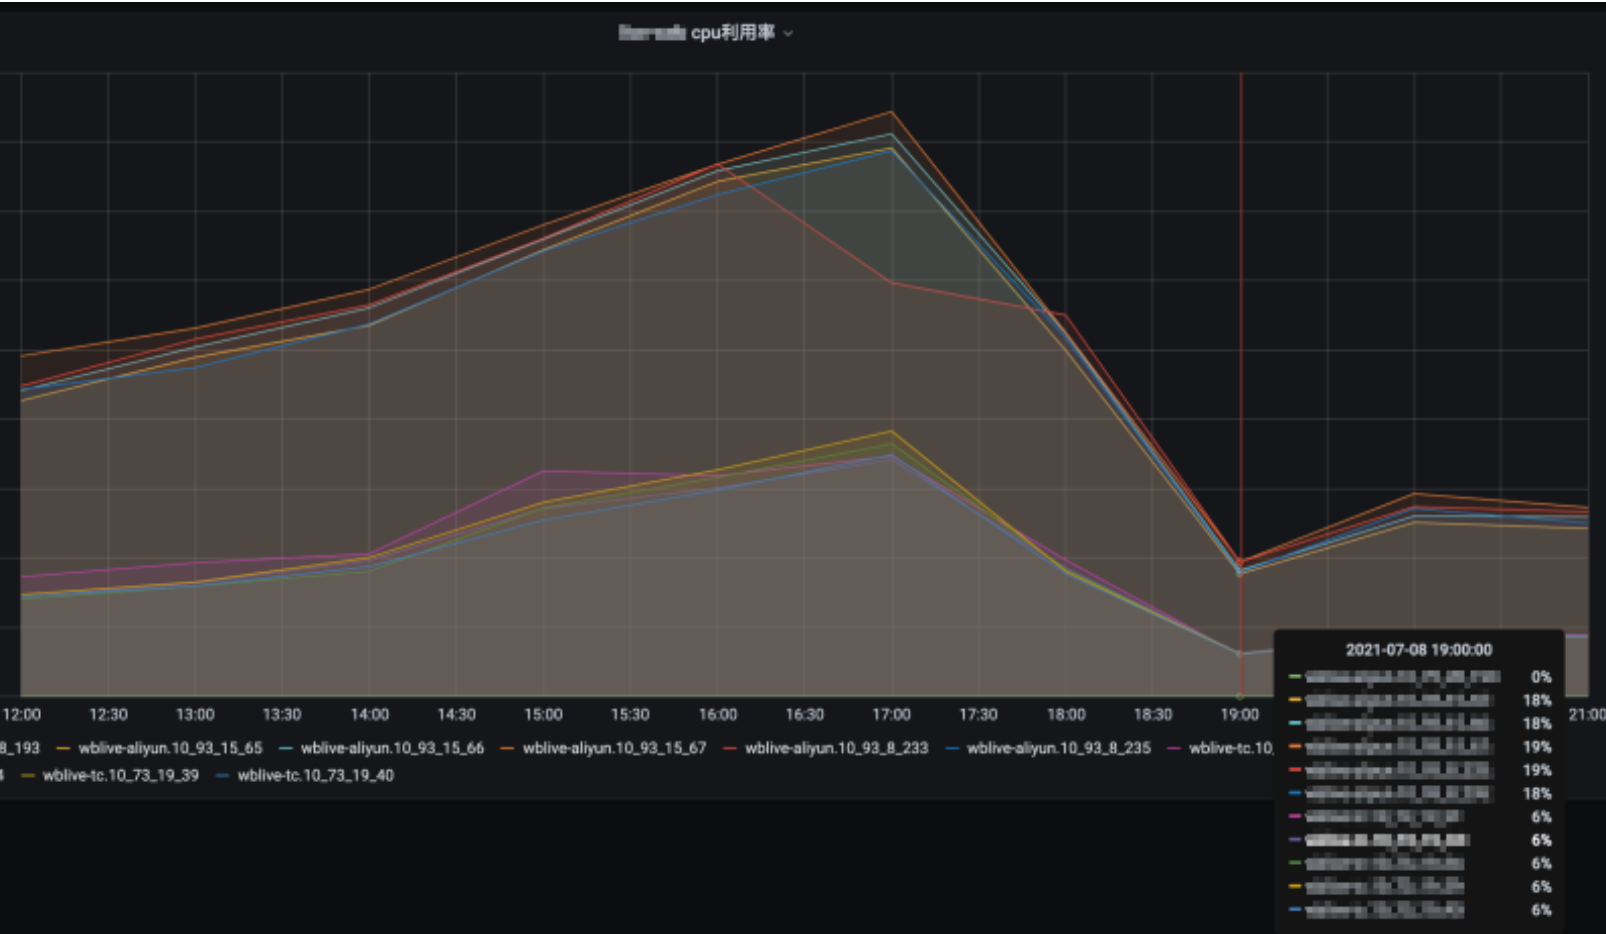
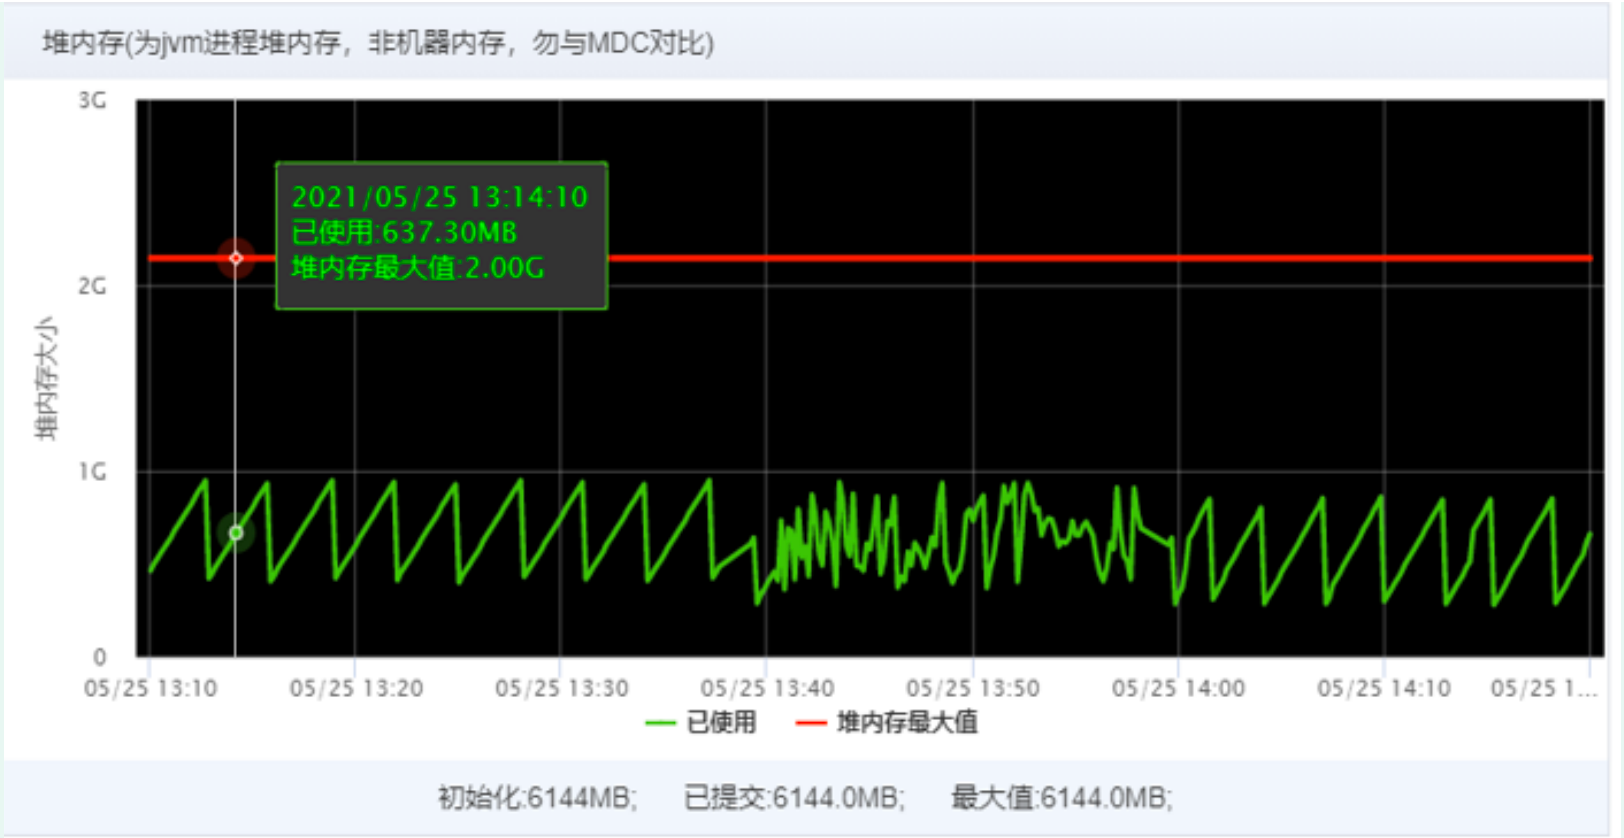
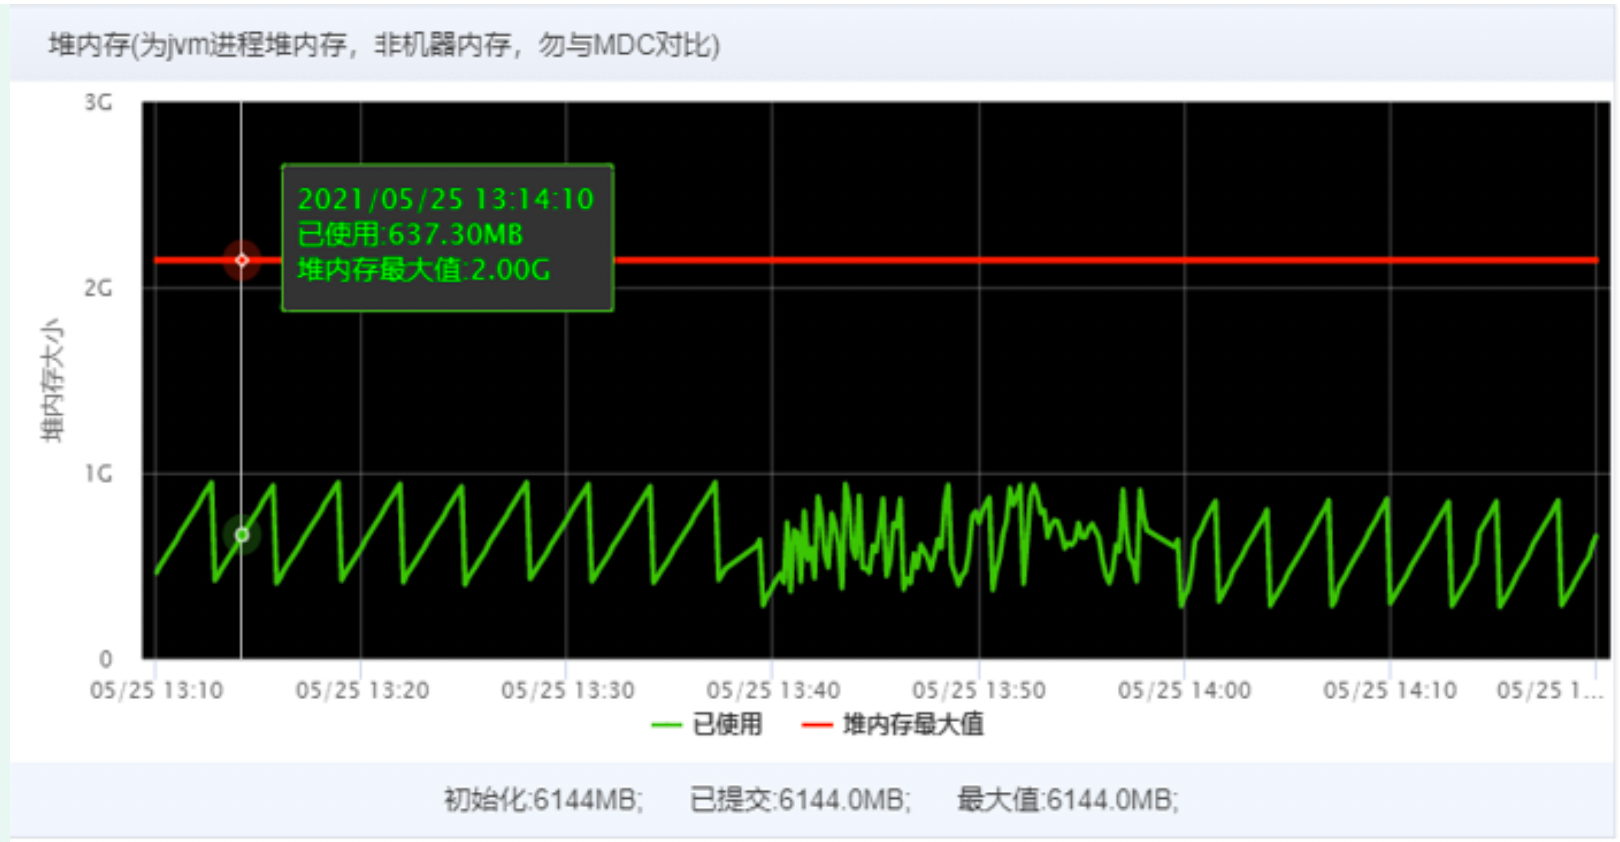
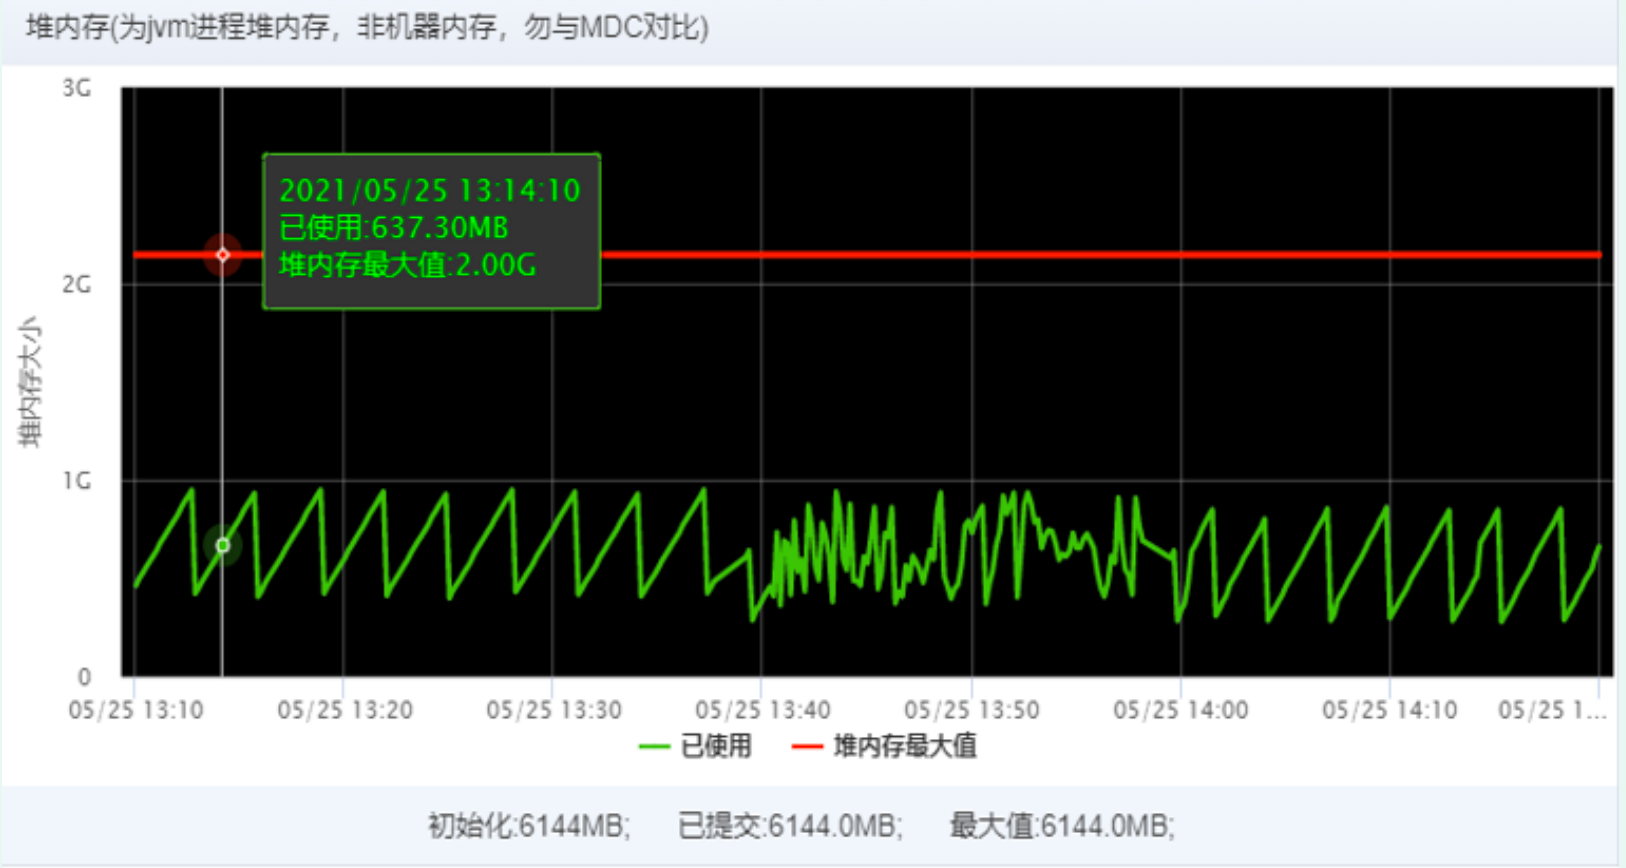
At 17:09 on July 8, the monitoring market found that the CPU of XXX web was running full, resulting in the continuous expansion of the machine and the increase of machines.
The average load diagram is as follows:
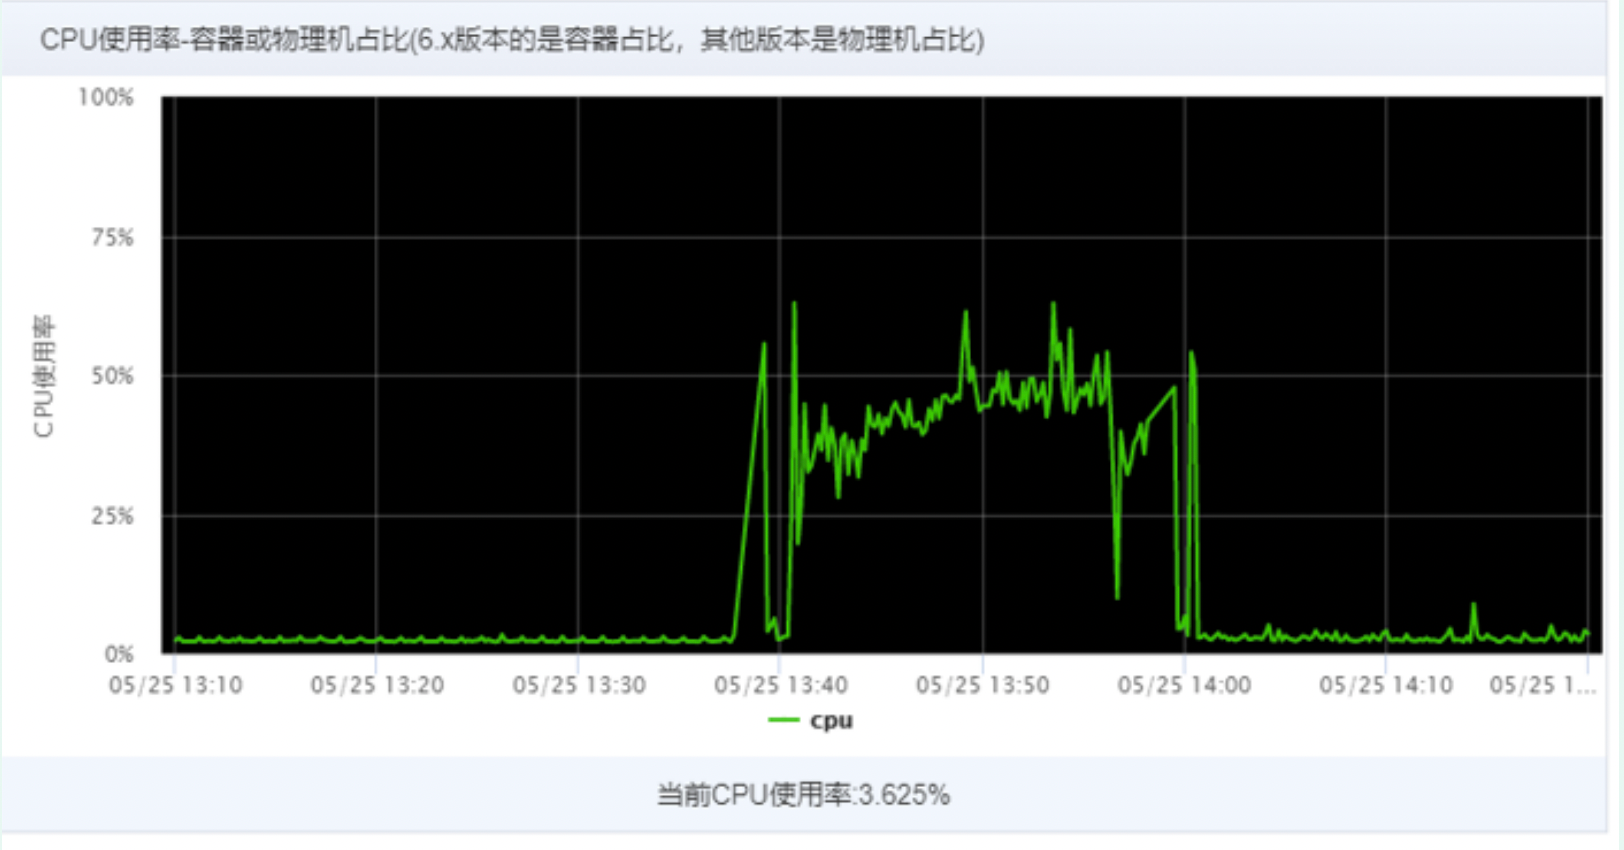
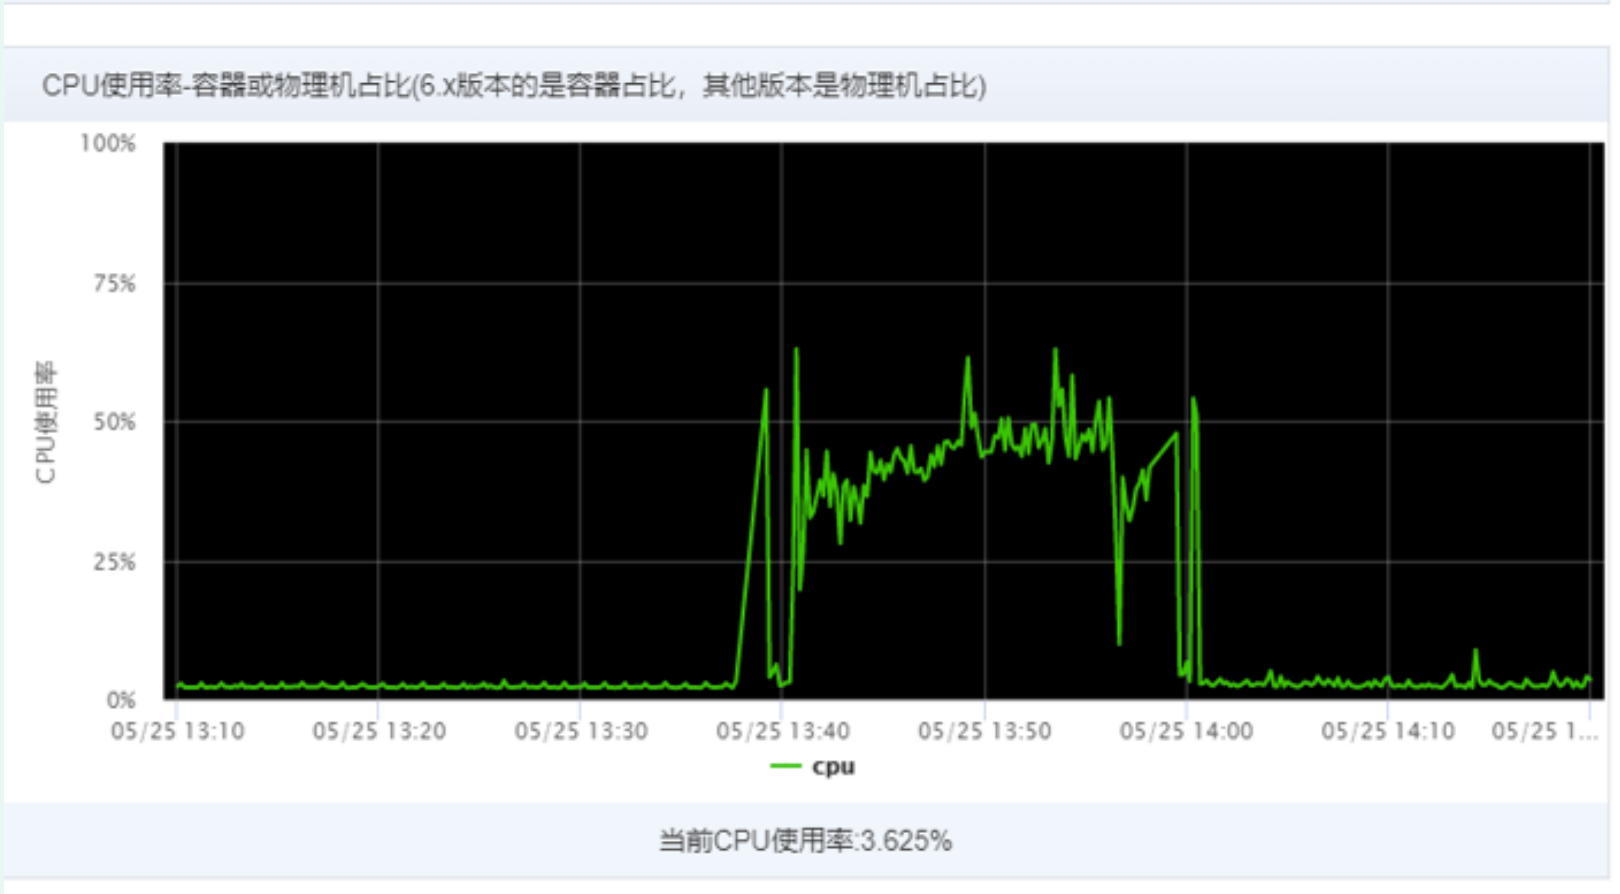
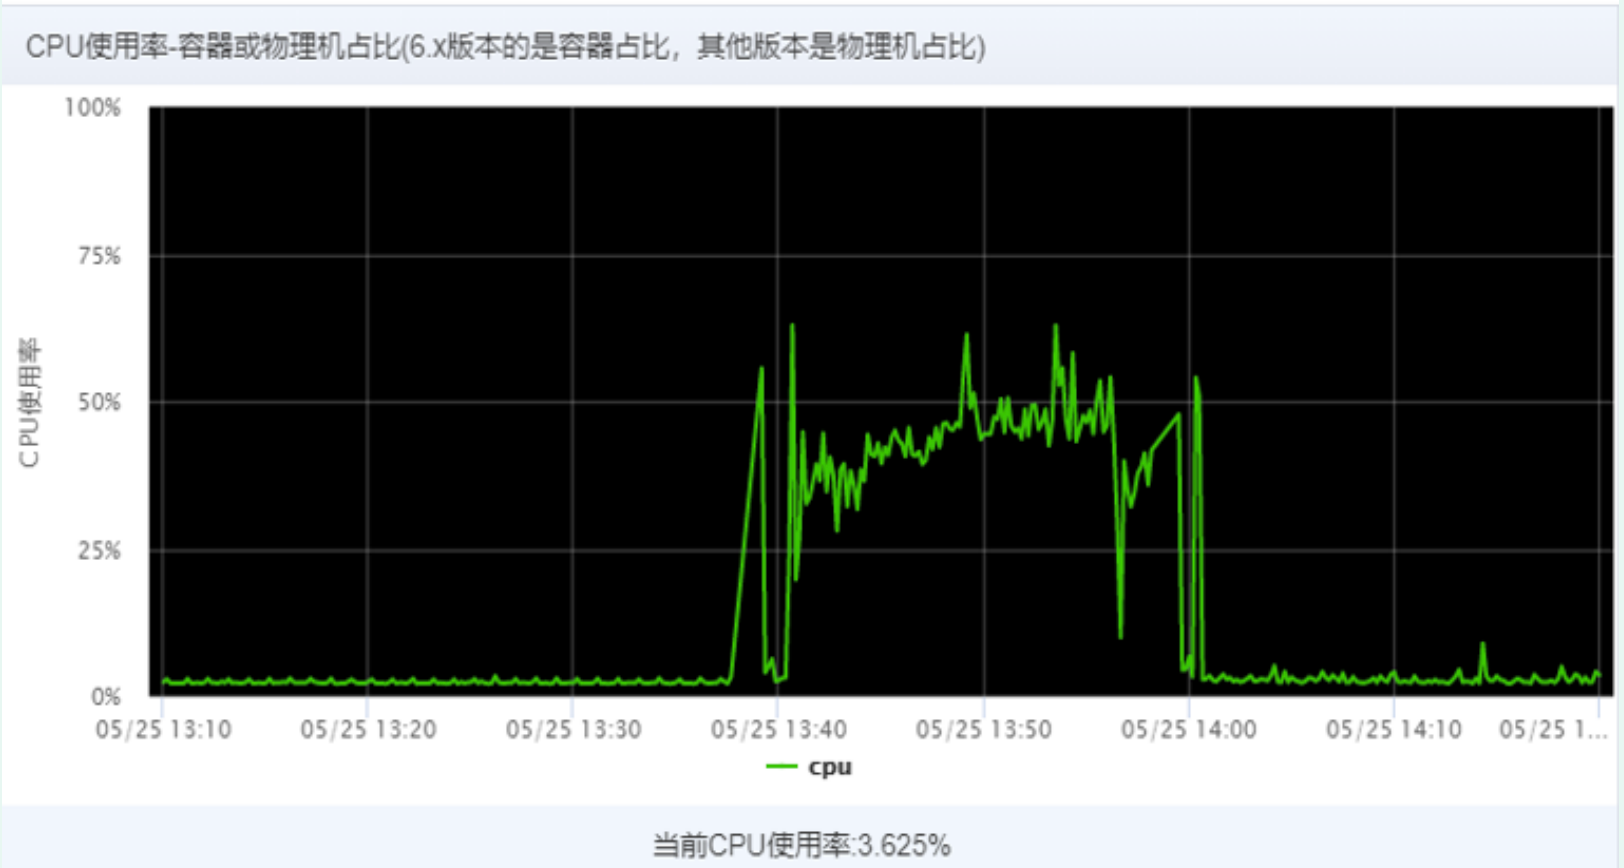
CPU utilization:
2. Analysis stage
According to the analysis of thread dump file, mainly whether there is deadlock and blocking, as well as the occupation of CPU thread, analyze
The tool adopts the online fastThread tool. Address: https://gceasy.io/ft-index.jsp
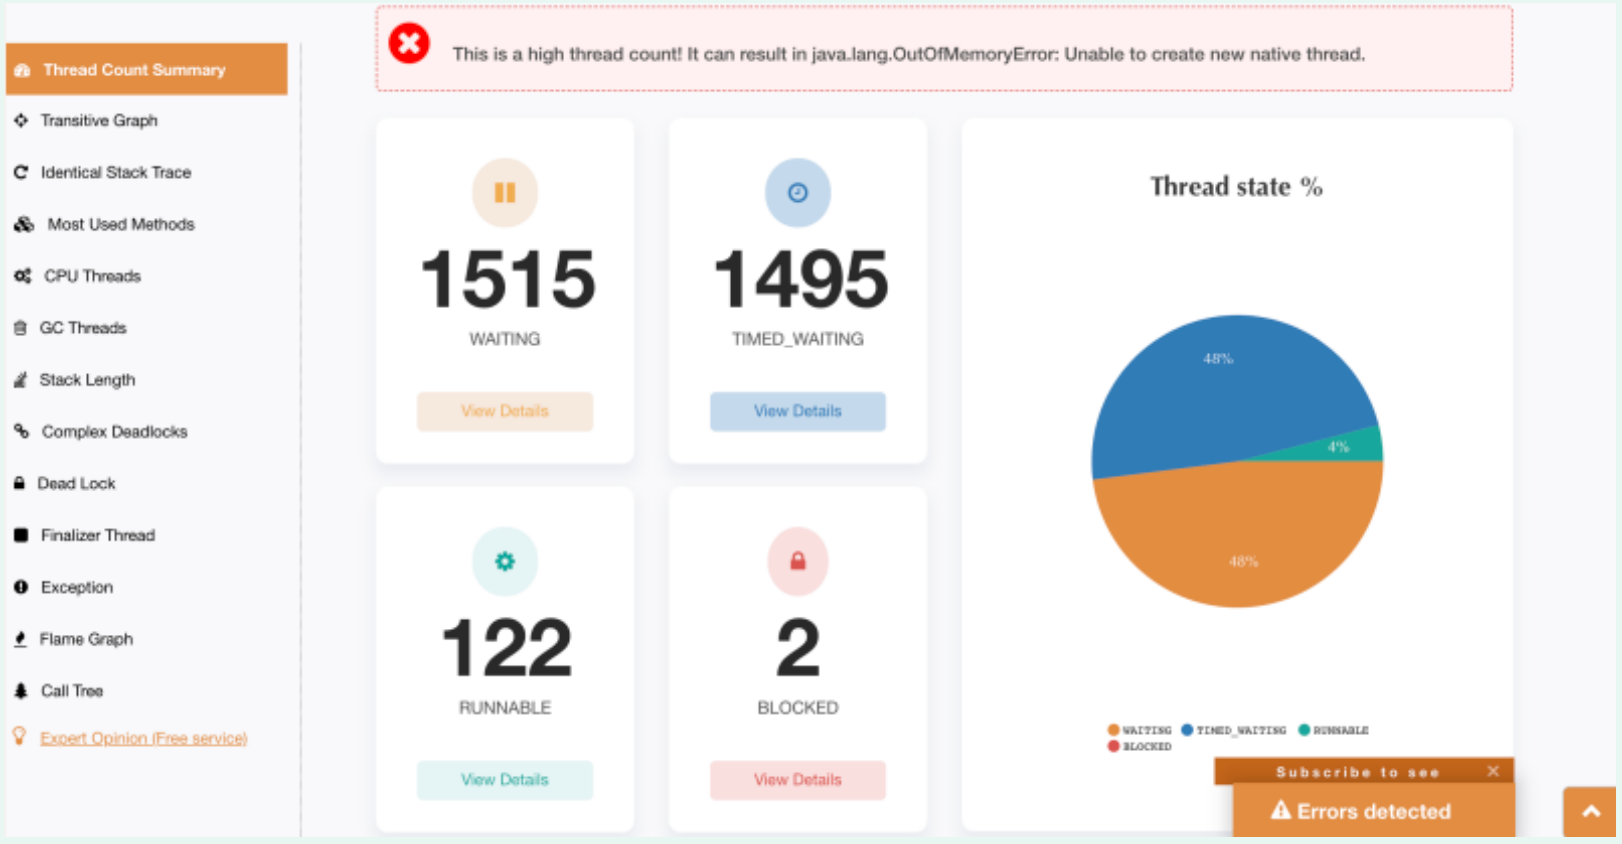
(1) View the number of threads
It can be seen from the data diagram that there are 3000 waiting threads created, suggesting that the number of high-line threads may lead to abnormal memory leakage, which may affect the creation threads of subsequent tasks.
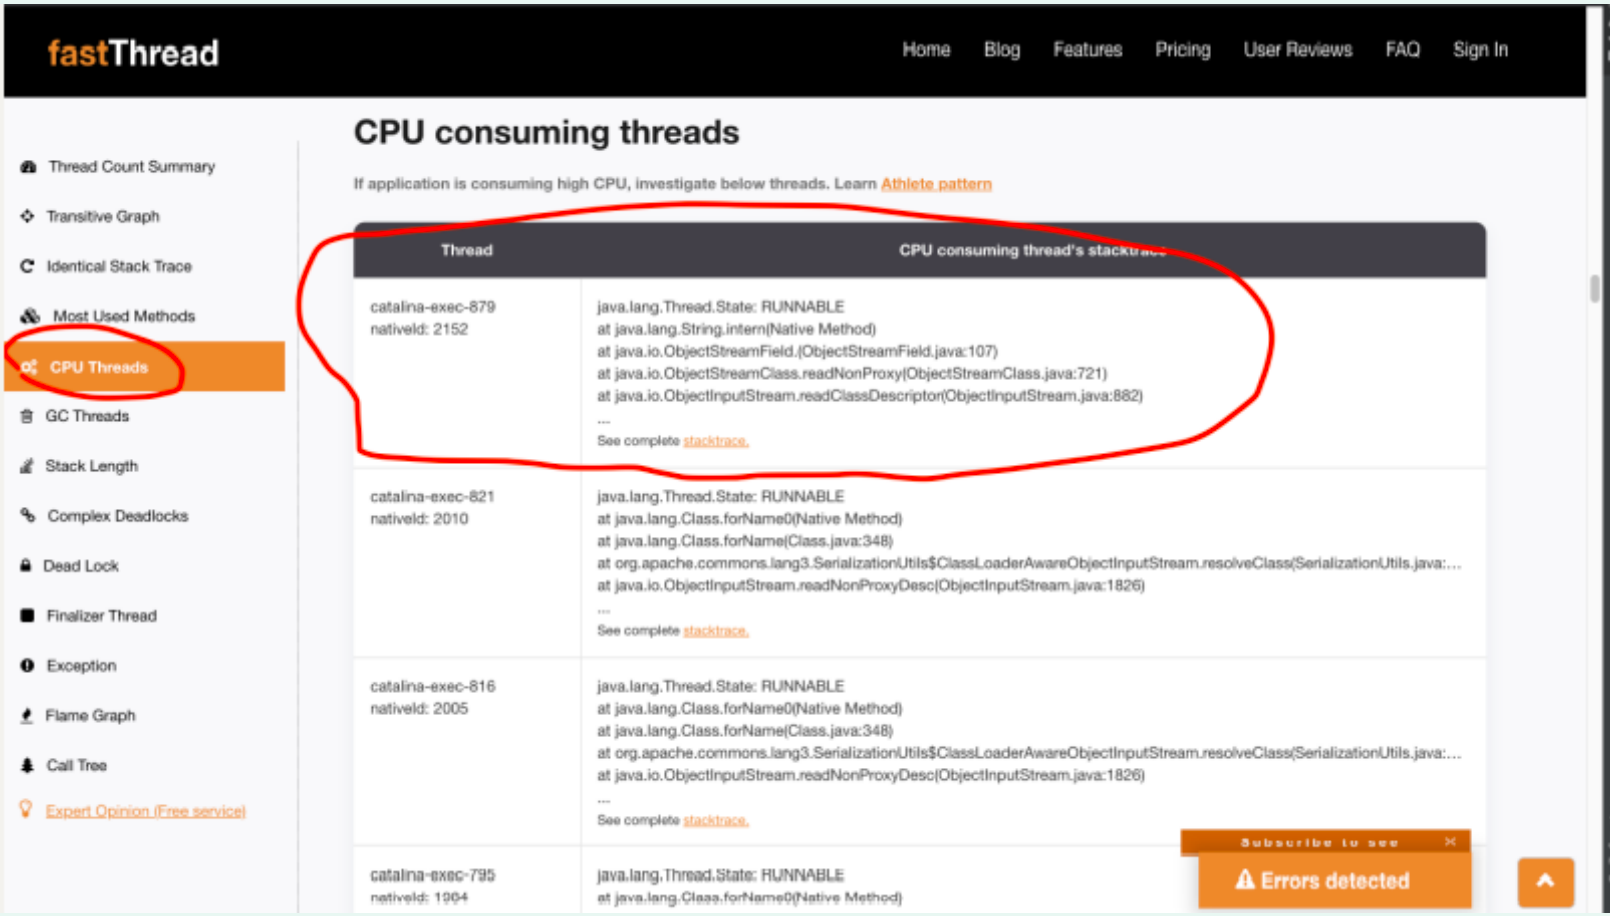
(2) View current CPU thread usage
According to the CPU threads, query the thread stack list that the CPU is executing, and you can find that most logs are similar to catalina-exec-879
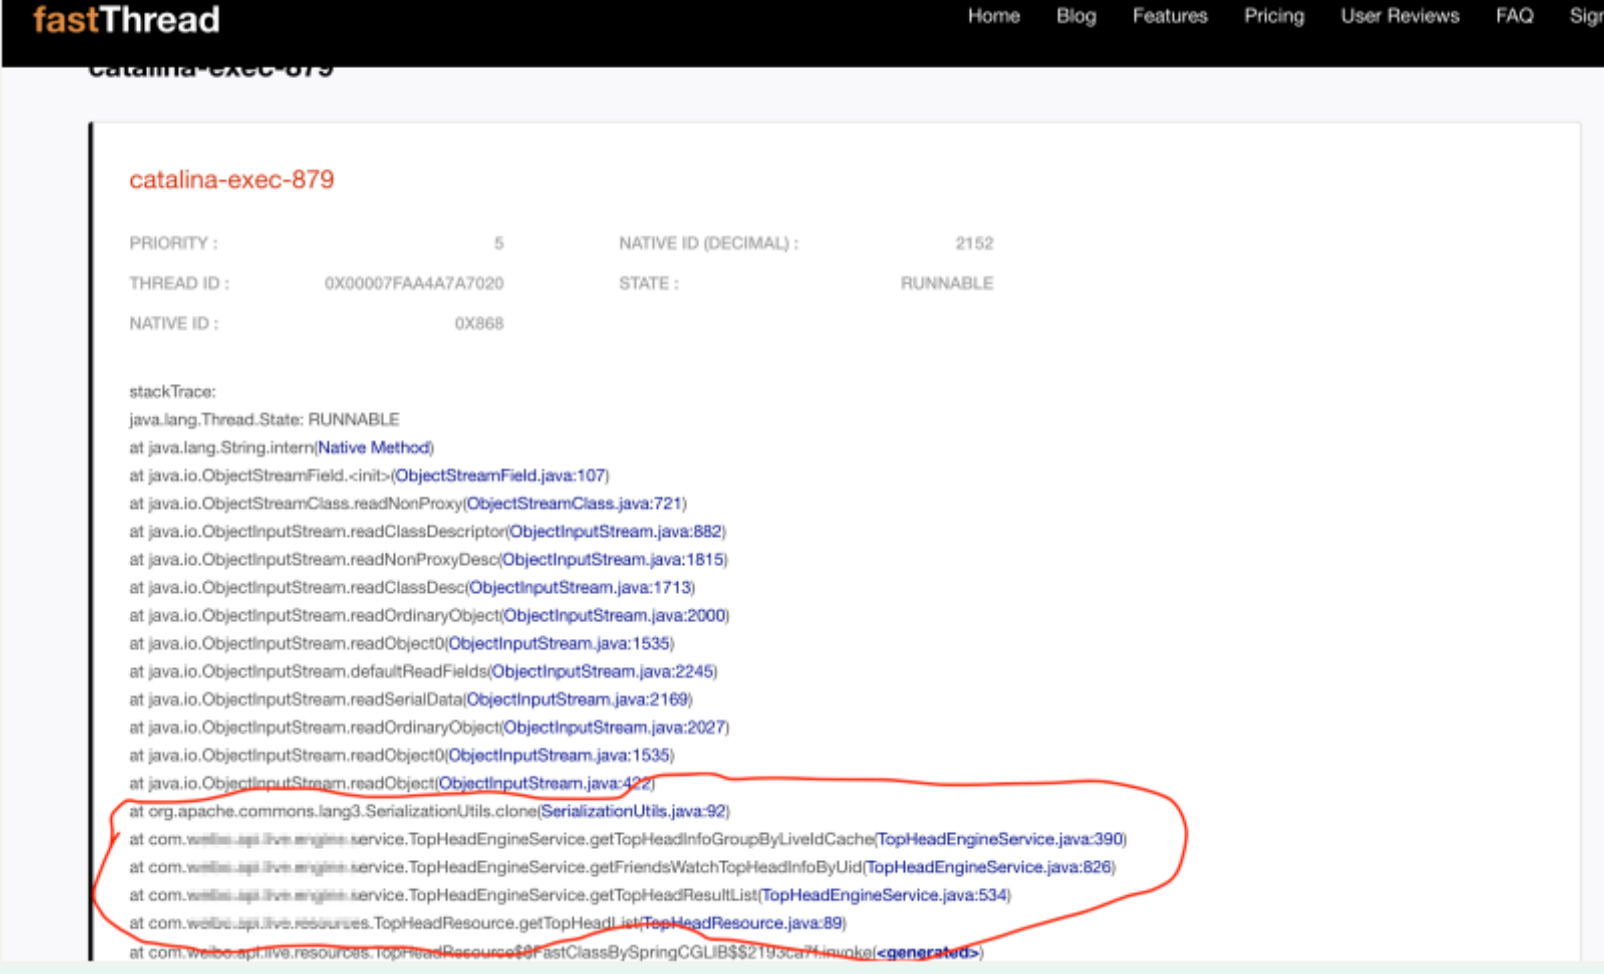
(3) Locate the problematic thread stack
View is a piece of code logic of the new avatar circle, in which there is a step that needs to deeply copy the object for future logic changes.
3. Problem recovery
Therefore, it is speculated that it may be related to the opening of a group of white list rule users on the 8th, so the white list policy configuration of changing config is temporarily adopted to reduce the gray-scale user range. After configuring push, CPU utilization returns to normal.
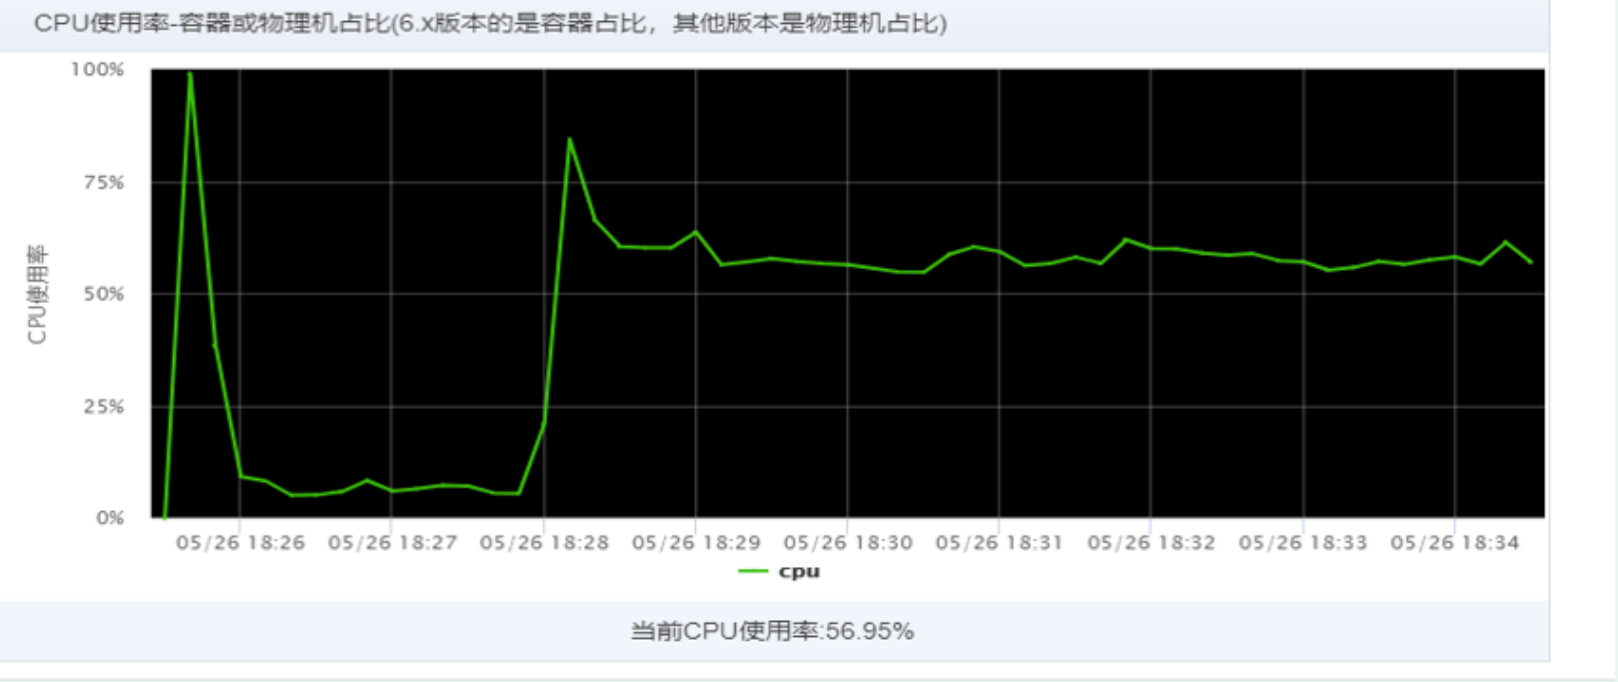
Adjusted machine CPU utilization:
The average CPU utilization of the service pool is as follows:
4. Relevant codes:
public Map<String, TopHeadInfoV3> getTopHeadInfoGroupByLiveIdCache(){
        Map<String, TopHeadInfoV3> topHeadInfoGroupByLiveIdMap =
                topHeadInfoGroupByLiveIdCache.getUnchecked("top_head_info_group_by_live_id");
        if (MapUtils.isEmpty(topHeadInfoGroupByLiveIdMap)) {
            return Collections.emptyMap();
        }
// The guava cache object cannot be modified externally. Prevent the upstream from modifying the cache object. Problems occur in concurrent scenarios
        Map<String, TopHeadInfoV3> topHeadInfoGroupByLiveIdMapDeepCopy =
                Maps.newHashMapWithExpectedSize(topHeadInfoGroupByLiveIdMap.size());
        for (Map.Entry<String, TopHeadInfoV3> entry : topHeadInfoGroupByLiveIdMap.entrySet()) {
            topHeadInfoGroupByLiveIdMapDeepCopy.put(entry.getKey(),
                    SerializationUtils.clone(entry.getValue()));
        }
        return topHeadInfoGroupByLiveIdMapDeepCopy;
    }
The methods that affect performance are the object cloning tools provided by Apache commons Toolkit:
SerializationUtils. Clone (entry. Getvalue()), the basic operation is to use ObjectInputStream and ObjectOutputSTream to serialize first and then send serialization. Cloning is frequent and time-consuming, which takes up the execution of other tasks.
 public static <T extends Serializable> T clone(final T object) {
        if (object == null) {
            return null;
        }
        final byte[] objectData = serialize(object);
        final ByteArrayInputStream bais = new ByteArrayInputStream(objectData);

        try (ClassLoaderAwareObjectInputStream in = new ClassLoaderAwareObjectInputStream(bais,
                object.getClass().getClassLoader())) {
            /*
             * when we serialize and deserialize an object,
             * it is reasonable to assume the deserialized object
             * is of the same type as the original serialized object
             */
            @SuppressWarnings("unchecked") // see above
            final T readObject = (T) in.readObject();
            return readObject;

        } catch (final ClassNotFoundException ex) {
            throw new SerializationException("ClassNotFoundException while reading cloned object data", ex);
        } catch (final IOException ex) {
            throw new SerializationException("IOException while reading or closing cloned object data", ex);
        }
    }
Source code comments:
Use serialization to deeply clone an object. This is many times slower than manually writing cloning methods on all objects in your object graph. However, for complex object graphs, or objects that do not support deep cloning, this can be a simple alternative implementation. Of course, all objects must be serializable.
5. Optimization scheme
After discussion, the method of creating objects and setting properties is temporarily adopted for object replication, and the object serialization tool is not adopted first. Implement Java Lang. clonable interface and implement the clone method.
The main object copy codes are as follows:
@Override
public TopHeadInfoV3 clone() {
    Object object = null;
try {
        object = super.clone();
        } catch (CloneNotSupportedException e) {
        return null;
        }
        TopHeadInfoV3 topHeadInfoV3 = (TopHeadInfoV3) object;
        topHeadInfoV3.playEnums = Sets.newHashSet(topHeadInfoV3.playEnums);
        topHeadInfoV3.recallTypeEnums = Sets.newHashSet(topHeadInfoV3.recallTypeEnums);
        topHeadInfoV3.behaviorEnums = Sets.newHashSet(topHeadInfoV3.behaviorEnums);
        topHeadInfoV3.micLinkUserList =
        topHeadInfoV3.micLinkUserList.stream().map(MicLinkUser::clone).collect(Collectors.toList());
        return topHeadInfoV3;
        }
6. Launch
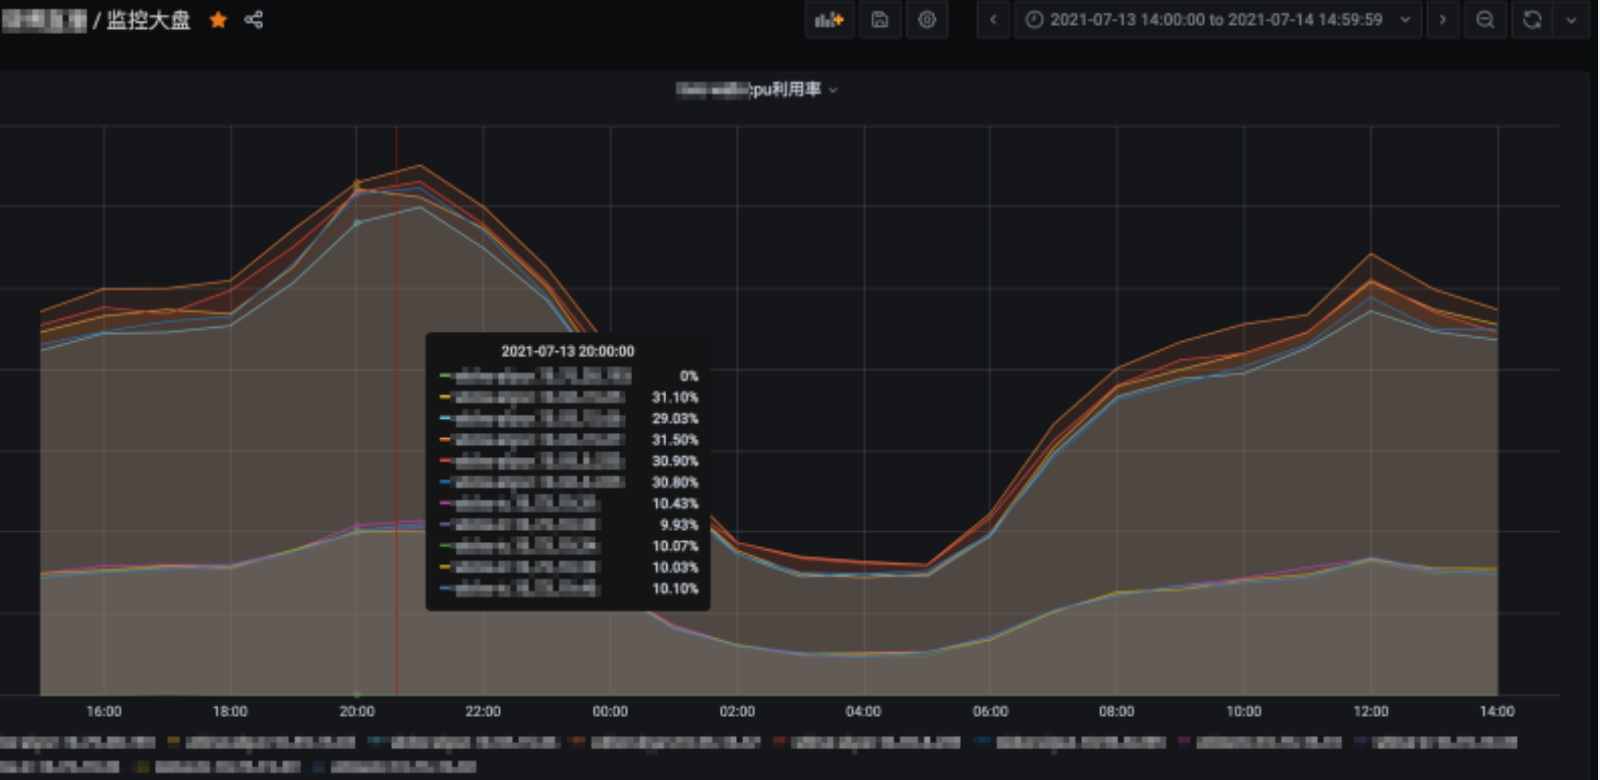
The optimization scheme was launched. After the full volume was completed at 2:00 p.m. on the 13th, the cpu utilization of the monitoring market was normal. The cpu utilization was as follows:
7. Problem summary
For the interface with relatively large flow, pressure measurement and analysis can be done in advance;
After going online, regularly check the online operation by monitoring the market, and pay attention to the machine monitoring alarm, so as to find problems in time;
In case of alarm or abnormal CPU or memory usage found in the market, the thread stack log can be printed to help analyze the thread usage through the stack analysis tool.
Serialization reference: Home · eishay/jvm-serializers Wiki · GitHub
Application service CPU soared due to FULL GC
Report worker CPU utilization is too high [618 preparation]
1, Troubleshooting process
1: Check the machine monitoring and preliminarily judge the threads that may consume CPU
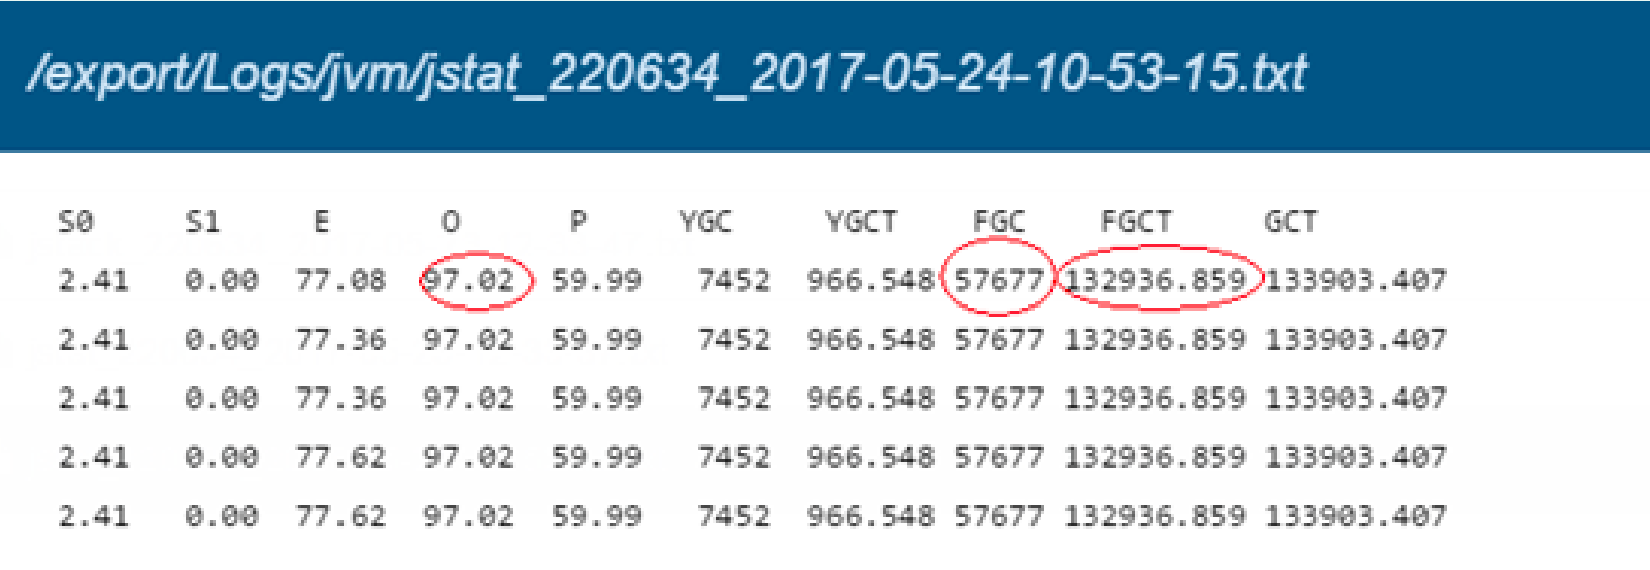
2: After exporting jstat information, it is found that the JVM takes up too much (up to 97%) in the old age, and the frequency of full-gc is too high. The full-gc takes up 36 hours in total. The initial positioning is that frequent full-gc leads to excessive CPU load.
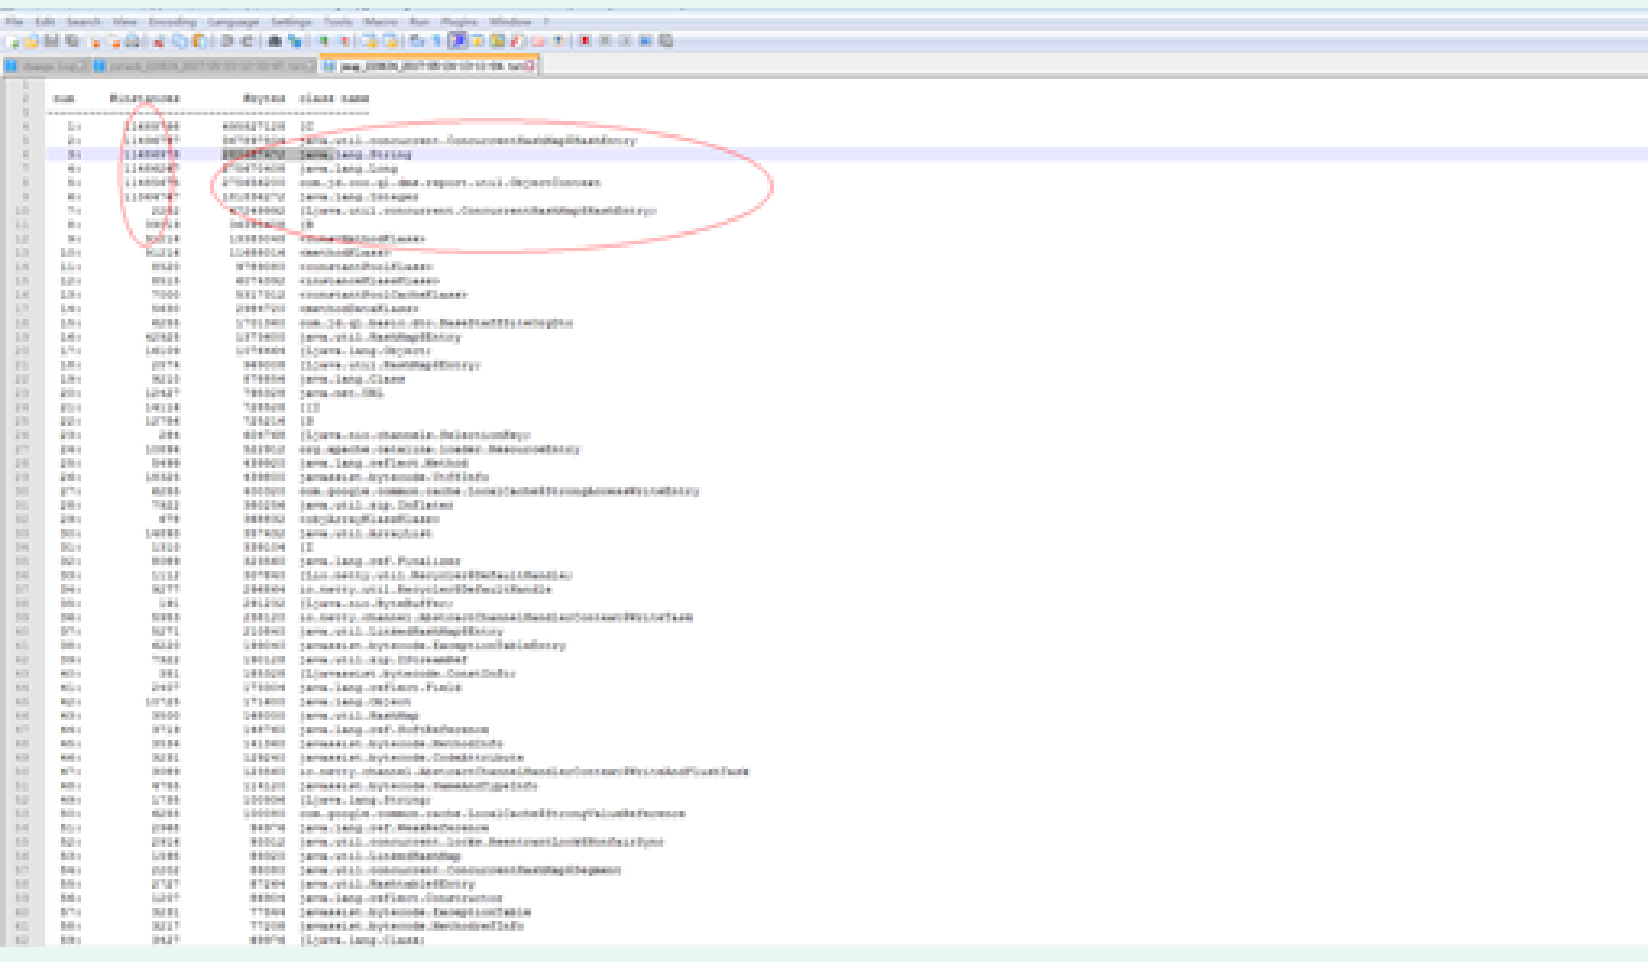
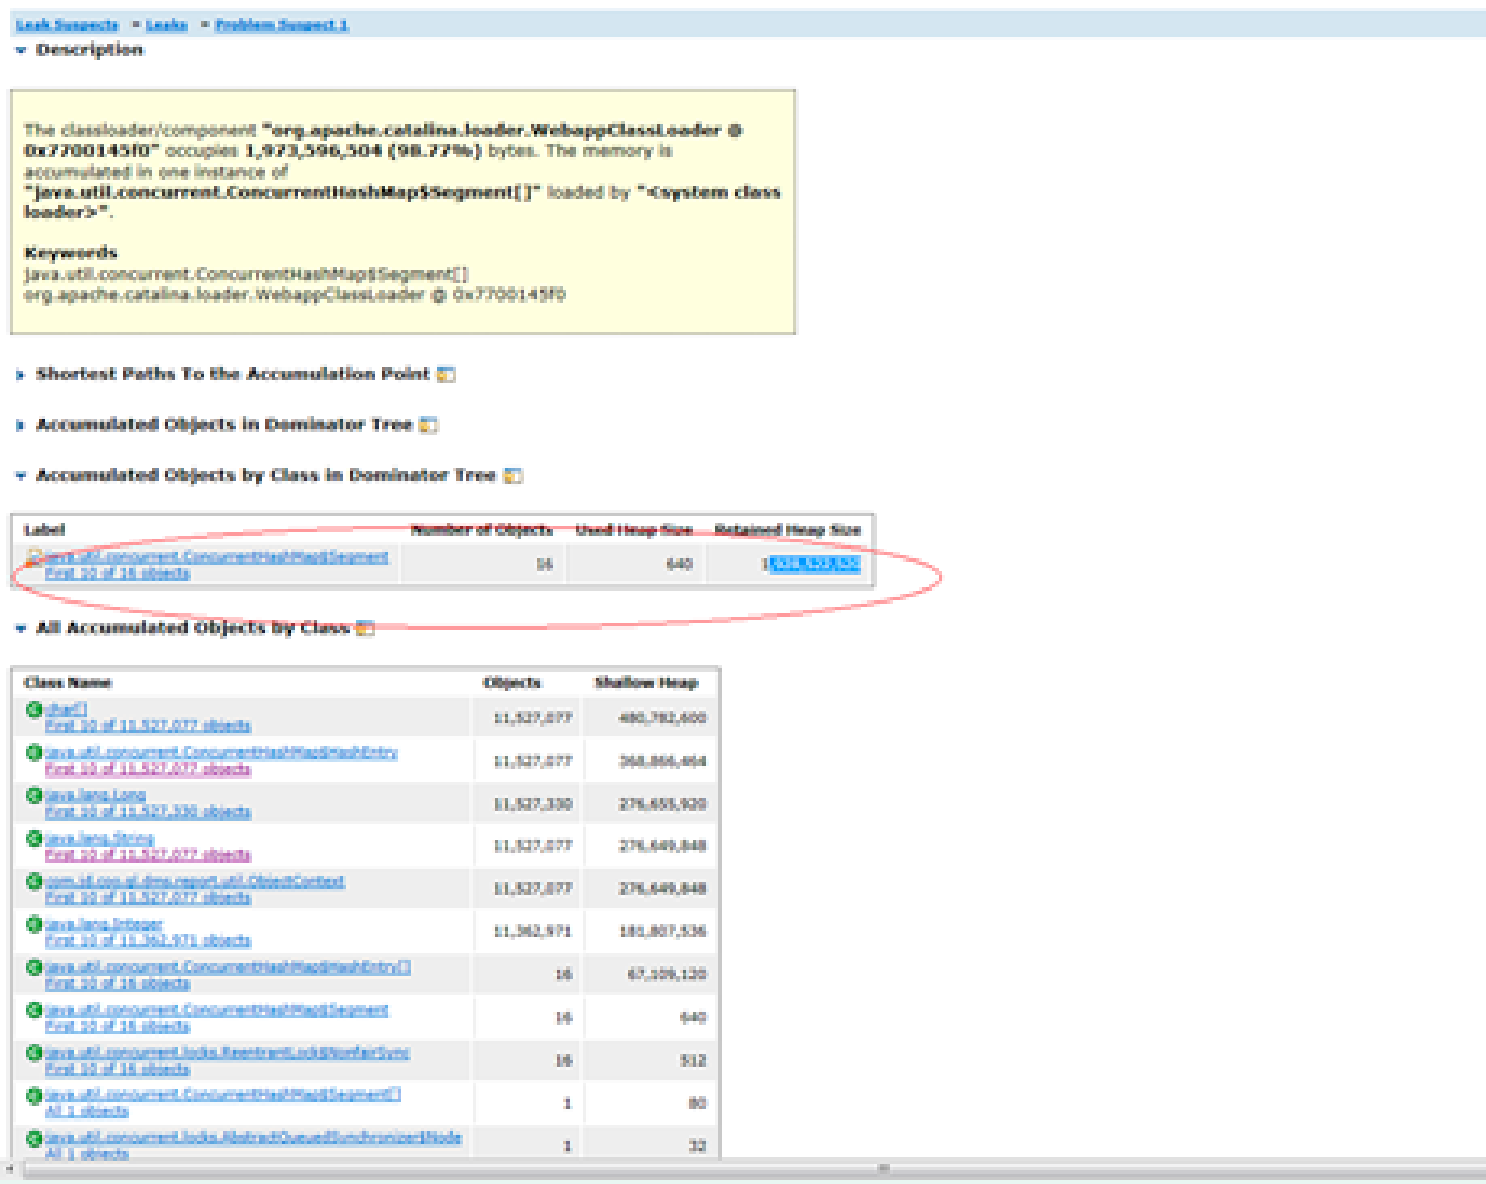
3: Using jmap – histo to export the heap summary information, we found an oversized HashMap.
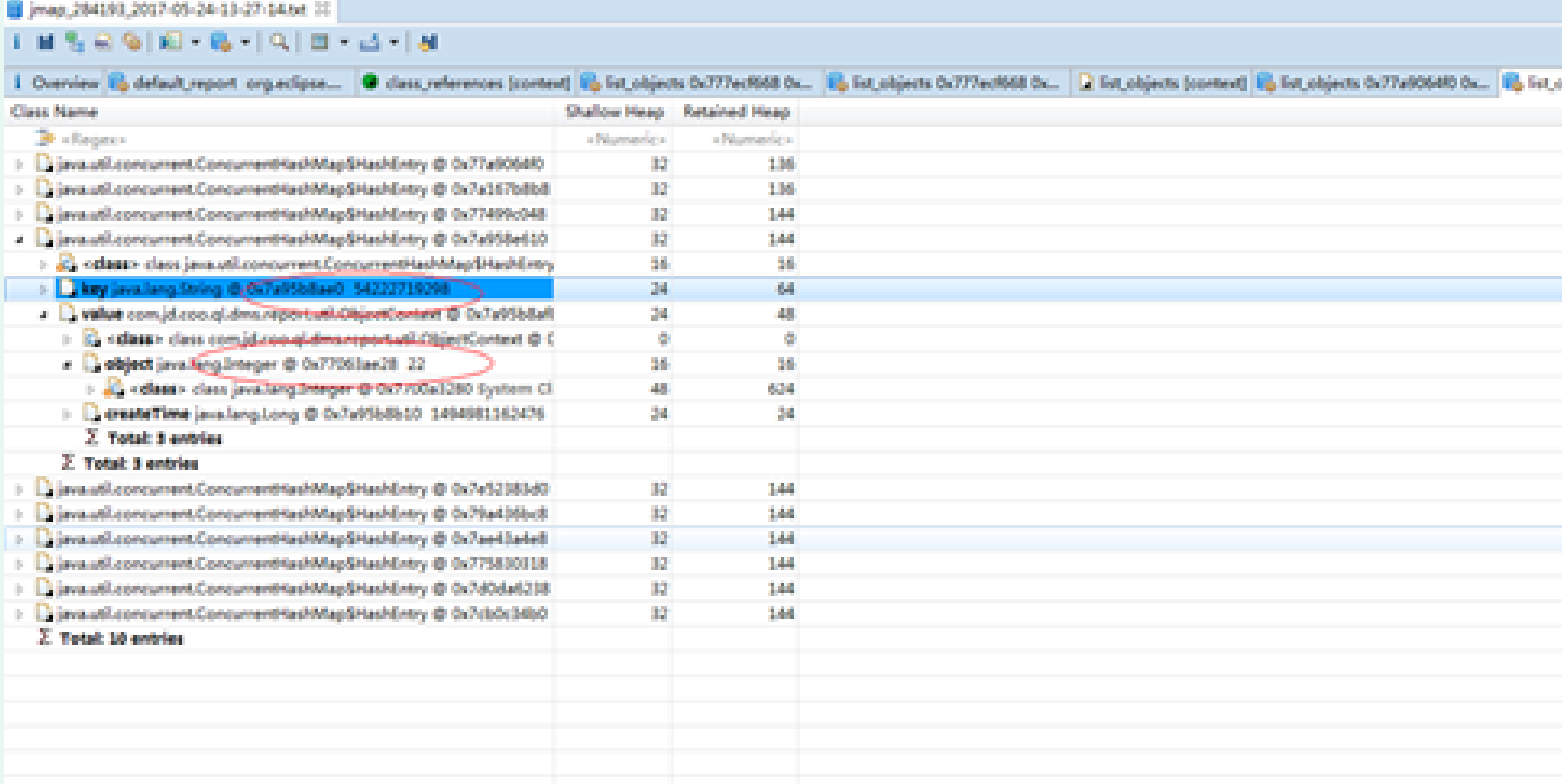
4: Use jmap – dump to export the heap. The KEY in hashMap is the waybill number
2, Summary
1: When using cache, the capacity should be estimated and the data growth rate should be considered
2: The cache should have an expiration time.
Troubleshooting of RpcException on the caller caused by gc problem
Interpretation of scenario problem cases:
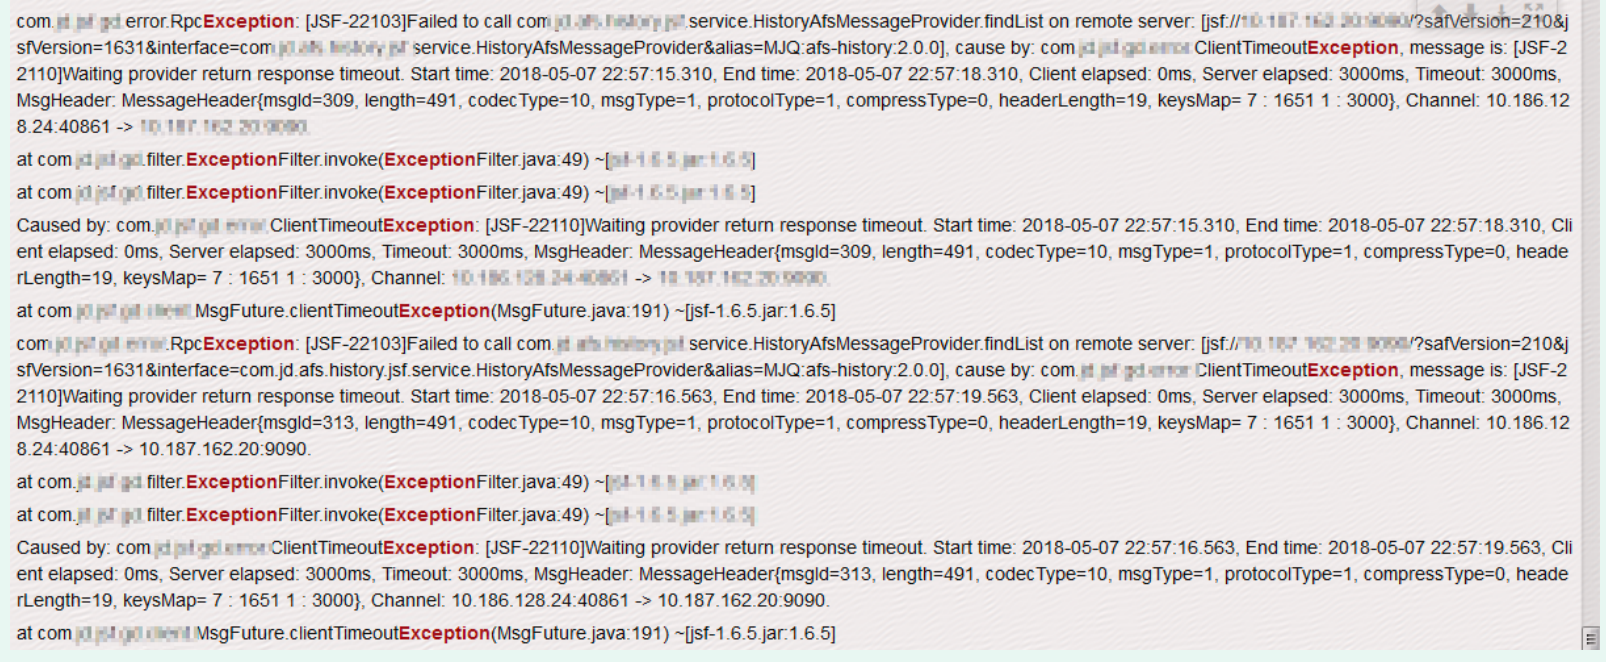
1. When the application is on-line elastic database, the calling area will have large area when querying the history library application service through the interface.
RpcException, as shown in the following figure
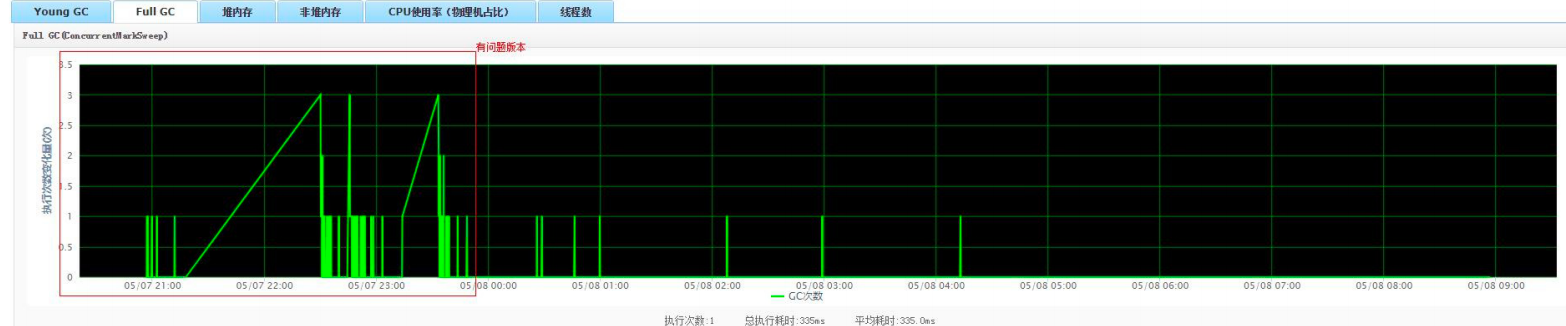
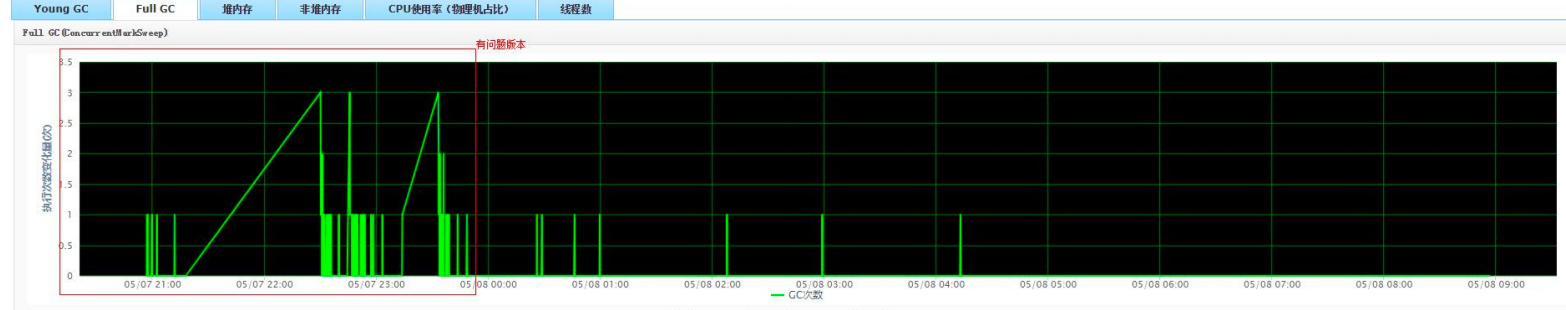
2. Observe the full gc condition of the application, as shown in the figure below, and the high-frequency full gc condition will appear
3. Observe the application and young gc, as shown in the figure below
4. When viewing jvm configuration parameters, the configuration contents are as follows (you can view them through ump, application configuration, fortress machine printing application information, etc.)
-Xss512k
-Xmn2048m
-XX:+UseConcMarkSweepGC
-XX:+UseCMSInitiatingOccupancyOnly
-XX:+CMSParallelRemarkEnabled
-XX:+CMSClassUnloadingEnabled
-XX:CMSInitiatingOccupancyFraction=60
-XX:CMSInitiatingPermOccupancyFraction=60
-XX:+PrintGCDetails
-XX:+PrintGCTimeStamps
-XX:+PrintClassHistogram
-Xloggc:/export/Logs/jvm/gc.log
5. Print the memory through the jstat command, as shown in the following figure
Command: jstat -gcutil pid
S0 S1 E O P YGC YGCT FGC FGCT GCT
4.26 0.00 71.92 28.36 59.99 3374 427.474 599 1071.941 1499.415
4.26 0.00 72.17 28.36 59.99 3374 427.474 599 1071.941 1499.415
4.26 0.00 72.43 28.36 59.99 3374 427.474 599 1071.941 1499.415
4.26 0.00 73.08 28.36 59.99 3374 427.474 599 1071.941 1499.415
4.26 0.00 73.09 28.36 59.99 3374 427.474 599 1071.941 1499.415
6. We have previously configured the jvm parameters to print gc logs, as shown below
66289.394: [GC66289.394: [ParNew: 1685902K->8995K(1887488K), 0.1182020 secs] 2289213K-
>612400K(3984640K), 0.1188790 secs] [Times: user=0.45 sys=0.01, real=0.12 secs]
66312.916: [GC66312.916: [ParNew: 1686819K->8220K(1887488K), 0.1287130 secs] 2290224K-
>611674K(3984640K), 0.1296130 secs] [Times: user=0.48 sys=0.02, real=0.13 secs]
66317.050: [GC [1 CMS-initial-mark: 603454K(2097152K)] 884210K(3984640K), 0.1249350 secs] [Times:
user=0.13 sys=0.01, real=0.12 secs]
66317.176: [CMS-concurrent-mark-start]
66317.567: [CMS-concurrent-mark: 0.391/0.391 secs] [Times: user=1.45 sys=0.06, real=0.40 secs]
66317.567: [CMS-concurrent-preclean-start]
66317.586: [CMS-concurrent-preclean: 0.017/0.018 secs] [Times: user=0.02 sys=0.00, real=0.01
secs]
66317.586: [CMS-concurrent-abortable-preclean-start]
CMS: abort preclean due to time 66322.639: [CMS-concurrent-abortable-preclean: 3.043/5.053 secs]
[Times: user=3.36 sys=0.32, real=5.06 secs]
66322.643: [GC[YG occupancy: 525674 K (1887488 K)]66322.643: [Rescan (parallel) , 2.3838210
secs]66325.027: [weak refs processing, 0.0014400 secs]66325.029: [class unloading, 0.0305350
secs]66325.059: [scrub symbol table, 0.0141910 secs]66325.074: [scrub string table, 0.0032960
secs] [1 CMS-remark: 603454K(2097152K)] 1129128K(3984640K), 2.4410070 secs] [Times: user=9.16
sys=0.40, real=2.44 secs]
66325.085: [CMS-concurrent-sweep-start]
66325.444: [CMS-concurrent-sweep: 0.318/0.358 secs] [Times: user=0.51 sys=0.04, real=0.36 secs]
66325.444: [CMS-concurrent-reset-start]
66325.450: [CMS-concurrent-reset: 0.006/0.006 secs] [Times: user=0.01 sys=0.00, real=0.01 secs]
66347.427: [GC66347.427: [ParNew: 1686044K->11073K(1887488K), 0.1323420 secs] 2269768K-
>595648K(3984640K), 0.1330670 secs] [Times: user=0.49 sys=0.02, real=0.13 secs]
in summary:
From the gc log, we can see that the CMS remark phase takes a long time. If the frequent full gc and the remark time is relatively long, it will lead to a large area of timeout at the calling end. Next, we need to check the memory through the jstat command and see why the frequent full gc occurs in combination with the configured jvm startup parameters. The jvm startup parameter is configured with - XX:CMSInitiatingPermOccupancyFraction=60. When the persistent tape uses 60% of the space, a full gc will be triggered. Because the persistent tape stores static files, the persistent tape generally has no significant impact on garbage collection. Therefore, consider removing this configuration item.
Solution:
Persistent tapes are used to store static files. Nowadays, Java classes, methods, etc. persistent generation generally has no significant impact on garbage collection. After application startup, the usage of persistent tapes accounts for nearly 60%, so this configuration item can be considered to be removed.
At the same time, add the configuration item - XX:+CMSScavengeBeforeRemark to start young gc once before CMS GC. The purpose is to reduce the reference of old gen to ygc gen and reduce the cost of remark (it can be observed from the above case that 80% of the GC time of CMS is in the remark stage)
The jvm startup parameters are corrected as follows:
-Xss512k
-XX:+UseConcMarkSweepGC
-XX:+UseCMSInitiatingOccupancyOnly
-XX:CMSInitiatingOccupancyFraction=80
-XX:+CMSScavengeBeforeRemark
-XX:+CMSParallelRemarkEnabled
-XX:+PrintGCDetails
-XX:+PrintGCDateStamps
-Xloggc:/export/Logs/jvm/gc.log
-javaagent:/export/servers/jtrace-agent/pinpoint-bootstrap-1.6.2.jar
-Dpinpoint.applicationName=afs
-Dpinpoint.sampling.rate=100
Note: compared with the problematic version, the configuration item: - XX:CMSInitiatingPermOccupancyFraction=60 is removed.
-20: Cmsinitiatingoccupancyfraction is modified to 80( Concurrent Mark Sweep (CMS)
Collector (oracle.com) ), add the configuration item - XX:+CMSScavengeBeforeRemark for better observation
gc log, modify the time stamp, and print the format as - XX:+PrintGCDateStamps
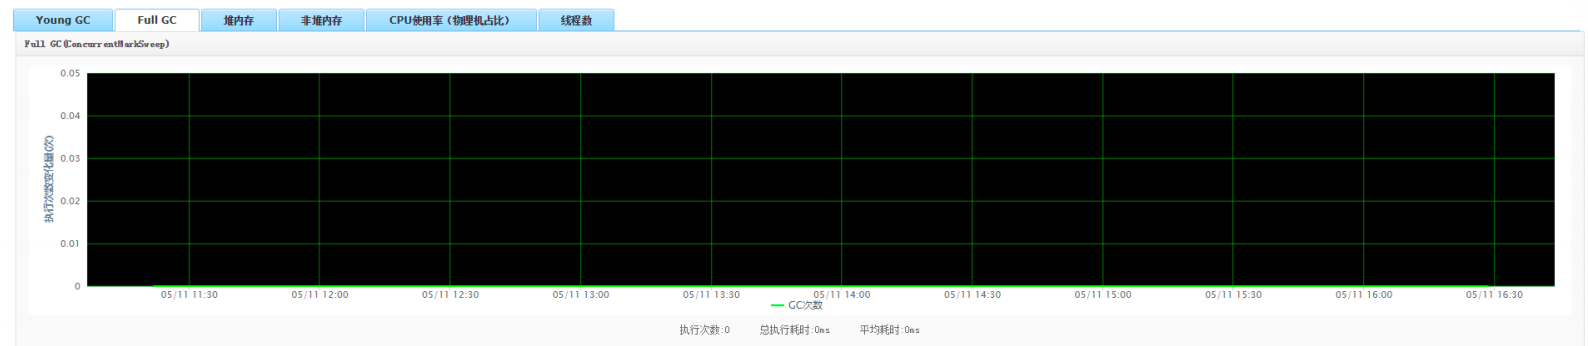
The corrected results are shown in the figure below:
1. The calling end invokes the service normally, and rpc exception no longer appears
2. The application of young gc is as follows
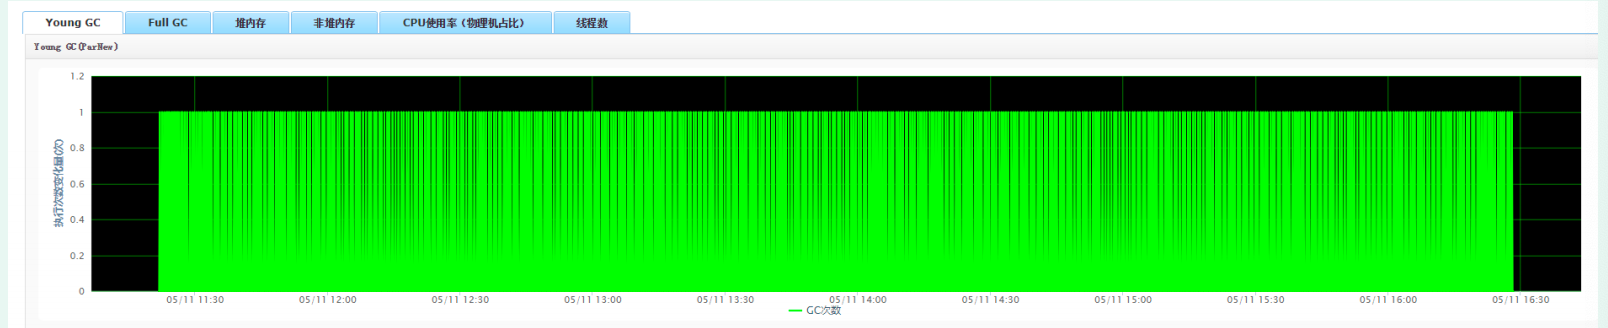
3. The application of full gc is as follows
High CPU of application service caused by excessive batch data
Problem scenario
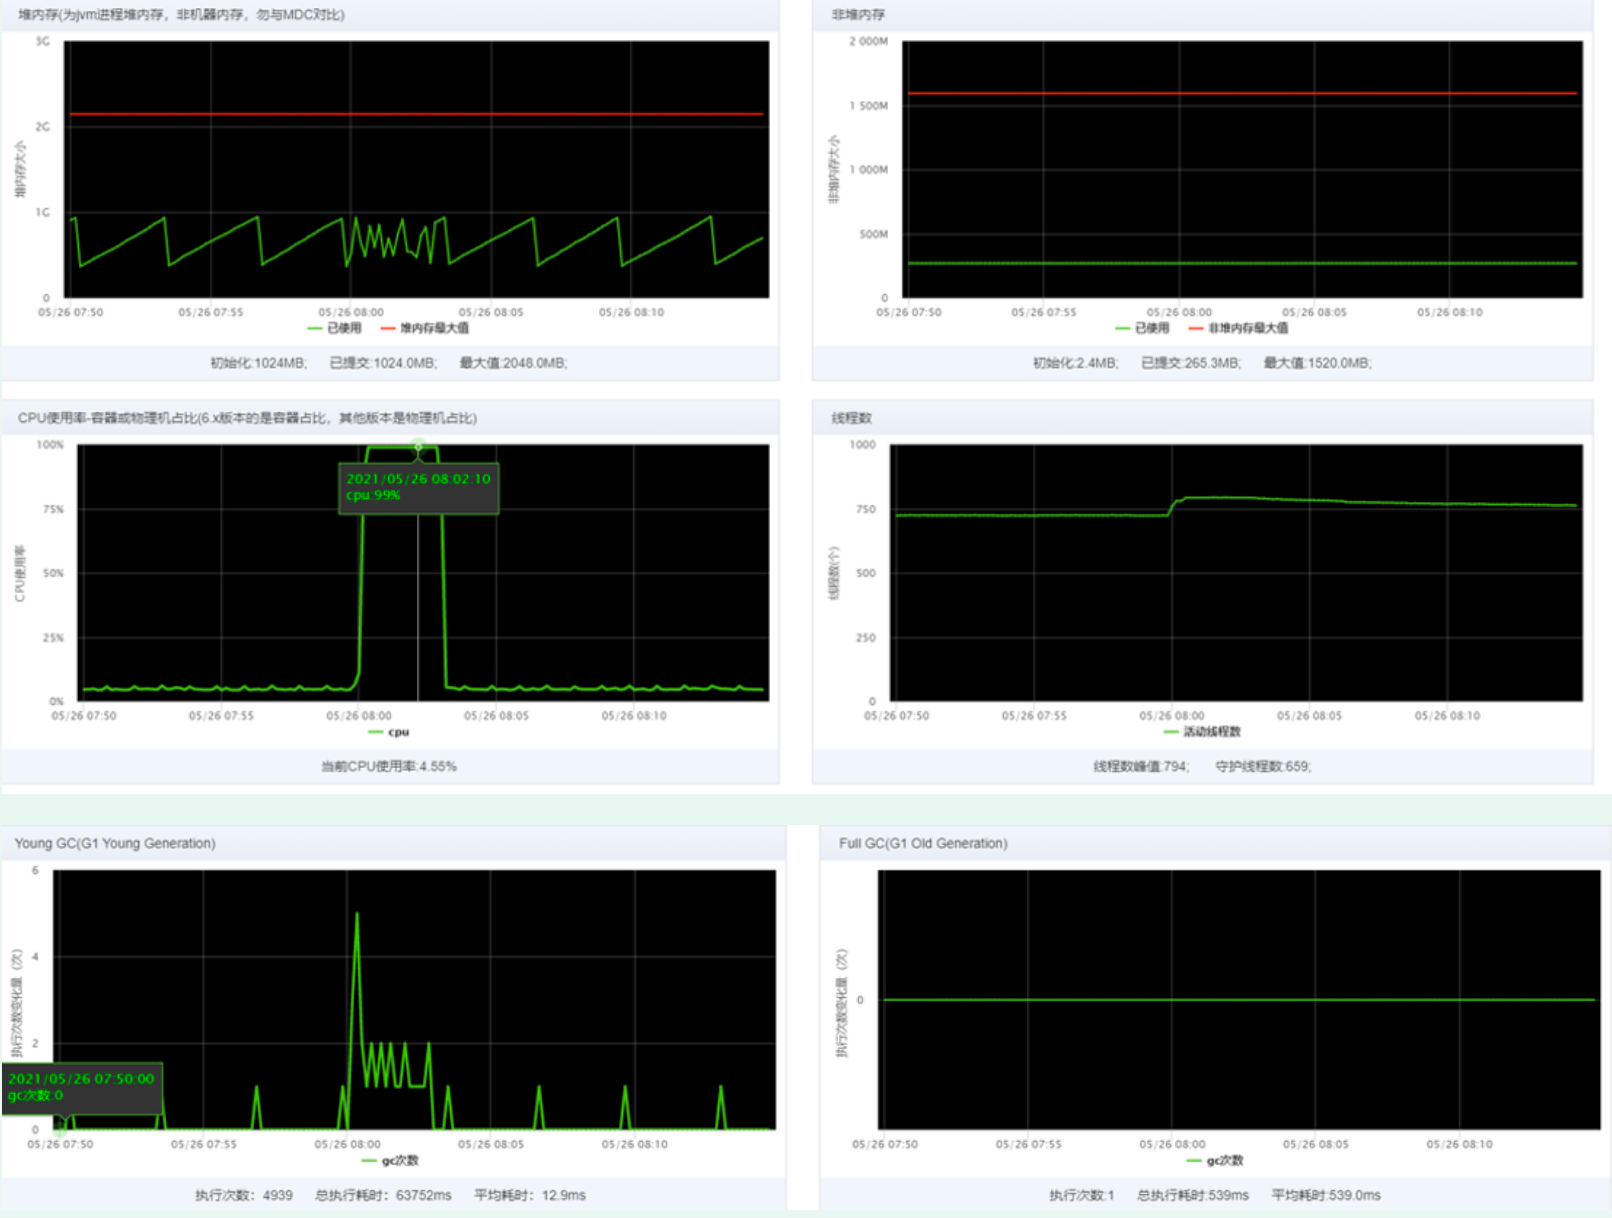
A timed task job receives an alarm that the cpu is continuously used for more than 90% (the configured time is 180s);
Problem location
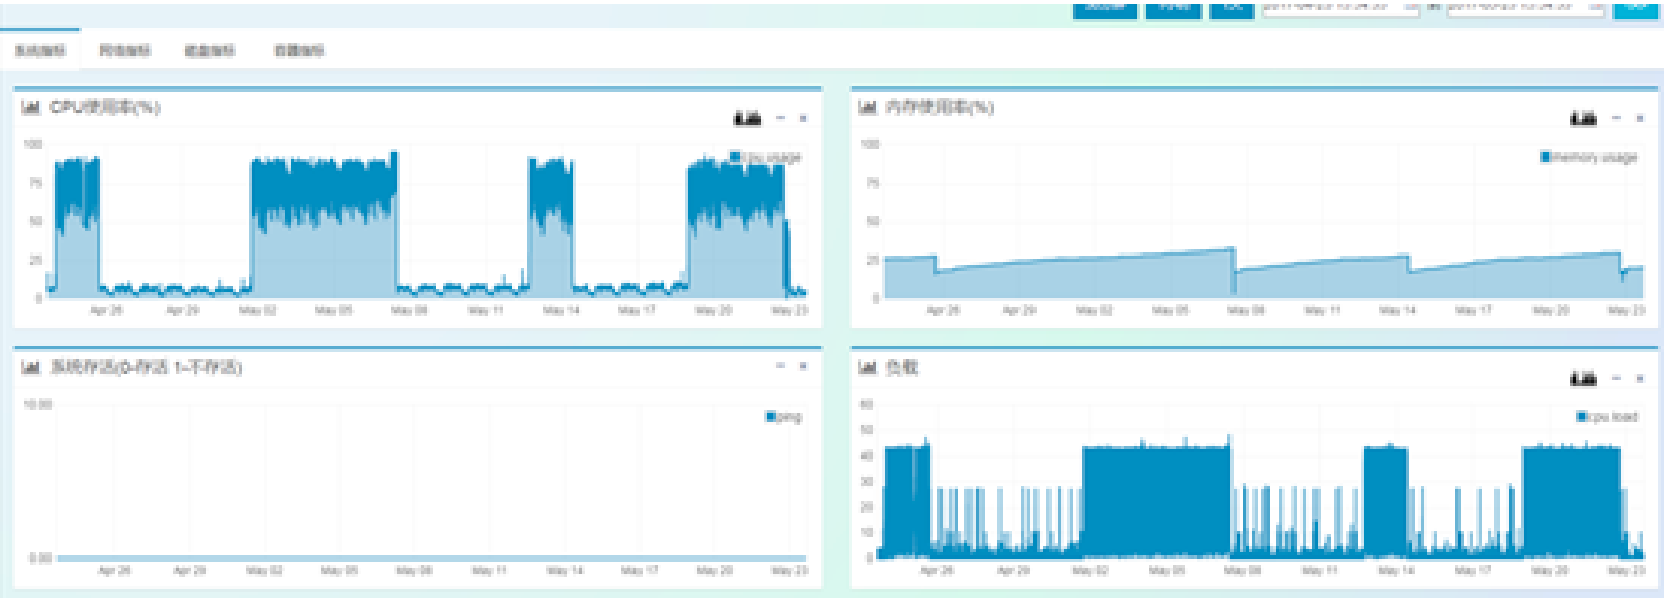
a) Observe the jvm monitoring in the alarm and find that it occurs periodically, that is, at 8:00 every day, the cpu lasts from 5% - 99% for about 3 minutes, and then returns to normal. At ordinary times, the cpu utilization is relatively stable (excluding the increase of cpu caused by application release)
b) The periodic occurrence of the task system is likely to be caused by a large number of operations performed regularly. Check the task system page, and there is indeed a scheduled task executed at 8 o'clock
c) Analyze the code and sort out the business logic of the task as follows: a thorough and timed job task; It involves a large number of complex operations. Now it is speculated that it is basically caused by changing the task, so you can reproduce it and confirm it.
The reproduction operation is simple:
c1) find a machine and observe jvm related monitoring; Observation log
c2) modify the number of slices to 1 and specify the slice container ip as the monitored container ip, click execute slice, check the slice, and click execute once after confirmation. It is successfully reproduced by observing step c1).
d) So far, the basic direction is to determine the CPU rise caused by this task. Next, analyze why the CPU rise and how to optimize the problem.
problem analysis
- a) It may also be that a large number of objects are created during program operation to trigger GC, and GC threads occupy too much CPU; b) The increase of CPU may be caused by a large number of program operations;
- Either case a) or case b) needs to reproduce the problem. Observe the threads with high CPU usage, export the information of thread stack with jstack command, and observe the CPU utilization of each thread
Operation steps
- The pre issuance environment triggers task execution and reproduces the scene. Note: this step needs to be handled with caution. Since the pre shipment and online databases are the same, the pre shipment environment deployment code needs to mask the relevant operations, such as sending MQ, updating the database, etc. Avoid affecting online data and MQ.
- Log in to the fortress machine and use the top command to view the current process information
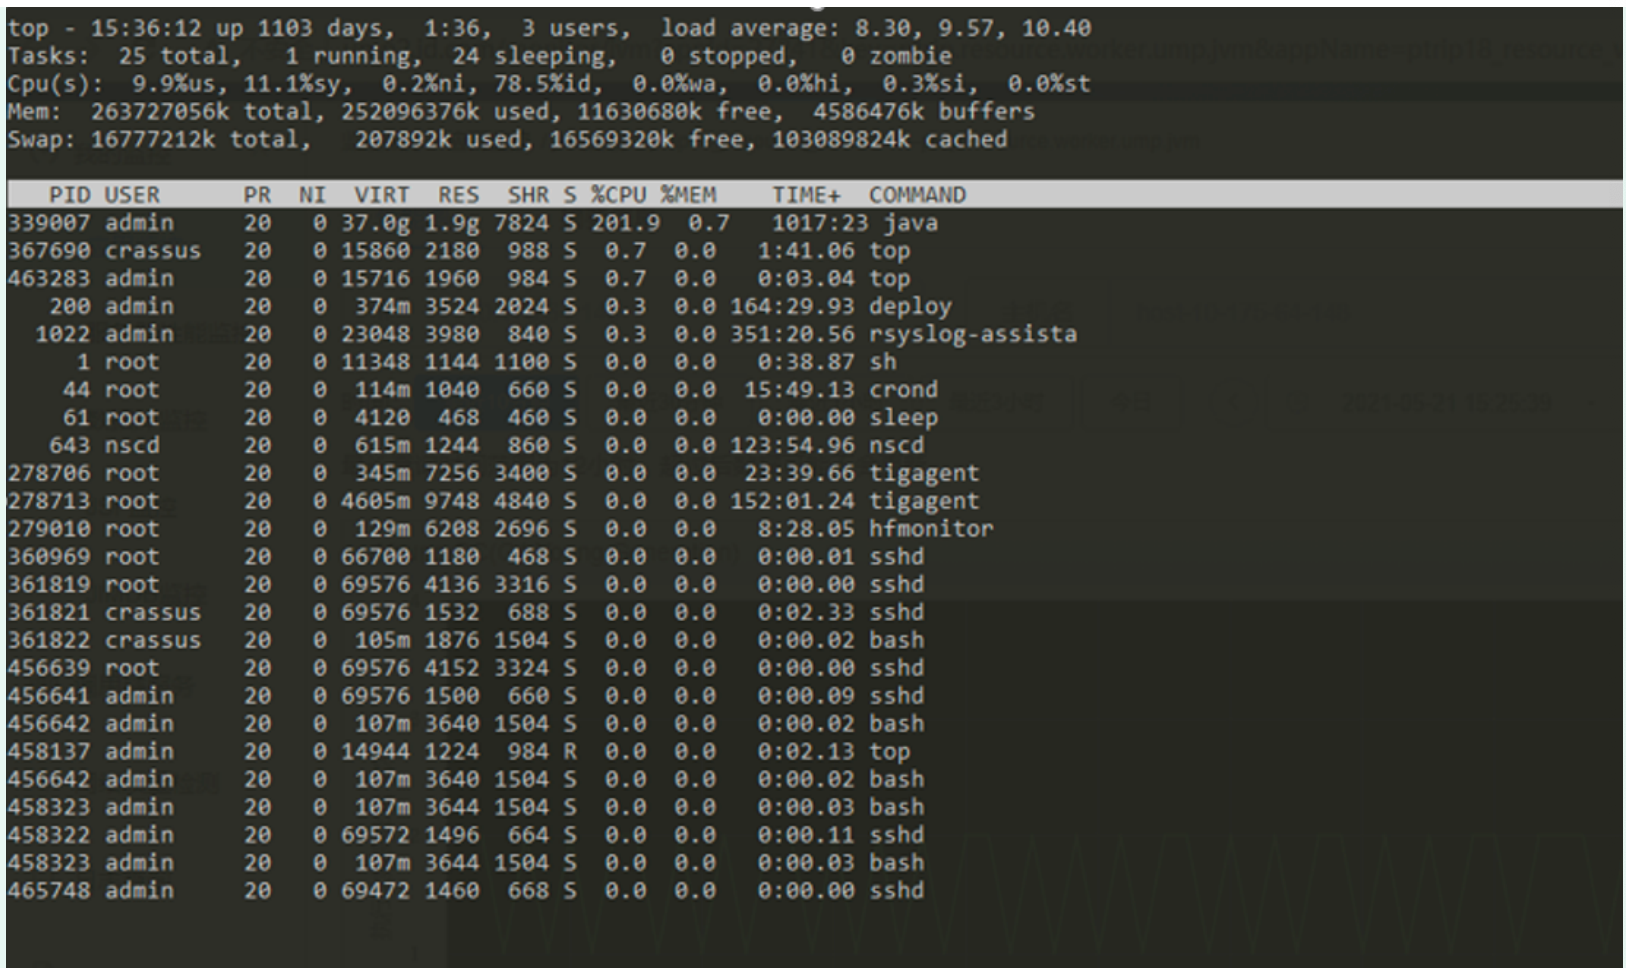
3. It is found that the cpu used by the java process 33907 has reached 200%. Use the command top-H -p 33907 to check which thread in the process uses the most resources
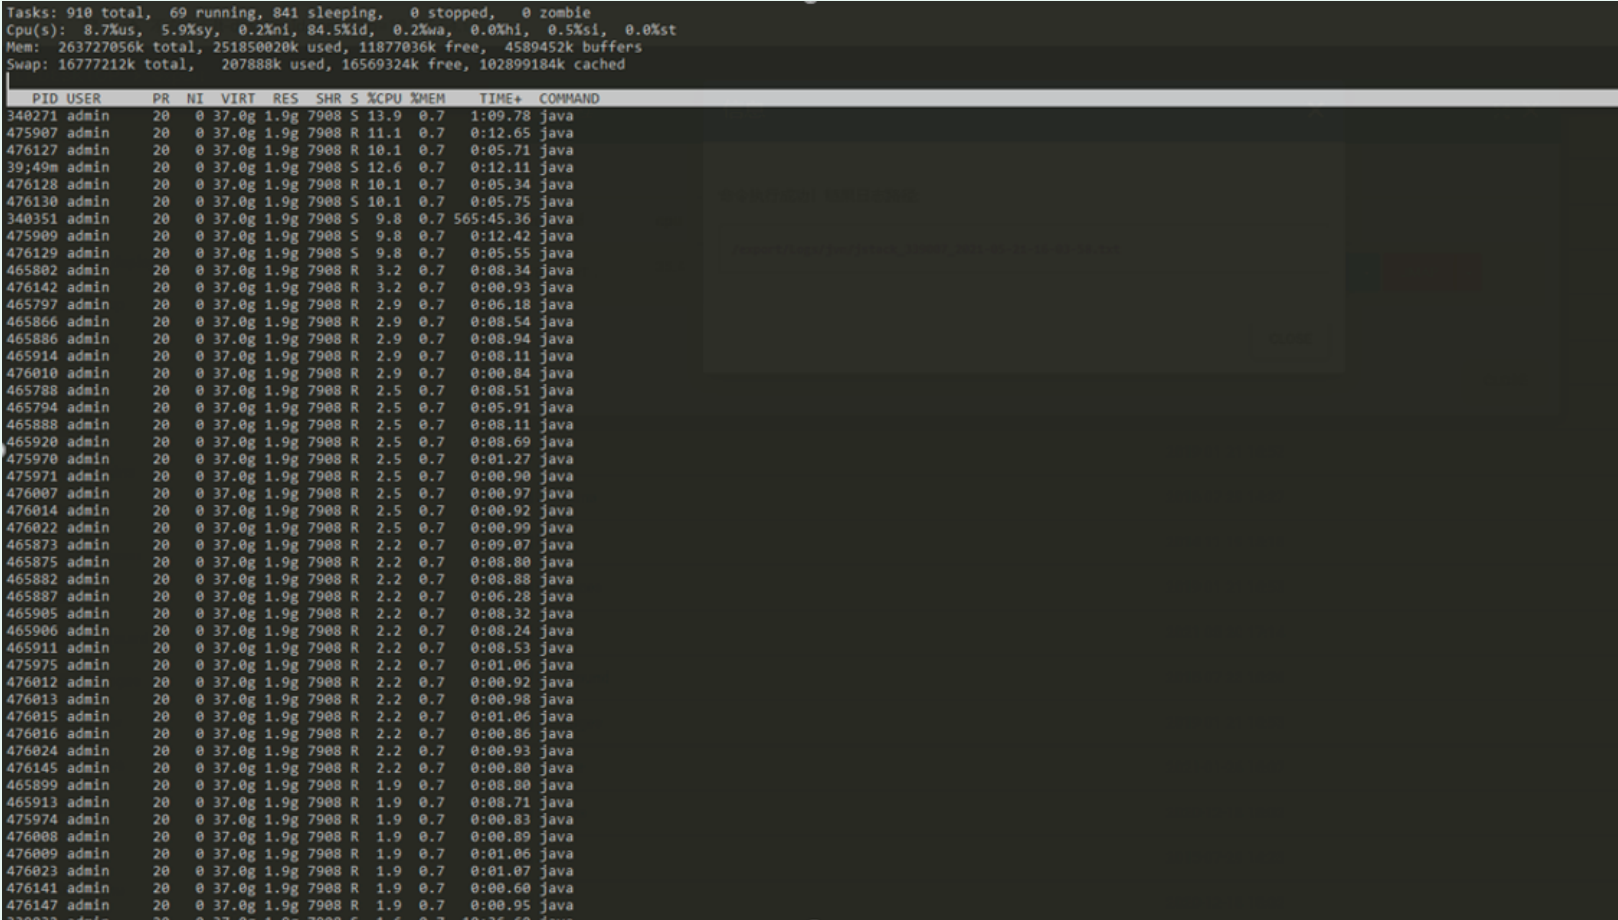
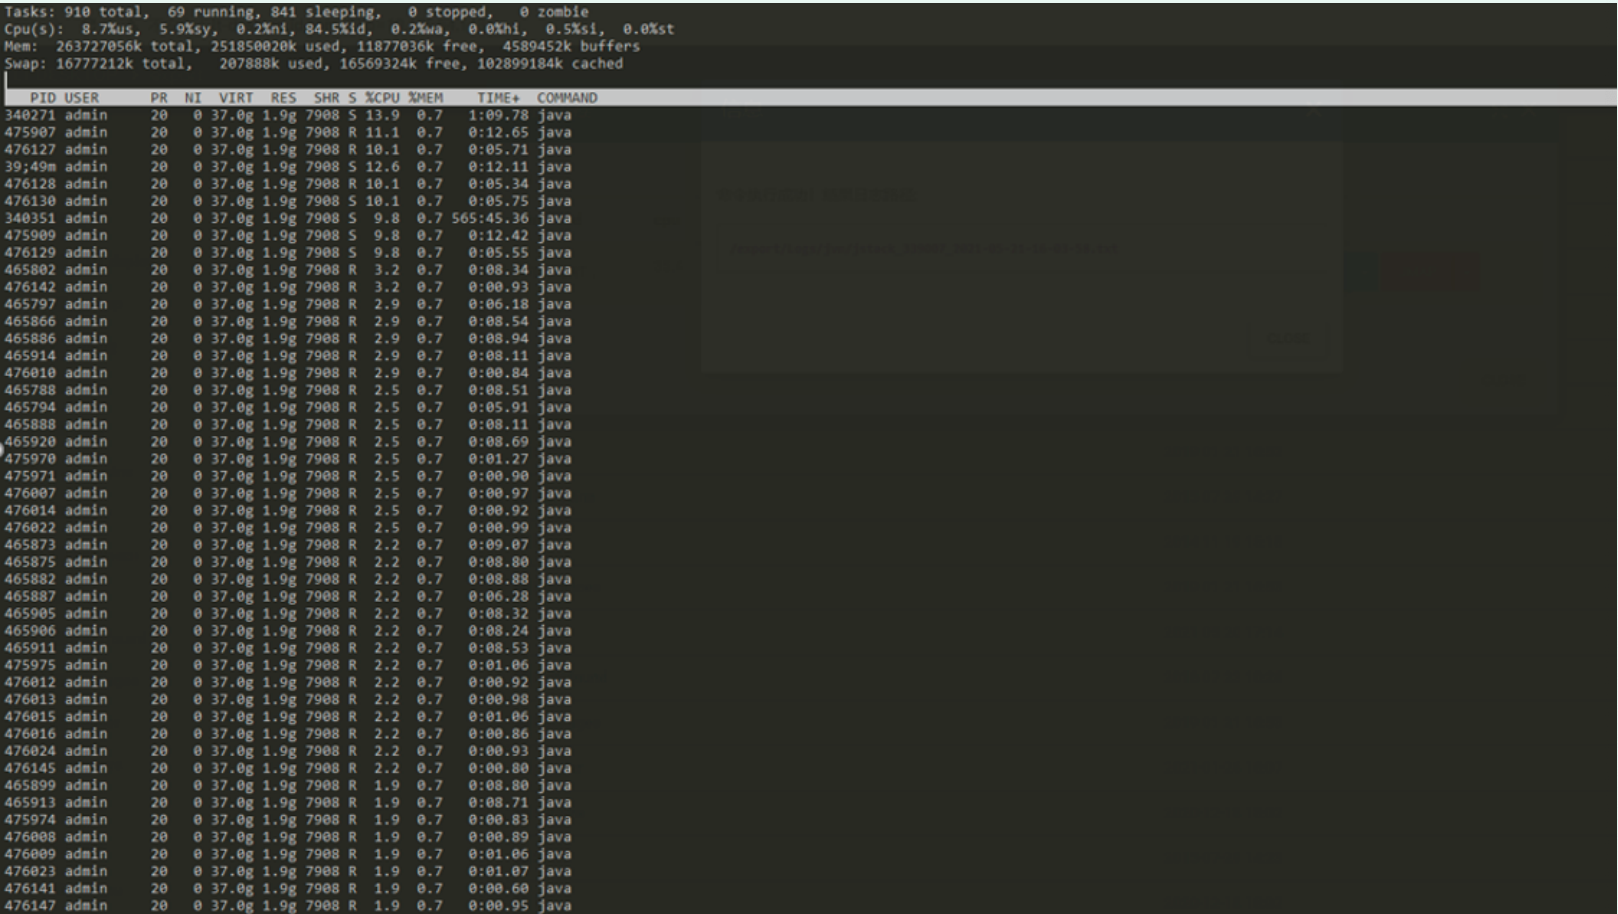
340271 5312f Curator-TreeCache-18" #648 daemon prio=5 os_prio=0
tid=0x00007f10dc156000 nid=0x5312f waiting on condition [0x00007f1158bcb000]
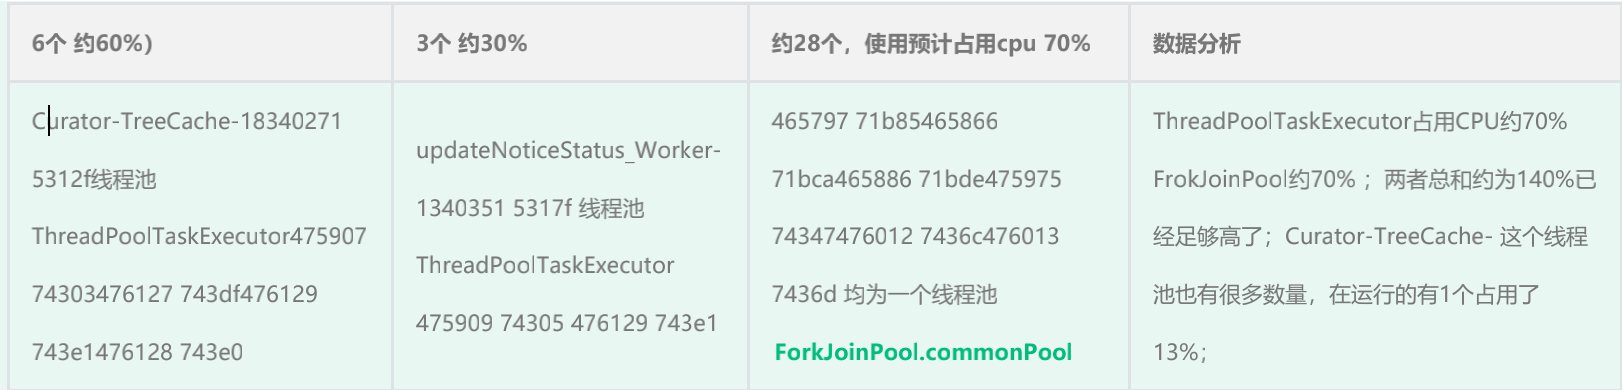
conclusion
- ThreadPoolTaskExecutor is created for the task display. The number of core threads is 2, the maximum is 6, and the queue size is 300. According to the thread stack information, it can be seen that it is consistent with the program configuration. According to the actual configuration, it can be found that the normal configuration of this part meets the expectation.
- FrokJoinPool is not created in the program, but the program uses a large number of parallelStream(); The parallel stream uses the public forkJoinPool thread pool by default, and the number of threads in the thread pool is configured as the runtime of the system getRuntime(). availableProcessors() - 1; Now the use of parallel stream is equivalent to nesting multiple threads in multiple threads.
- The source of the cursor treecache thread. By finding the initialization parameters of the thread pool, we can know that the rejection policy of the thread is CallerRunsPolicy (). This policy is: if the thread pool queue and the number of core threads are full, the tasks that continue to be submitted to the thread pool will be executed through the method thread, that is, the method that calls the thread pool, which can be understood as the main thread.
Optimization scheme
- Modify all parallelstreams() to stream(); The cpu utilization rate of the machine configured with 4c8G is stable at about 50%.
- The CPU utilization rate of 2C4G machine execution is still as high as 90%. By analyzing the dump file of thread stack, it is found that the main reason is that business threads occupy too much resources. Less than 2% of them are caused by parallel flow. In the third-party jar package referenced during job execution, this part will not be processed temporarily.
For the 2C4G optimization scheme: a) since this task is thorough, it does not need to be completed immediately, and the execution frequency is once a day, the thread pool can be adjusted to one thread;
b) Apply for container upgrade to 4c*8G
2C4G configured execution job single thread running task
Problem extension
Principle of parallelStream():
- Parallel Stream is a feature of jdk8 and a parallel Stream operation based on Stream; The purpose is to simplify parallel coding and improve operation efficiency;
- The bottom layer of parallel flow is implemented based on ForkJoinPool. ForkJoinPool adopts the idea similar to MapReduce, which divides a large operation task into subtasks (fork process); Then, the results of all subtasks are combined (join process); Complete a calculation by divide and conquer
parallelStream() best practices
Analysis of parallel stream usage problems:
- According to the principle of parallel steam, we know that the underlying layer is ForkJoinPool; Then our program usually has the following code:
//code1
WORDS.entrySet().parallelStream().sorted((a,b)-
>b.getValue().compareTo(a.getValue())).collect(Collectors.toList());
//code2
Set<String> words = new ConcurrentHashSet<>();
words1.parallelStream().forEach(word -> words.add(word.getText()));
- So we didn't create ForkJoinPool, and different collections are calling parallelstream (), so which thread pool is used in the end? Obviously, since there is no error, it means that jdk should give a default ForkJoinPool. The source code is as follows:
Note: by default, if the default thread pool is used for execution, the forkJoinPool will use the current system's default number of cpu cores - 1, but the main thread will also participate in the calculation.
Execution result: it can be seen that the default ForkJoinPool thread pool, in addition to worker threads participating in the operation, method threads will also participate in the budget.
Best practice summary: - If parallel flow is used, it is better to use a custom thread pool to avoid using the default thread pool, that is, the idea of thread pool isolation, which causes problems such as blocking or resource competition.
- The applicable scenario of parallel stream is CPU intensive. If the CPU load of the computer itself is large, parallel stream is used everywhere, which can not work. Remember not to use IO stream in parallel sreram operation;
- Don't use parallel stream in multithreading. For example, in this case, everyone grabbing the CPU will not improve the effect, but will increase the overhead of thread switching;
Pit stepping record:
Runtime.getRuntime().availableProcessors() ; It is provided by jdk to obtain the available cores of the current system. This time, the trick is that most applications are published in containers. Although the container for application deployment is 2C4G, ForkJoinPool is created by ForkJoinPool There are dozens of commonpool worker threads. Log in to the physical machine where the container is located. Check the machine configuration as follows:
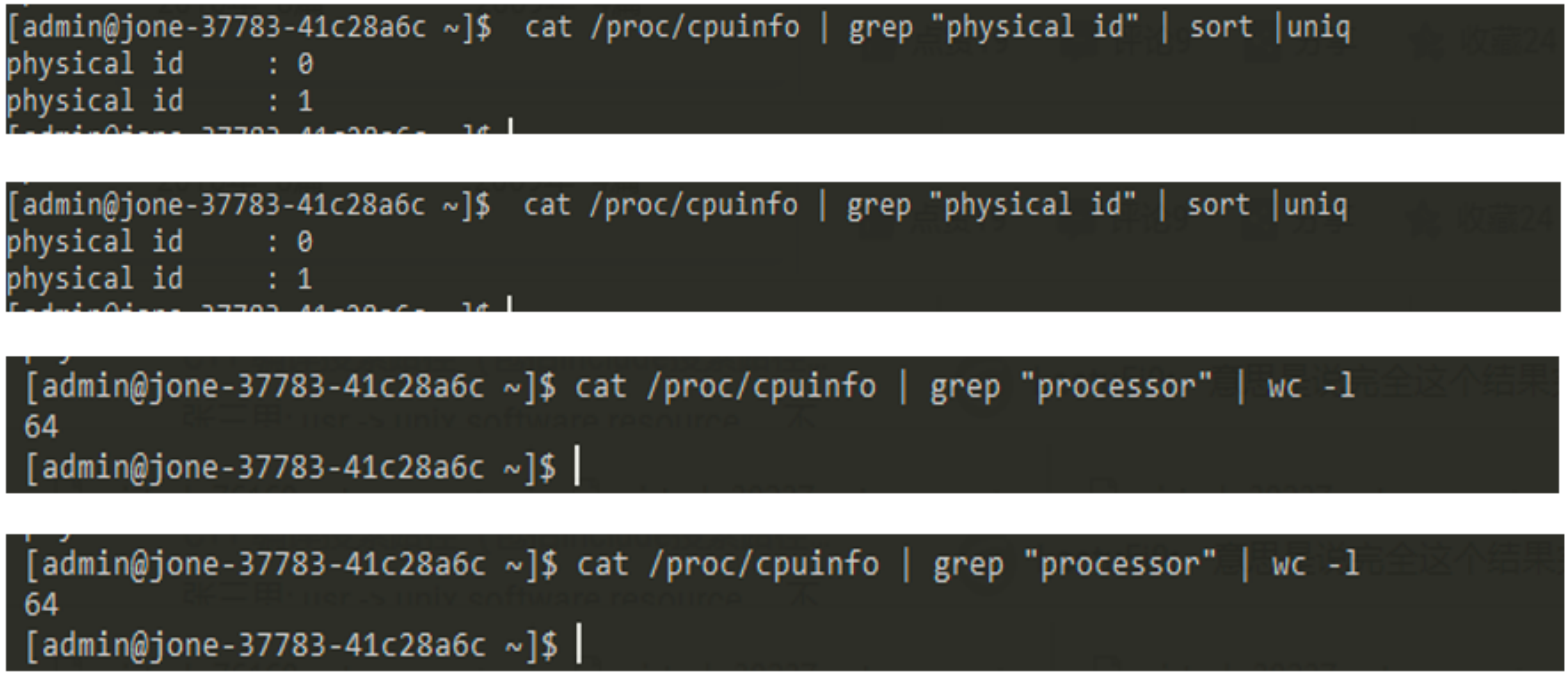
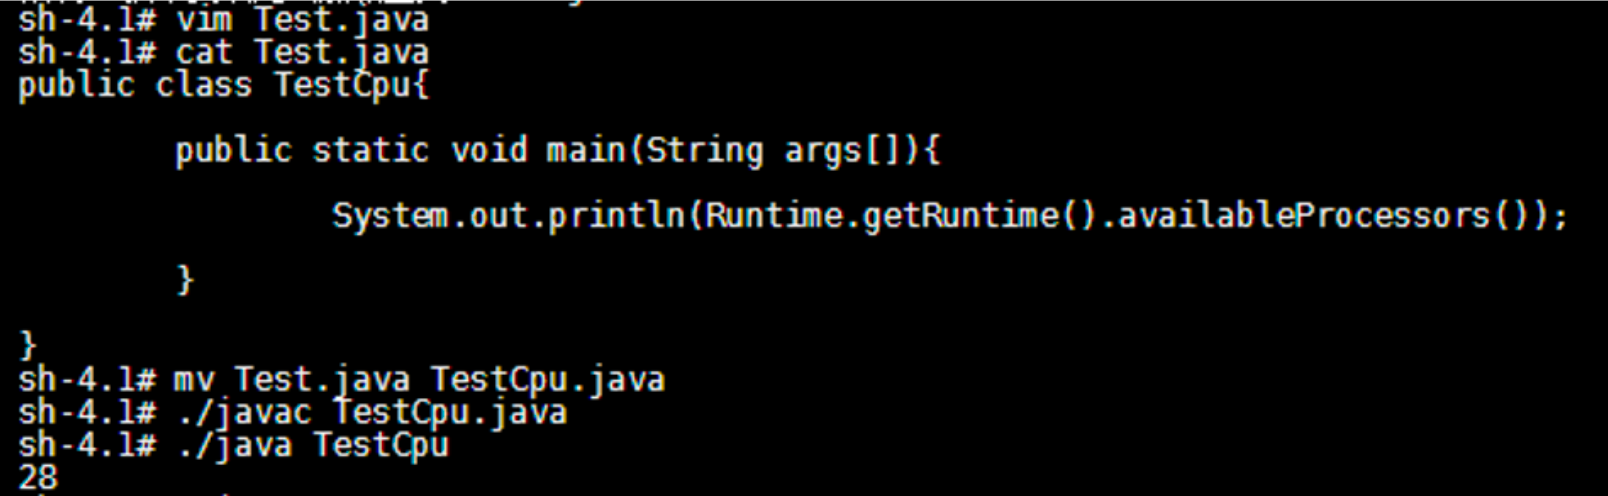
In fact, there are 2 CPUs, 32 cores per cpu, and a total of 64 cores. The same is true for writing test program verification:
It can be seen that the default ForkJoinPool obtains the number of cores of the current system. If the application is deployed in the docker container, it obtains the number of CPU cores of the host machine
Runtime.getRuntime().availableProcessors() problem:
The container clearly allocates two logical cores. Why does java get the core number of the physical machine? How to solve this problem.
Is it caused by some parameter configuration during container construction? The problem was fed back to the operation and maintenance department, but the other party did not solve the problem.
So can java solve it? After all, if we customize the thread pool setting, the number of threads will also be used
Runtime. getRuntime(). The availableprocessors () method,
This is actually a problem with JDK. It has been trace in JDK-8140793. The reason is that the number of CPU cores is obtained by reading two environment variables, among which
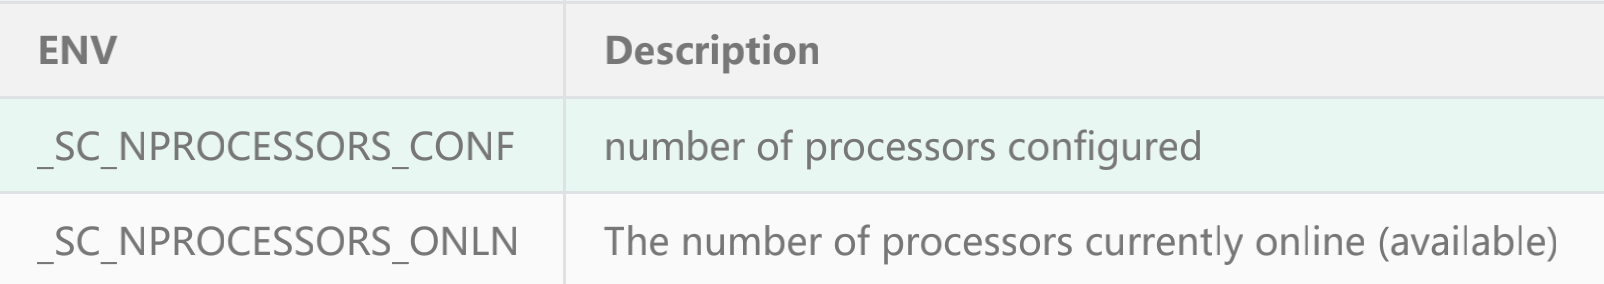
Among them_ SC_NPROCESSORS_CONF is the actual number of CPU s we need in the container.
Get the source code of the number of CPU s
The first method is to use the new version of version 1 above Jdku131.
Another way is to use the self compiled source code above through LD_ Load the modified so file in the way of prload
Mock the number of cores of the CPU
jdk official link statement: Java SE support for Docker CPU and memory limits
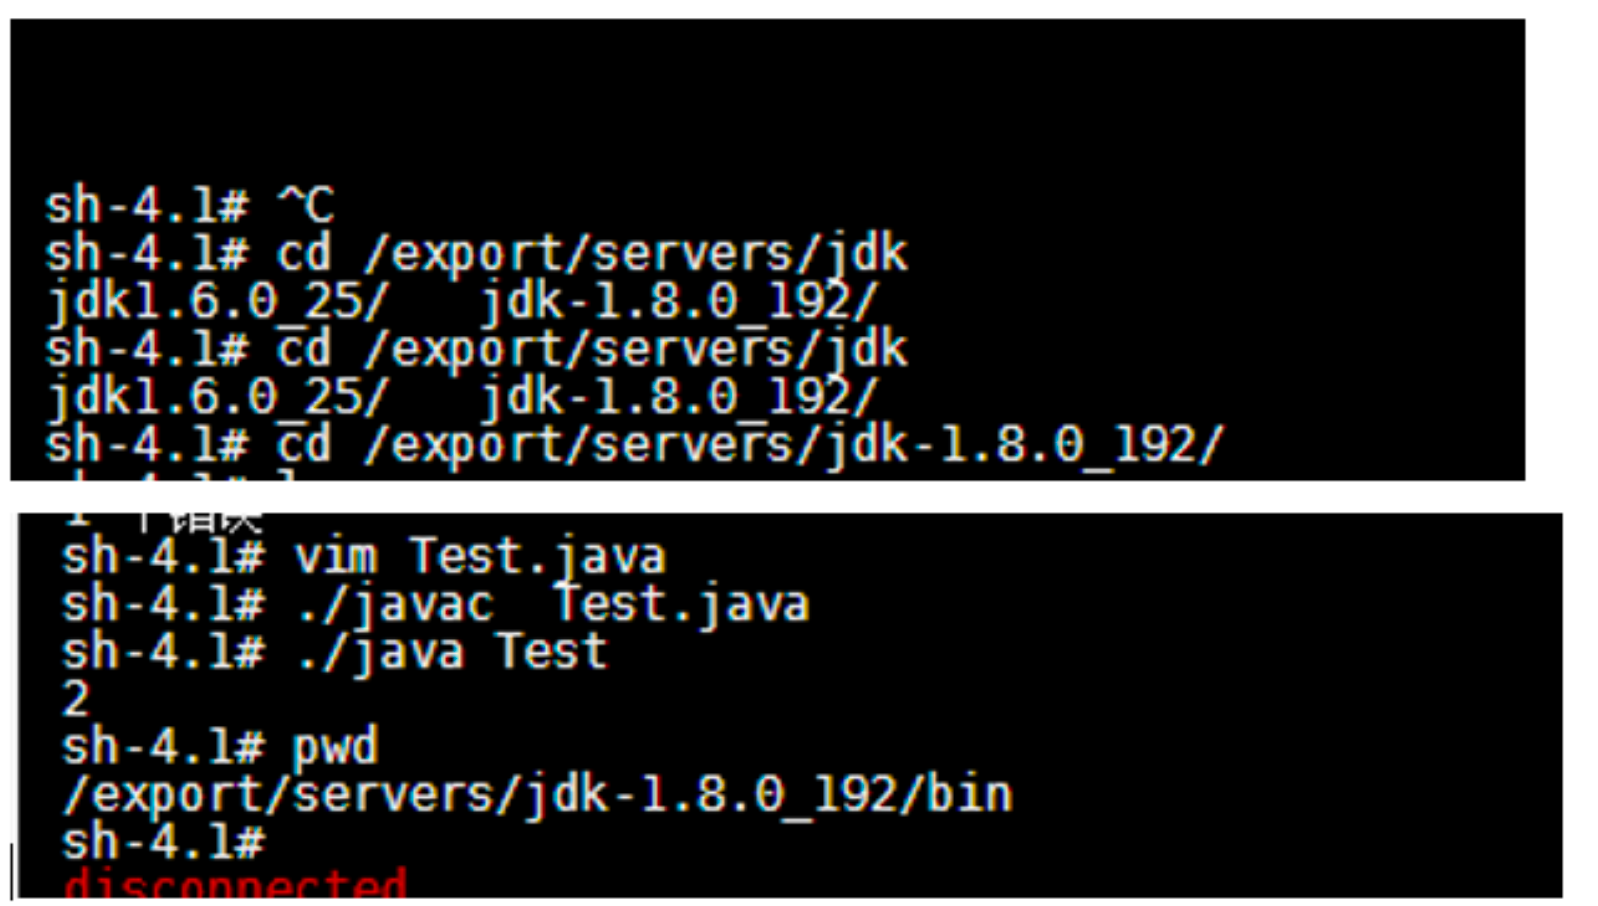
Test using method 1: the test environment container is verified, and the verification is passed. The results are as follows:
JDK version jdk1.0 8.0_ 20: Return the number of cpu cores 28
JDK version: jdk-1.8.0_192 return the number of cpu cores 2
proposal
Try to use lambda expressions to traverse data. It is recommended to use conventional for and for each modes
reason:
- Lower performance than traditional foreach
lambda has a set of complex processing mechanisms (reflection, type conversion and copy), and the performance overhead is much larger than that of conventional for and for each. In normal business scenarios, this performance difference can be ignored, but in some high-frequency scenarios (N 10000 calls / s), it can not be ignored. It will increase the cpu consumption of GC, but it will not increase in one iteration. - Inconvenient for code debugging
Counterexample:
// lambda does not simplify the code, but will increase the system pressure
List<ValidationResult> results = children.stream()
.map(e -> e.validate(context, nextCell, nextCoverCells, occupyAreas))
.collect(Collectors.toList());
List<ValidationResult> failureList =
results.stream().filter(ValidationResult::isFailure).collect(Collectors.toList());
List<ValidationResult> successList =
results.stream().filter(ValidationResult::isSuccess).collect(Collectors.toList());
Positive example:
// After optimization, the total cpu decreases by about 2% - 4%.
// Note: the reason why the cpu drops so obviously is that the calling frequency of this code is very high, which is really N 10000 times / second
List<ValidationResult> failureList = new ArrayList<>(4);
List<ValidationResult> successList = new ArrayList<>(4);
for (PathPreAllocationValidator child : children) {
ValidationResult result = child.validate(context, currCell, previousCell, nextCell);
    if (result.isSuccess()) {
        successList.add(result);
    } else {
        failureList.add(result);
    }
}
High CPU caused by non-standard import
background
Non standard import uses easyexcel component for import processing, and the amount of more than 100000 data leads to high CPU
Troubleshooting ideas
1. View thread stack related information
2. Check the performance and code call through the pinpoint monitor
3. Is there a large number of blocking slow SQL
4. Whether there is frequent log output in a short time
Problem reproduction
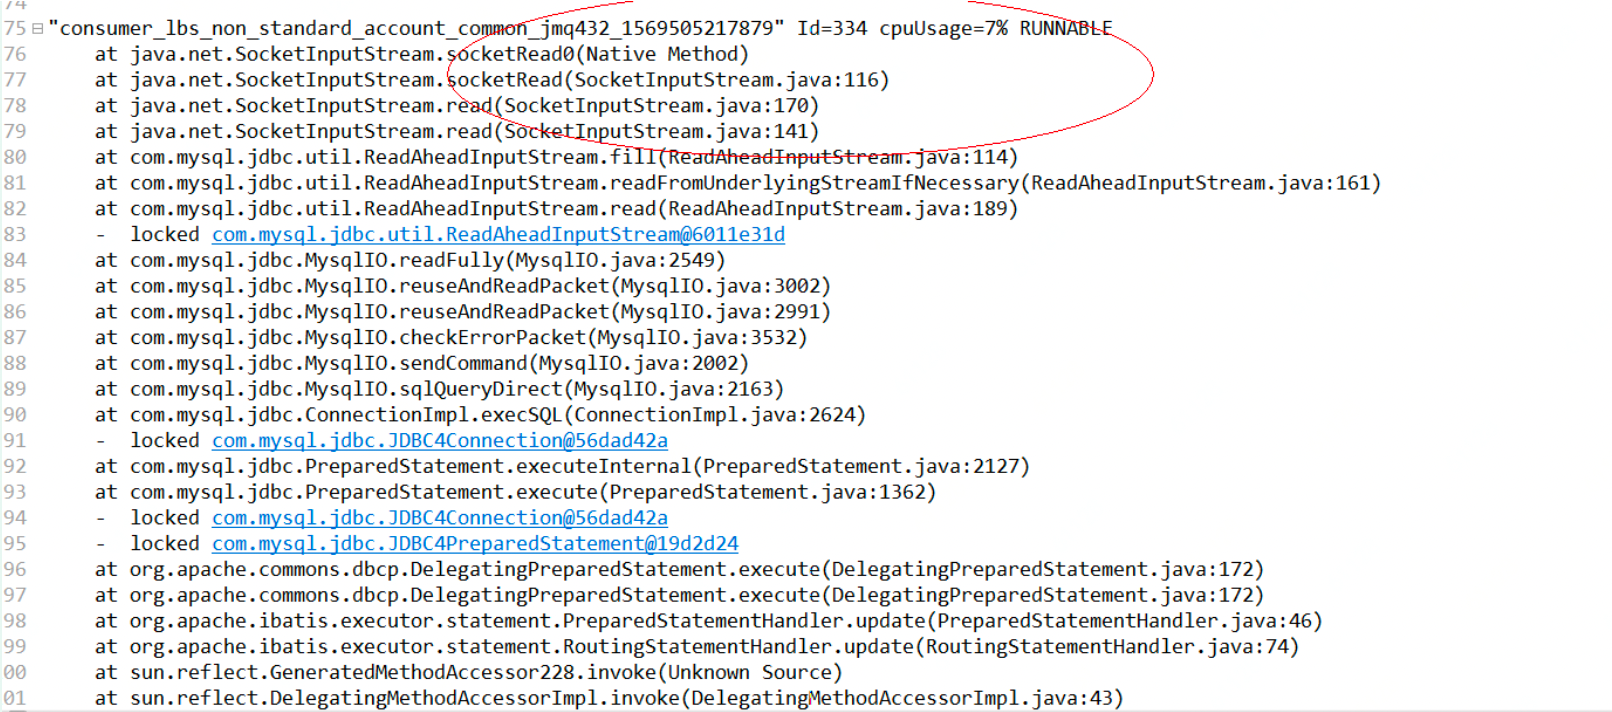
Use the 300000 data imported from the previous sub table to import. myops checks the information about the top ten thread stacks (as shown in the figure below) and finds lbs_non_standard_account_common single thread consumption occupies about 8% of CPU, and there are a lot of threads started
Improvement measures
1. The invoke method of CommonImportExcelListener, a subclass of AnalysisEventListener, has quickly completed the business logic verification at a rate of nearly 10000 per second and sent to MQ, which is consumed internally for business processing logic processing.
300000 data was sent to MQ in nearly 30 seconds, which put pressure on the internal logic of consumption, resulting in high CPU. RateLimiter was used to limit the current sent by MQ.
2. Adjust the maxConcurrent parameter of the consumer theme "lbs_top" (this parameter is set to the number of startup threads in a single group). The maximum number of startup threads of a single application instance = maxConcurrent parameter * number of groups
3. For lbs_ Some business queries in top consumption logic are transformed into memory cache
Database server CPU soared due to slow sql
Accident analysis of high cpu usage in database
1, Abstract
Time: 18:00:00 on February 5, 2018 -- 10:30:00 on February 6, 2018
Problem: the cpu occupancy rate of the middle database exceeds 89%
Reason: there are slow queries in the system DB sql, and the reads and writes are in the main database. With the increase of system traffic, the cpu occupation of the database continues to increase. The cpu occupation rate of the database reached 89% on February 5 and 91% on February 6;
2, Accident background
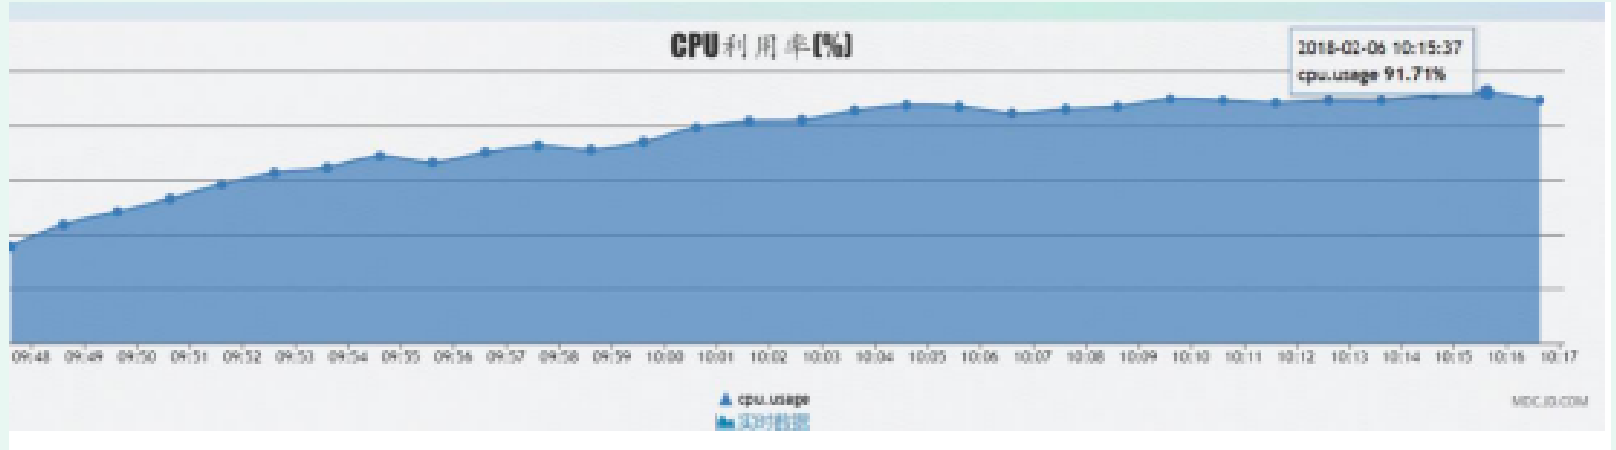
Recently, the volume of the system has increased by more than 30% every day. At about 18:00 p.m. on February 5, Tian xx monitored and observed the market through mdc, and the cpu occupancy rate of the database reached 89%. Moreover, the business party will launch six new products on February 6 the next day. It is estimated that the flow will be higher than the peak flow on February 5, and the system risk is very high.
3, Accident handling process
- Feasibility confirmation of the read-write separation scheme for and middle office applications [20:00:00-22:00:00 on the 5th]
Confirm with Mr. Jin xx whether the read-write separation of master-slave database can be realized in the application layer to release the pressure of master database. Since all of Jin xx's colleagues were off duty that night and all relevant personnel were not involved in the problem handling, Jin xx confirmed that it was impossible to separate the reading and writing of the database without changing the code that night. If the code needs to be changed, it cannot be released and upgraded that night, and there is still a risk of database collapse the next day;
This solution cannot solve the problem; - Discussion and implementation of database splitting scheme [22:00:00 on the 5th to 03:00:00 on the 6th]
After the read-write separation scheme pass ed, after many communication and discussion with Jin xx, it was decided to split the medium-sized database into a new database to alleviate the pressure of current data and prevent the overload of database cpu occupancy after the opening of the market the next day as a temporary solution.
After the scheme is determined, apply for dokcer resource database with DBA. Due to the shortage of docker database in the company's resource pool, the current situation can only apply for elastic database. After applying, contact DBA to modify the database to the same online specification (12C/49G/1T).
After the database resources are in place, contact dba by phone to determine the database cutting scheme: stop the application first to prevent data writing during database backup (this item is confirmed with the business party and can be operated). dba colleagues backup the middle database in full through dump, then get the new database source, import the data in full, and migrate the middle database nginx to the new database_ MySQL of bin_ config. Replace the database connection information in the PY configuration file with the new database configuration and start the application;
There was no problem after functional test verification, but due to time urgency, there was no stress test, which also led to the problem of system login the next day; - Add market BP and set the separation of reading and writing of market database [09:20:00, February 6 -]
Before the opening of the project on the morning of February 6, about 9:20, there was a problem of unable to log in; In order not to affect the normal operation of the business,
Restore the configuration of yesterday's central console urgently, and the system can log in again at about 9:45;
Operation process: transfer the middle console to nginx_app database configuration file MySQL_ config. Replace py with the original configuration file yesterday. Restart redis first, and then nginx;
Due to the slow market of Jinxx, the query problem has not been solved. After the opening of the business, the cpu occupancy of the database continues to soar. The situation is very urgent. The problem of online synchronization with Jinxx telephone, and asked it to urgently provide nginx current measurement and limiting scheme.
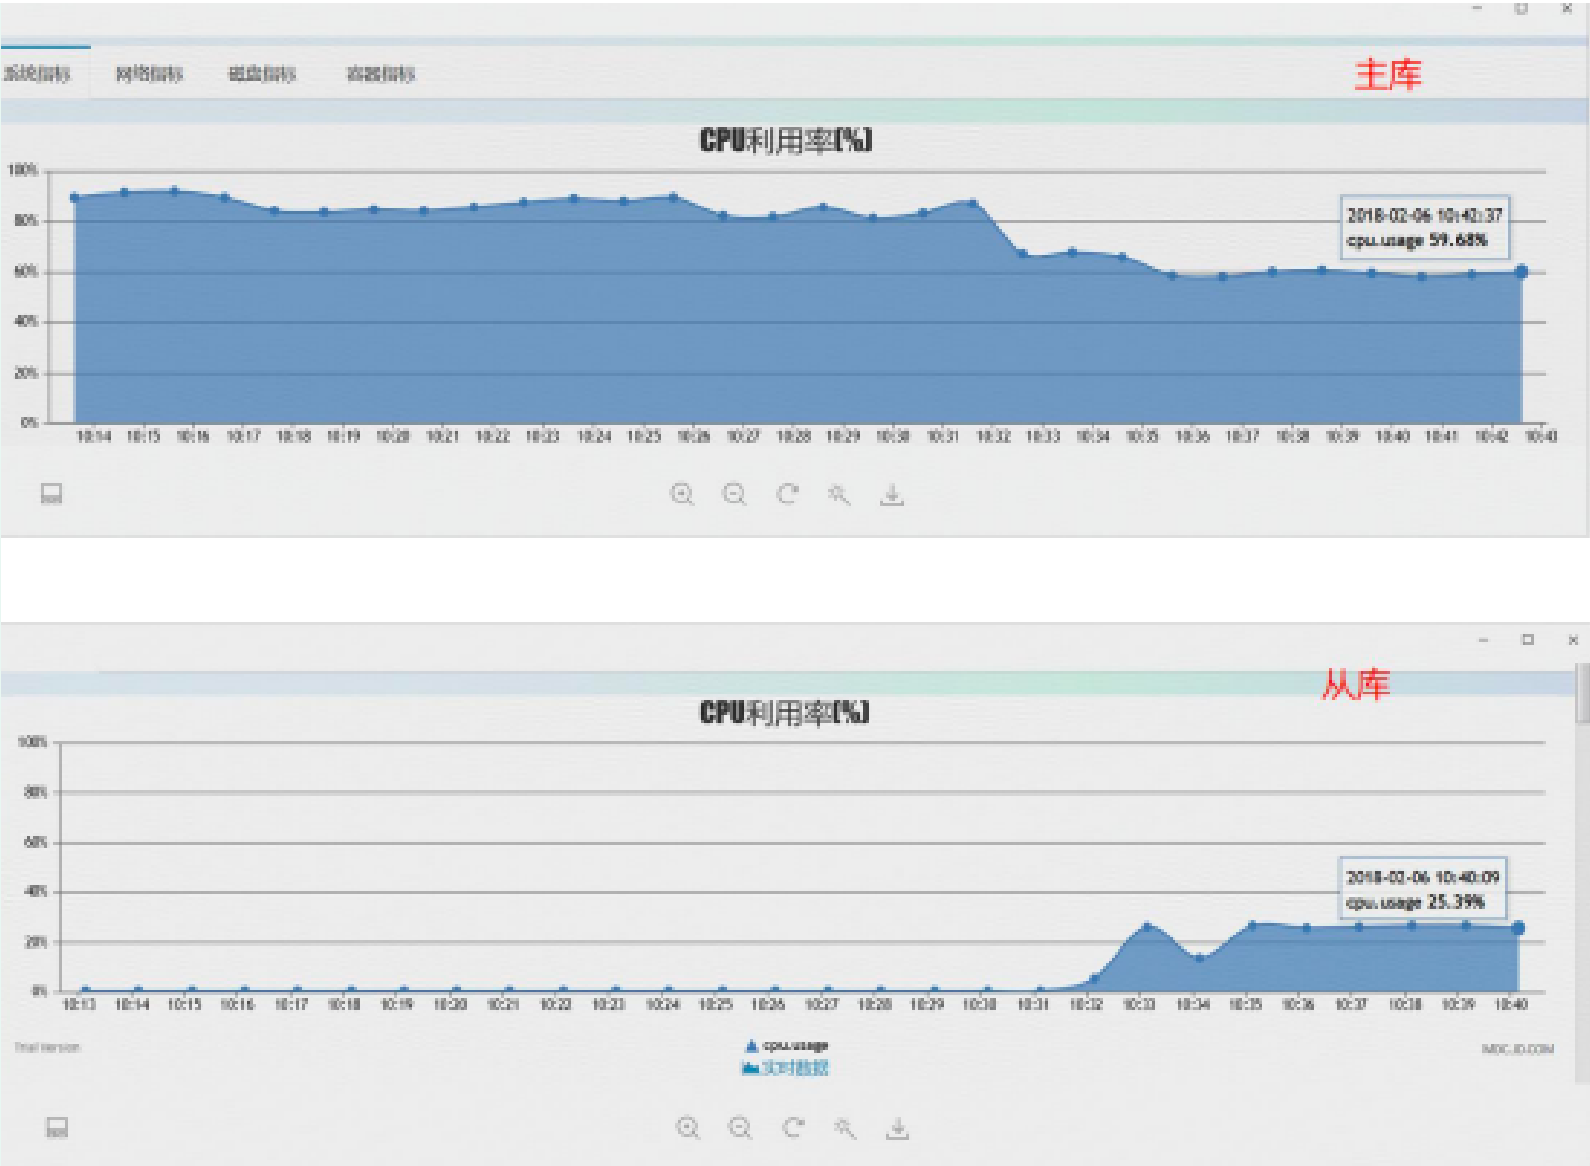
Jin xx colleagues assessed that the implementation of the current limiting scheme without testing may have an impact on the business. Finally, when the database occupancy rate is more than 90%, add two quotation BPs, and configure the read database address as slave database address 10.191.237.73, so as to alleviate the reading pressure of the main database. Add BP configuration method
After the market BP is added to realize the separation of reading and writing of the market database, the cpu utilization rate of the main database decreases to about 60%, and the cpu utilization rate starts to rise from about 20%, which tends to be stable
- With the increase of index, the cpu usage of database decreases rapidly
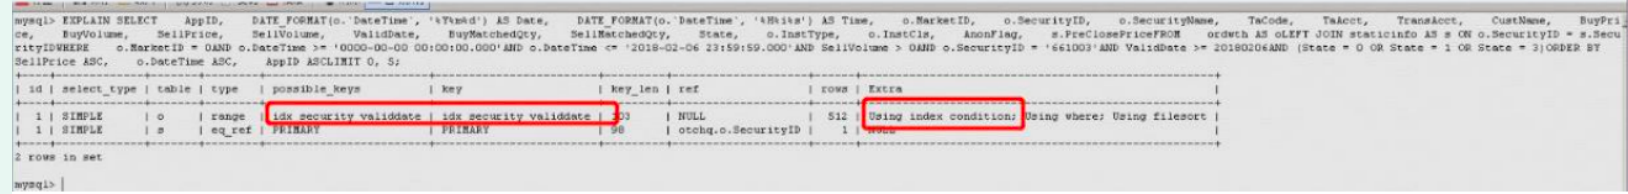
After the implementation of read-write separation, the cpu utilization rate drops to the normal threshold range. Xiao xx puts forward the scheme of creating an index in the ordwth table. After applying for creation, the cpu utilization rate drops rapidly to less than 10%. Create an index: alter table ordwth add index idx_ security_ Reason for performance increase after adding indexes to validate (security, validdate): the original ordth table has only two groups of composite indexes (AppID,DateTime) and (TransAcct,SecurityID).
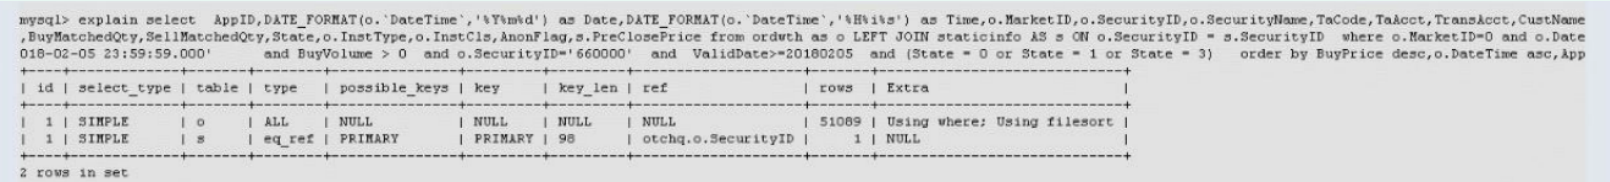
The original slow sql query and the two groups of indexes of where condition are not used.
After adding the group of composite indexes (SecurityID,ValidDate), the query starts to use the group of composite indexes.
4, Accident reflection summary - The communication with Jin xx's colleagues was not thorough, and the corresponding problem interface was not found, resulting in the failure to implement the database read-write separation scheme on the evening of the 5th;
- Insufficient understanding of the elastic database leads to that after the application connection is switched to the elastic database, the database performance cannot support the online system after the traffic increases;
- In the early stage, we didn't communicate with Jin xx about the current limiting emergency plan, which led to the failure to limit the flow at the first time after the flow increased