background
Recently, there was a requirement to read a json file of about 2 GB (which stores a collection of about 30 million json objects), parse each json object, perform some data conversion, and finally store the converted json object in es. The json file format is probably this:
[
    {
        lng: 116.22
        lat: 22.00,
        count: xxxx
    },
    {
        lng: 116.22
        lat: 22.00,
        count: xxxx
    },
    ...
]
Loading this json file into memory at once for json parsing is certainly not possible, so what I want to think about is using JSONReader streaming in fastjson to read the file step by step, take a quick look at the API and demo of JSONReader, start coding, and write the following simplified version of code very quickly, fastjson version 1.2.70
    private final static int BATCH_SIZE = 20000;
    public int importDataToEs(String jsonPath) {
        int count = 0;
        List<JSONObject> items = new ArrayList<>(BATCH_SIZE);
        try (Reader fileReader = new FileReader(jsonPath)) {
            JSONReader jsonReader = new JSONReader(fileReader);
            jsonReader.startArray();
            while (jsonReader.hasNext()) {
                JSONObject object = (JSONObject) jsonReader.readObject();
                JSONObject item = processObject(object);
                items.add(item);
                if (items.size() >= BATCH_SIZE) {
                    batchInsert(items);
                    count = count + items.size();
                    items.clear();
                }
            }
            if (items.size() > 0) {
                batchInsert(items);
                count = count + items.size();
            }
            jsonReader.endArray();
            jsonReader.close();
        } catch (FileNotFoundException e) {
            e.printStackTrace();
        } catch (IOException e) {
            e.printStackTrace();
        }
    }
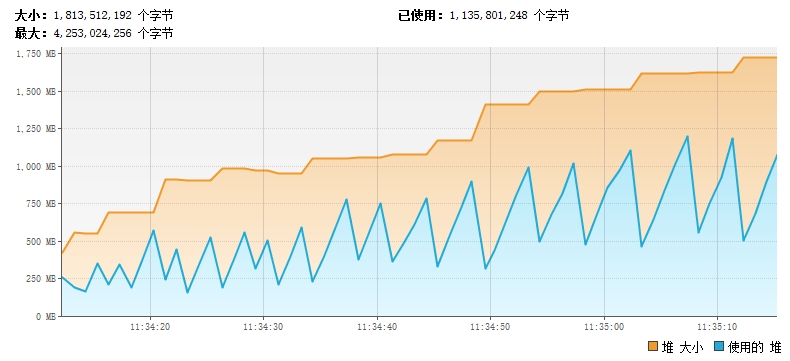
At first everything was okay with the program throwing Java after reading about 6 million data. Lang.OutOfMemoryError: Java heap space, through jvisualvm you can see that memory is increasing as the program runs, jstat command can also see that older and middle-aged memory in jvm is loading gradually, and eventually throw out OOM, which must be caused by some objects that cannot be recycled, so you begin to troubleshoot.

Problem troubleshooting process
1. jmap-dump:format=b, file=heapdump pid: Output details of memory usage to file
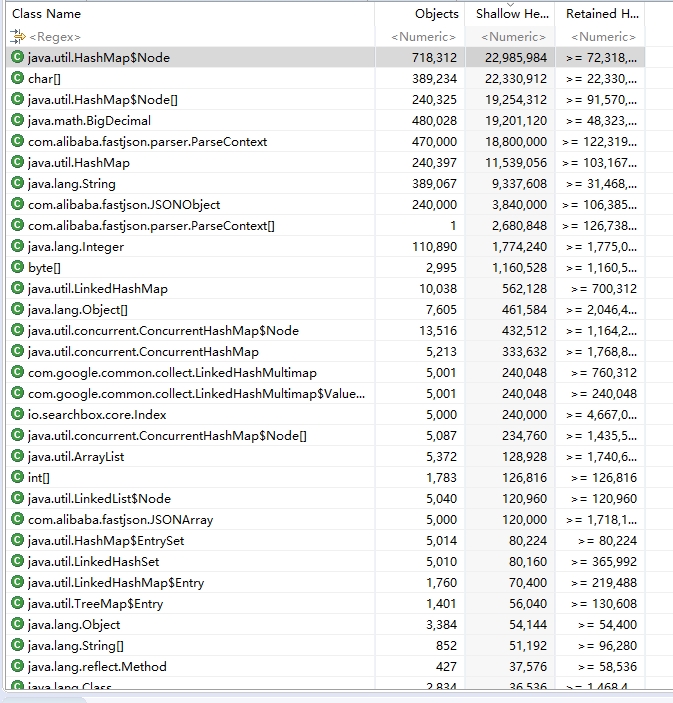
2. Use MAT tools to analyze dump files to see the most object instances in memory
From the dump file (dump was exported before OOM was reached), you can see that there are a large number of HashMap objects and a large number of JSONObject objects. Our program inserts data in batches, but empties the list after each batch of data is written. This part of the JSONObject object should be recycled by the GC and there should not be so many JSONObject instances. In addition, we know that the underlying implementation of JSONObject is HashMap, so instance objects of HashMap should also be related to JSONObject not being recycled. Next, let's analyze the GC Roots of these instances to see where JSONObject is referenced, causing JSONObject not to be recycled.

3. Analyzing GC ROOT for HashMap instances
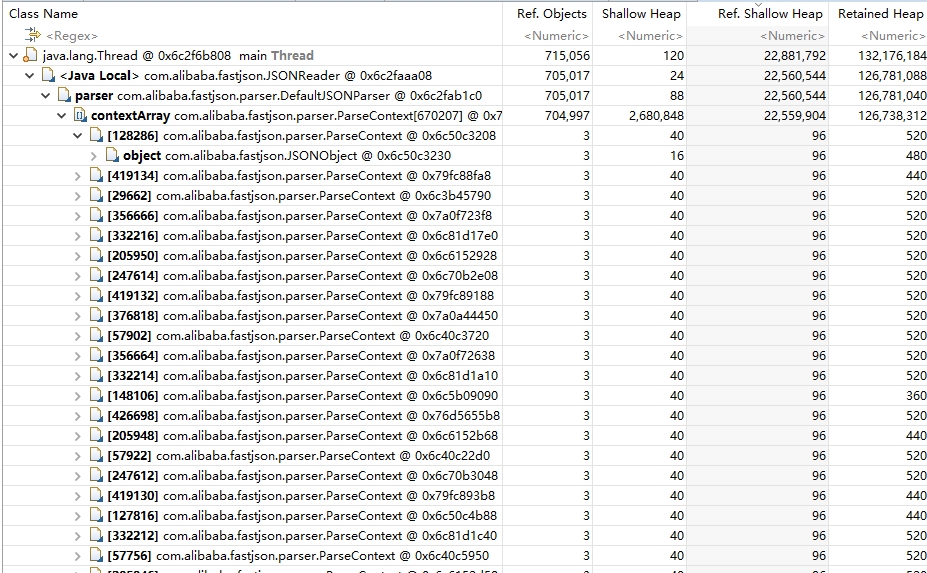
In the view shown in the figure above, by selecting the hashmap instance and right-clicking Path to GC Roots, we can see the GC ROOTS shown in the figure below.

As you can see from the diagram above, it is not the code we wrote that caused the JSONObject instance to not be recycled. The primary holder of JSONObject refers to the ParseContext array in DefaultJSONParser, and the problem is now found.
To find out if you are using it incorrectly or are a Bug of FastJson, you look at the code in this section of FastJson and find that in the current version of FastJson, readObject calls the parseObject method in DefaultJsonParser. Each parsing of a JSONObject creates a context object to be placed in the contextArray array, but does not delete the useless objects in the context array in time. Causes OOM.
Solution
Now that we've found the problem caused by FastJson, it's easy to think of several solutions:
-
Use other JSON parsing tools, such as Gson, but I have not measured if Gson has such a problem. Friends interested in it can try it out.
-
Upgrade FastJson to see if the problem is optimized or fixed
-
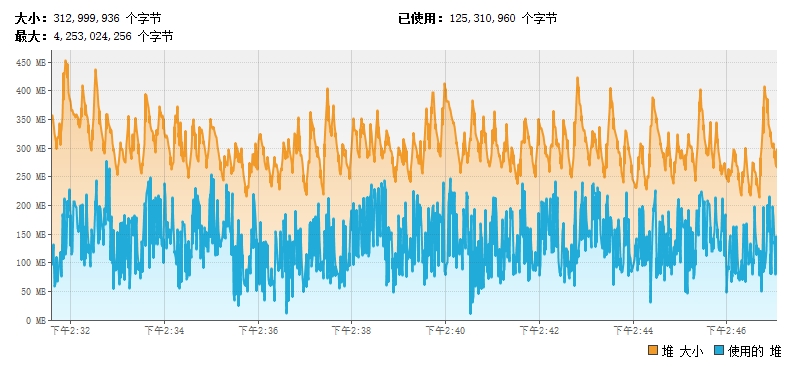
Use other methods instead of readObject, which is also the method used in this article. Change the code to use startObject to parse the key and value in each line separately. Memory and CPU usage have not increased steadily. Problem solving.
private final static int BATCH_SIZE = 20000;
    public int importDataToEs(String jsonPath) {
        int count = 0;
        List<JSONObject> items = new ArrayList<>(BATCH_SIZE);
        try (Reader fileReader = new FileReader(jsonPath)) {
            JSONReader jsonReader = new JSONReader(fileReader);
            jsonReader.startArray();
            while (jsonReader.hasNext()) {
                jsonReader.startObject();
                JSONObject object = new JSONObject();
                while (jsonReader.hasNext()) {
                    String key = jsonReader.readString();
                    if ("lng".equals(key)) {
                        object.put(key, jsonReader.readObject());
                    } else if ("lat".equals(key)) {
                        object.put(key, jsonReader.readObject());
                    } else if ("count".equals(key)) {
                        object.put(key, jsonReader.readObject());
                    }
                }
                jsonReader.endObject();
                JSONObject item = processObject(object);
                items.add(item);
                if (items.size() >= BATCH_SIZE) {
                    batchInsert(items);
                    count = count + items.size();
                    items.clear();
                }
            }
            if (items.size() > 0) {
                batchInsert(items);
                count = count + items.size();
            }
            jsonReader.endArray();
            jsonReader.close();
        } catch (FileNotFoundException e) {
            e.printStackTrace();
        } catch (IOException e) {
            e.printStackTrace();
        }
    }
After modifying the code, you can see that the memory fluctuates within a certain range during the running of the program and does not increase continuously
