Today, we push an extremely practical visualization tutorial to visualize bookmarks collected in our own browser.
The thing is, yesterday I was looking for a bookmark in my favorites
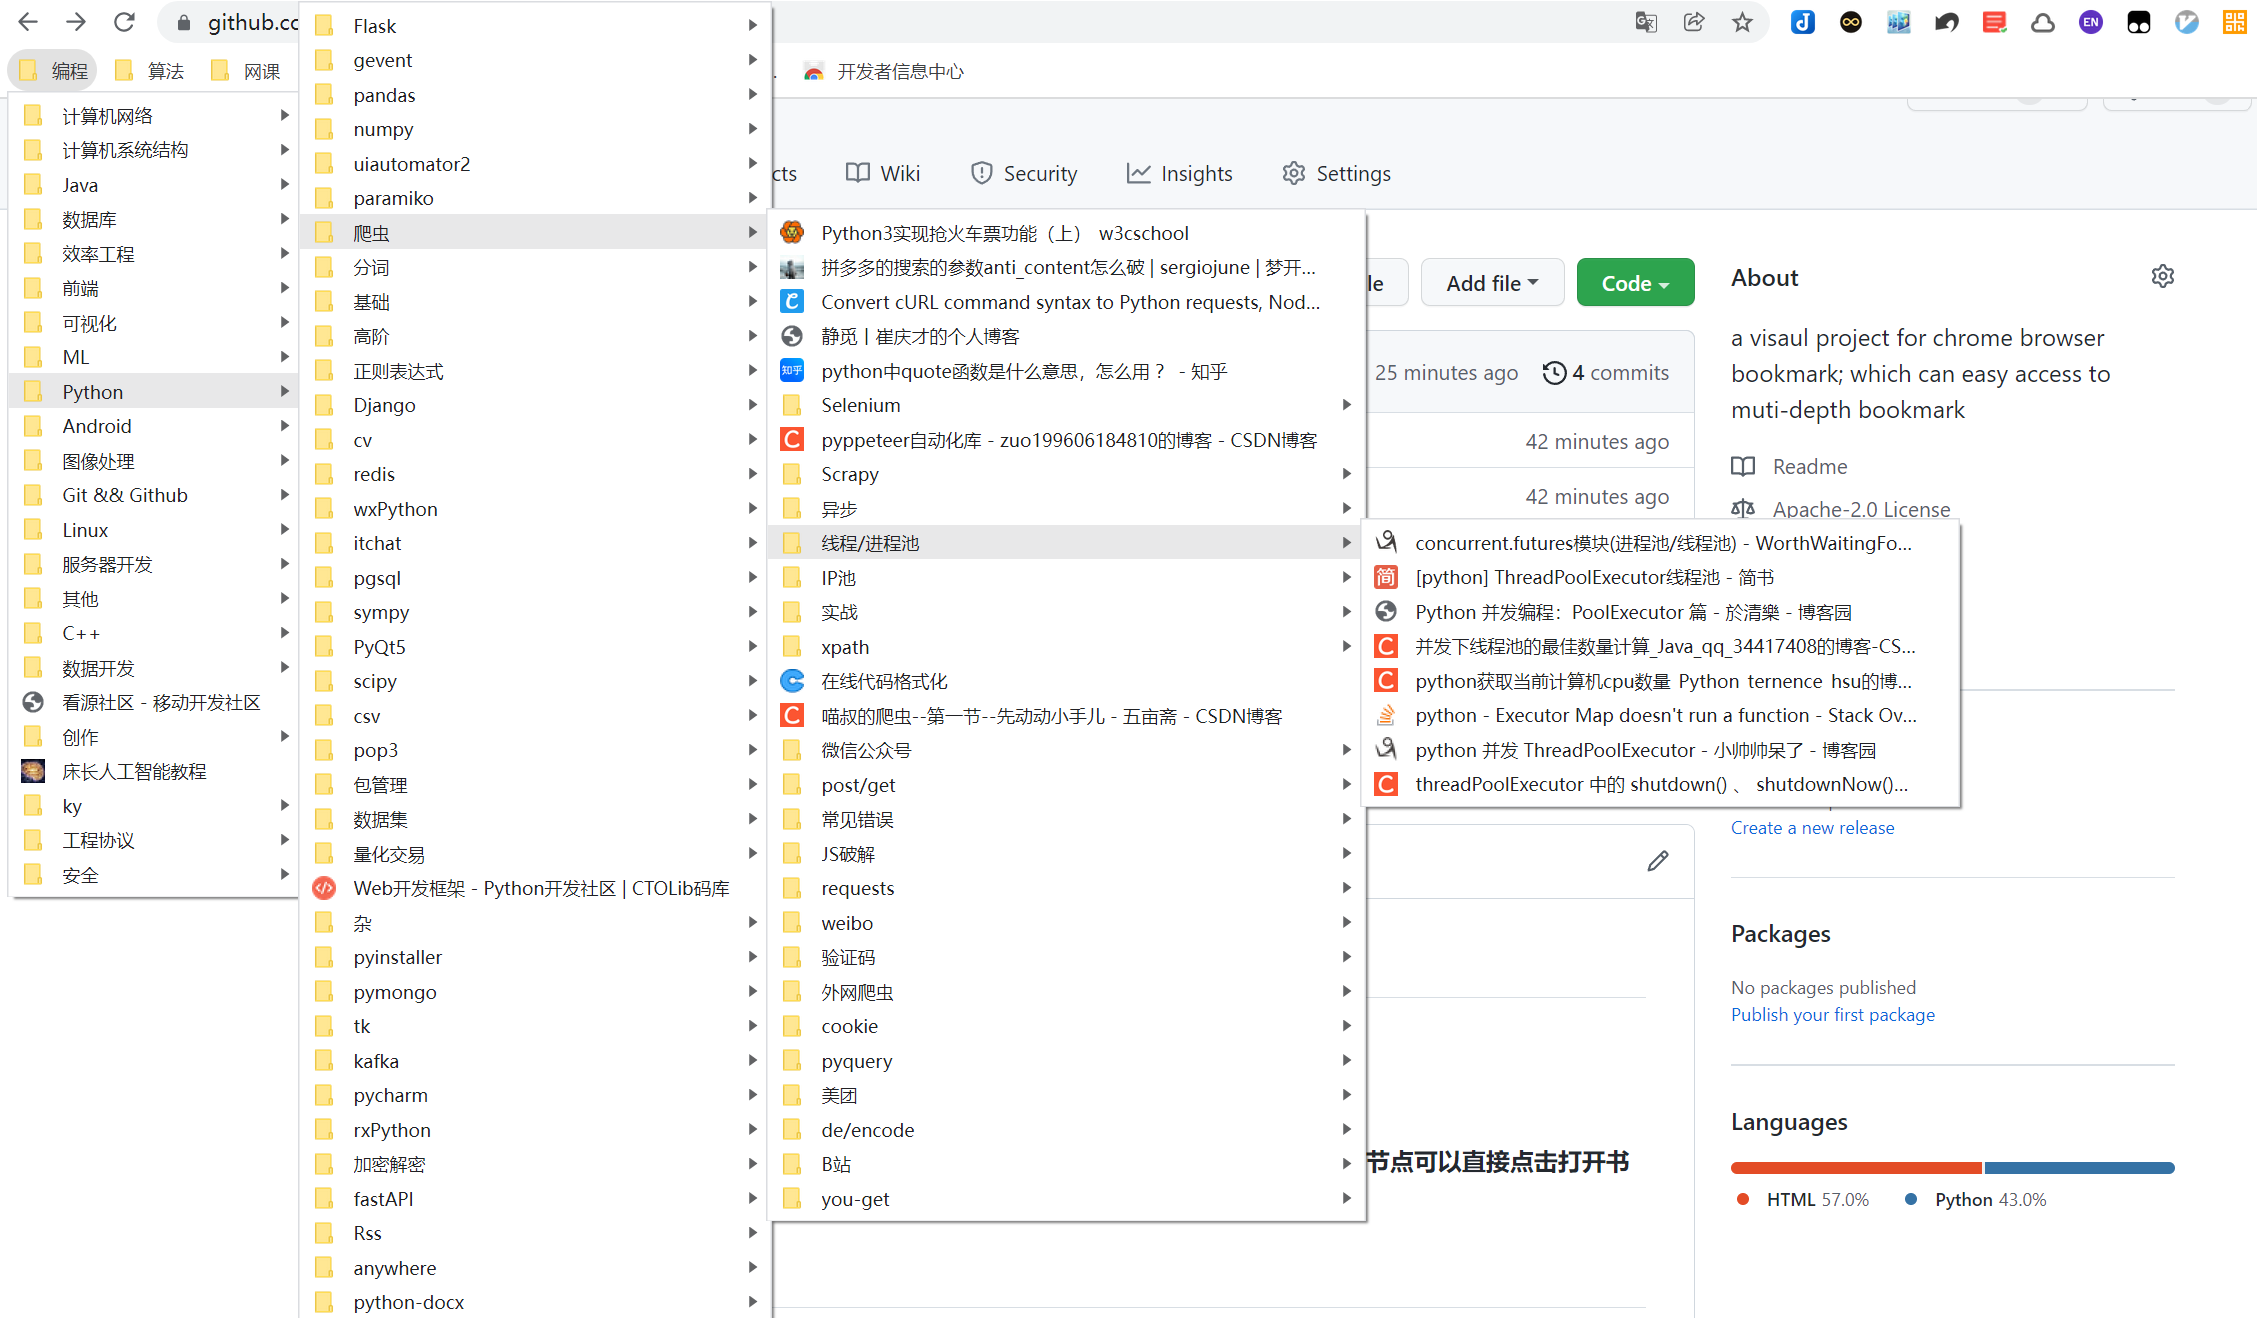
Because the level is too deep to reach directly, learning to write code is to solve these small problems. My inspiration is, can I visualize the bookmark level of the browser and click it directly? It took several hours to complete the following mini project.
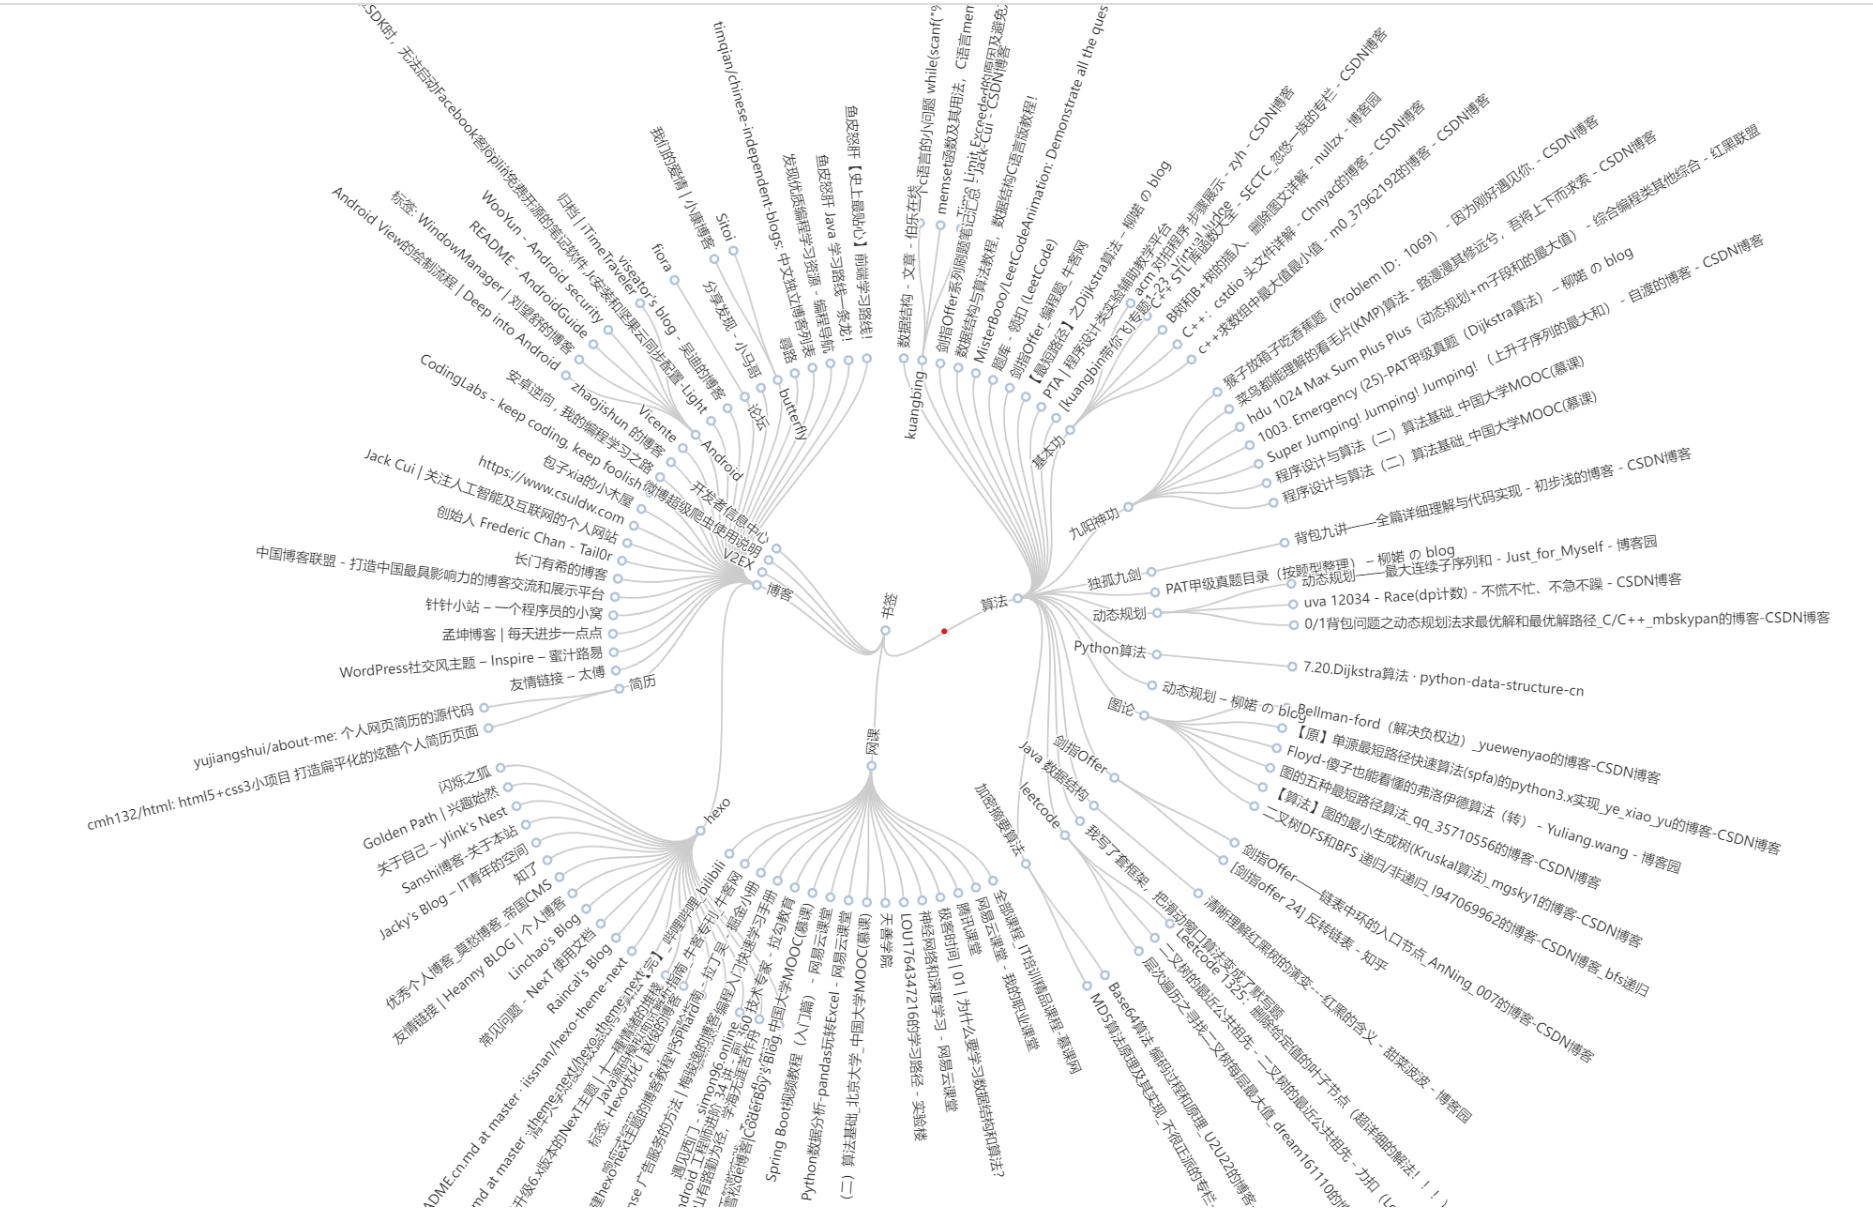
According to the hierarchical order of bookmarks in favorites, it is extended from the root node to the leaf node. Each leaf node is a bookmark. You can directly click the leaf node to reach the corresponding bookmark address.
The code is all open source. The address is as follows. Please find a hard star
https://github.com/inspurer/ChromeBookmarkVisual
It can be copied and opened in the browser, or you can directly click the original text at the end of the text to read the original text directly.
Core code
Export browser bookmarks in the following format
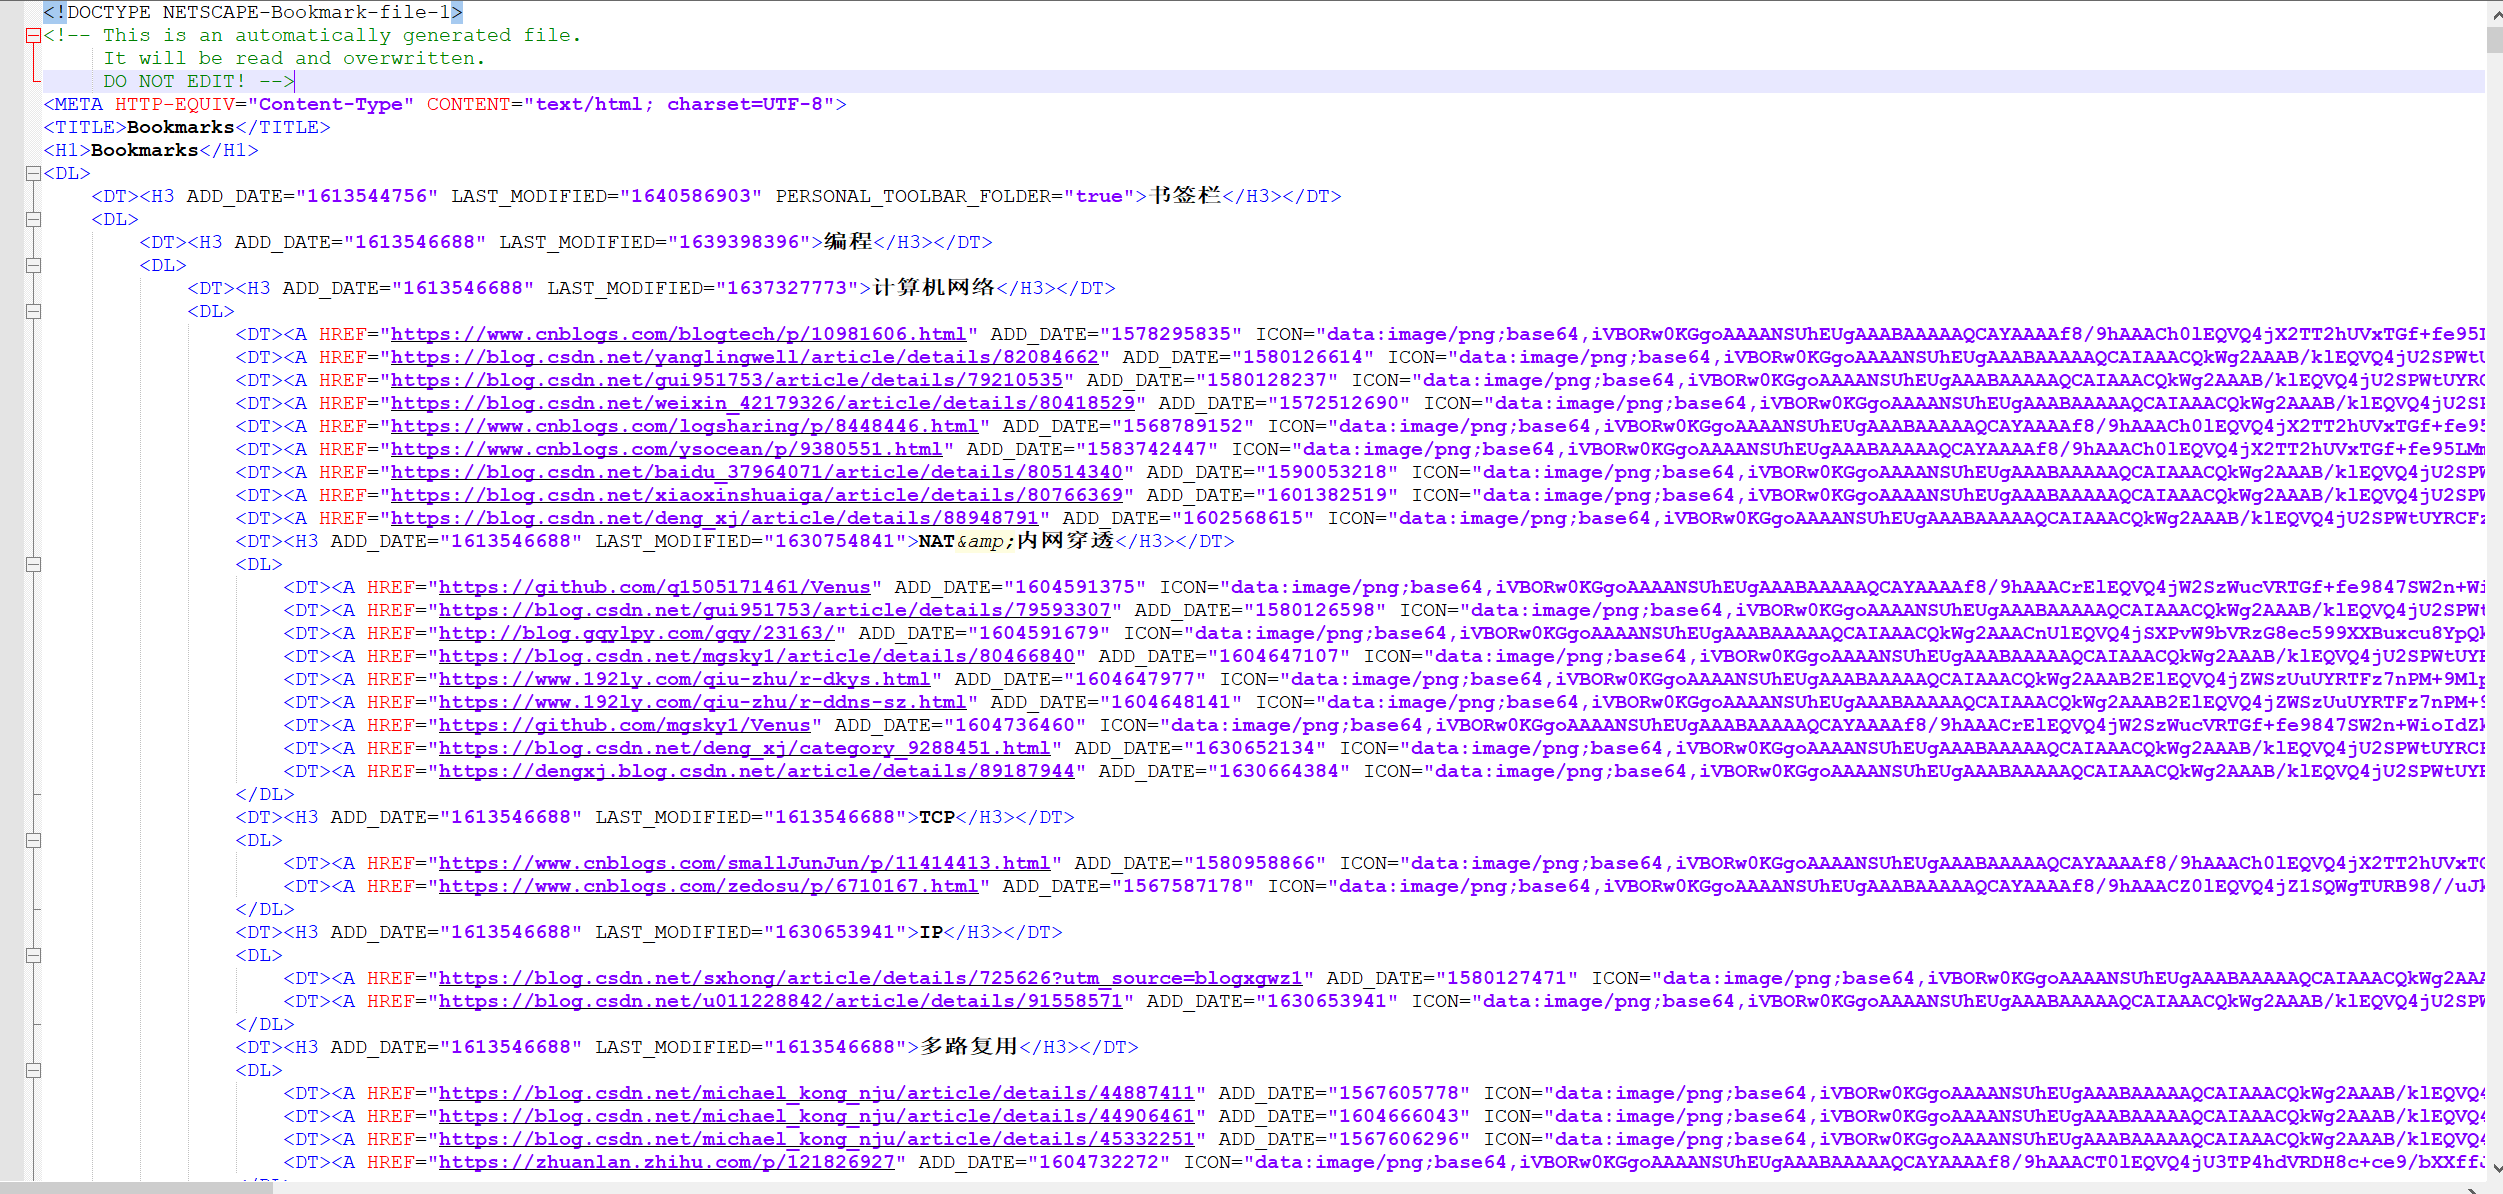
You need to use lxml to parse it into json, and then throw it to ecarts for visualization.
During lxml parsing, it was found that many DT and H3 tags in the exported html were not closed, resulting in disordered parsing. Therefore, the html content was normalized first.
def get_regular_html():
    with open(bookmark_html_file, mode='r', encoding='utf-8-sig') as fp:
        html_content = fp.read()
    '''
     Pre rule html Label, otherwise etree.HTML The structure of parsing is chaotic
    '''
    html_content = html_content.replace(r'<p>', '')
    html_content = html_content.replace(r'</H3>', r'</H3></DT>')
    html_content = html_content.replace(r'</A>', r'</A></DT>')
    return html_content
Then use the recursive method to parse lxml into json
def parse_html_recursive(root_html):
    children = []
    children_html = root_html.xpath('./child::*')
    for index, ele in enumerate(children_html):
        tag_name = ele.tag.strip()
        if tag_name == 'dt':
            if ele.xpath('./h3'):
                name = ele.xpath('./h3/text()')[0].strip()
                if name in exclude_collection:
                    continue
                children.append({
                    name_key: name,
                    children_key: parse_html_recursive(children_html[index + 1])
                })
            elif ele.xpath('./a'):
                if len(ele.xpath('./a/text()')) == 0:
                    print('Filter out those without book signatures')
                    continue
                url = ele.xpath('./a/@href')[0]
                name = ele.xpath('./a/text()')[0].strip()
                children.append({
                    name_key: name,
                    url_key: url
                })
    return children
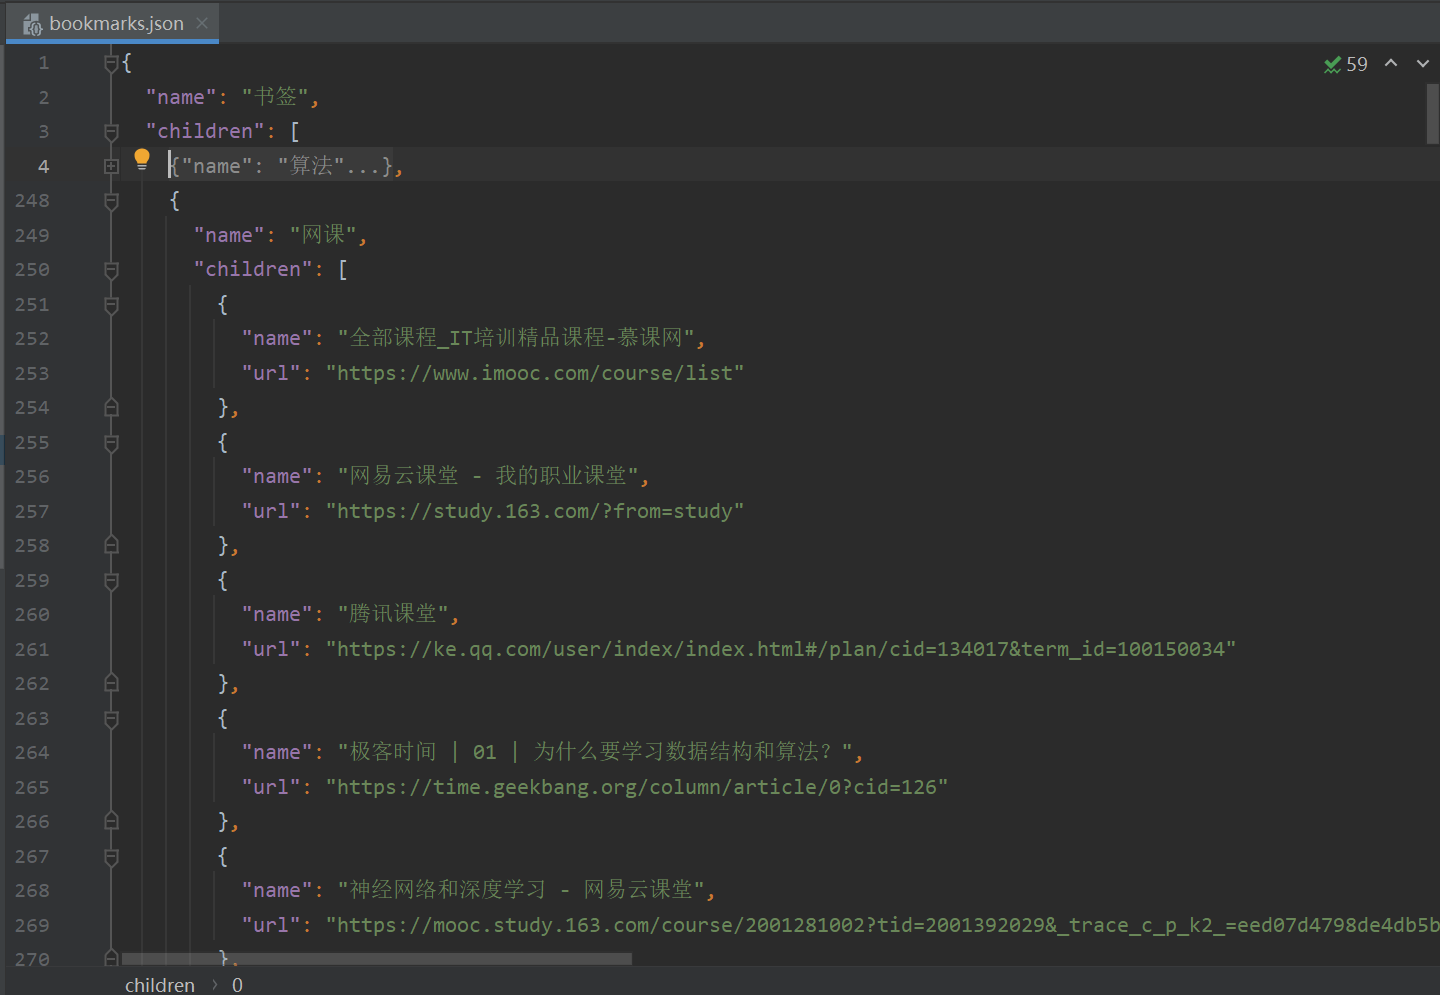
json format is roughly as follows:
Finally, echart visualizes the json content, and this part of the code is all in tree radial HTML, we won't expand it here.
Running steps
-
git clone git@github.com:inspurer/ChromeBookmarkVisual.git
-
pip install requirements.txt
-
Export your favorite bookmarks as HTML in your browser and name them bookmarks html
-
Run parse_bookmark_html_to_json.py gets bookmarks json
-
Open tree radial in the browser HTML, you can see the visualization effect, and click the leaf node
Personality configuration
- Available in parse_ bookmark_ html_ to_ json. Exclude in py file_ Add root bookmark favorites that do not require visualization to the collection variable.
- Available in tree radial Mychart.html Setoption sets the chart style. For example, layout = orthogonal can be set as a hierarchical tree view,
initialTreeDepth can set the initial maximum number of layers.
You can refer to the following station B video to view the browser bookmark export and other steps. Don't forget to connect three times with one button ~.
https://www.bilibili.com/video/BV1JY411p7f2/
reference resources
Use ECharts to draw a radial tree view of Web sites: https://www.cnblogs.com/rustfisher/p/15219690.html
ps, if you are dizzy after reading the tutorial, just look at the operation steps directly. If you don't understand, you can learn from the video of station B.