1. Basic concepts of digital image
1.1 digital image concept
Digital image, also known as digital image or digital image, is the representation of two-dimensional image with finite digital pixels. Represented by an array or matrix, its illumination position and intensity are discrete. Digital image is an image obtained by digitizing analog image, with pixel as the basic element, which can be stored and processed by digital computer or digital circuit.
1.2 pixel concept
Pixels are the basic elements of digital images. Pixels are obtained by discretizing the continuous space during the digitization of analog images. Each pixel has integer row (height) and column (width) position coordinates, and each pixel has integer gray value or color value.
1.3 image type
According to different sampling numbers and characteristics, digital images can be mainly divided into the following categories:
1.3. 1 binary image
The luminance value of each pixel in the image can only be 0 to 1
1.3. 2 gray image
Each pixel in the image can be represented by a luminance value from 0 (black) to 255 (white), and 0-255 represents different gray levels
1.3. 3 color image
Each color image is composed of three gray-scale images of different colors: B (blue), G (green) and R (red), that is, for each color image, each pixel is composed of a tuple of (B,G,R), (0,0,0) represents black and (255255255) represents white
2. Image operation
After understanding the concept of digital image, we can further operate on the image.
2.1 viewing image properties
We can view the properties of the picture itself by doing the following:
#img_1 is the note (a picture we imported)
print("img_1's dimensions:",img_1.ndim)#dimension
print("img_1's shape:",img_1.shape)#shape
print("img_1's size:",img_1.size)#size
print("img_1's dtype:",img_1.dtype)
The results are as follows:
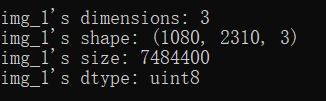
We can see that the dimension of the image is 3 because of the color image we imported. The shape is (10802310,3), which indicates that there are 1080 pixels in the width direction and 2310 pixels in the length direction
1080
×
2310
×
3
=
748440
1080\times2310\times3 = 748440
one thousand and eighty × two thousand three hundred and ten × 3 = 748440, so the corresponding array size of the image is 748440.
After knowing the above information, we can do more operations, such as viewing a pixel value:
print(img_1[540,1155])#View center point pixel values
The results are: [164,82,51]
2.2 image edge expansion
To add a border to the graph, we can use the copymakeorder function:
img_1 = cv.copyMakeBorder(img_1,10,10,10,10,cv.BORDER_CONSTANT,value=(255,0,255))
The meaning of each parameter in the function is explained as follows:
1. Add border object
2. Top, bottom, left and right are the border widths of the four corresponding positions
3. Border types: BORDER_CONSTANT,BORDER_DEFAULT,BORDER_ISOLATED,BORDER_REFLECT,BORDER_REFLECT_101,BORDER_REFLECT101,BORDER_REPLICATE,BORDER_TRANSPARENT,BORDER_WRAP for each type of style, you can try it yourself
4.value, when border type is selected_ This parameter is required when constant is used to specify the border color.
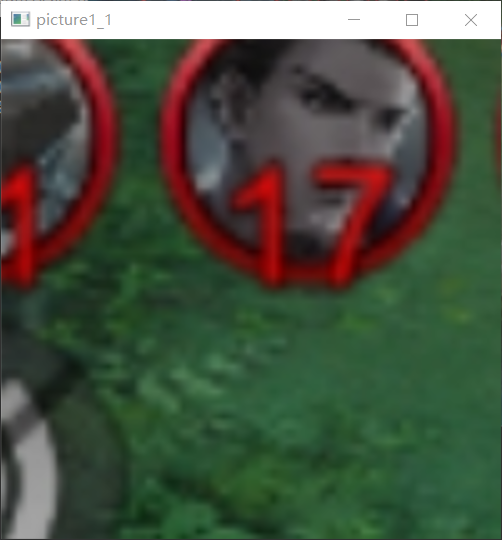
2.3 cutting and changing images
Take out some pixels and we can cut out the desired part:
img_1_1 = img_1[100:200,500:600]
cv.imshow('picture1_1',cv.resize(img_1_1,(400,400)))#The resize function of opencv itself can also change the image size
The operation results are as follows:
We can change the color of the area in the original image:
for i in range(500,701):
    for j in range(500,701):
        img_1[i,j] = [i,j,i+j]#The addition result at this time will modulo 255
cv.imshow('picture1_2',it.resize(img_1,800))
The results are as follows:
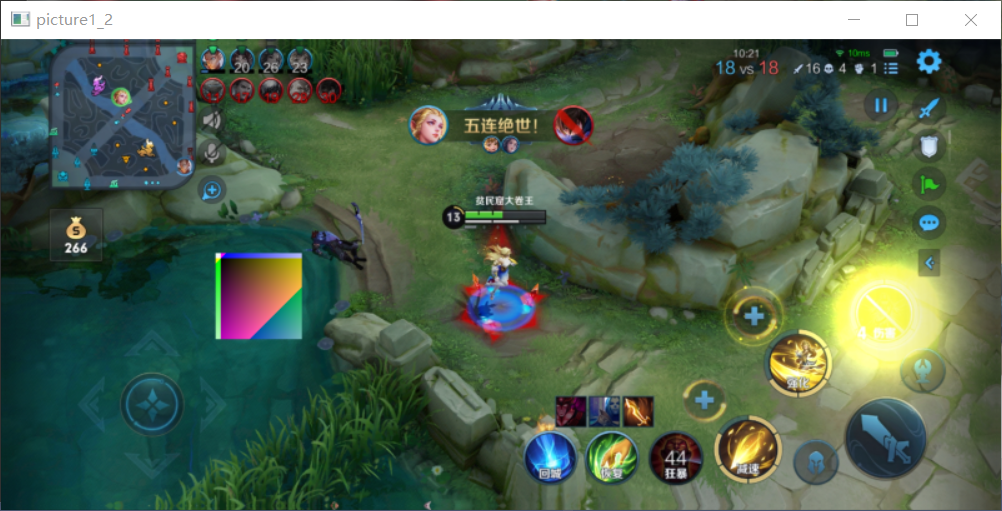
It can be seen that the color of the square areas (500500) to (700700) in the figure has been changed by us.
2.4 image fusion
The image fusion function addWeighted function can help us realize the fusion of two images, but it is conditional that the resolution of the two images should be the same, that is, the shape, size and other attributes should be the same. We fuse the following two images:

The statement is:
img = cv.addWeighted(img_1,0.6,img_4,0.4,0)#The second picture is img_ four
The form of the function is as follows:
cv2.addWeighted(InputArray src1, double alpha, InputArray src2, double beta, double gamma, OutputArray dst, int dtype=-1)
Parameter meaning:
1. First object
2. Weight of the first object
α
\alpha
α
3. The second object
4. Weight of the second object
β
(
=
1
−
α
)
\beta(=1-\alpha)
β(=1−α)
5. Offset of weighted image
γ
\gamma
γ
6. Output array
7. Depth of output array
Generally, we can use the first five variables, and the last two have default values
We are in the example
γ
\gamma
γ If the value is 0, the fused image is as follows:
γ
\gamma
γ When it is changed to 100, the image is as follows:
You can see it turn white when
γ
\gamma
γ When 255 is taken, the output image becomes pure white.
2.5 converting image space
#Image color space transformation function
cv.cvtColor(src,code)
Generally, we can pass two parameters. The first parameter is the conversion object and the second parameter is the transformation type. There are many types. You can execute the following code to view all types:
import cv2
flags = [i for i in dir(cv2) if i.startswith('COLOR_')]
print(flags)
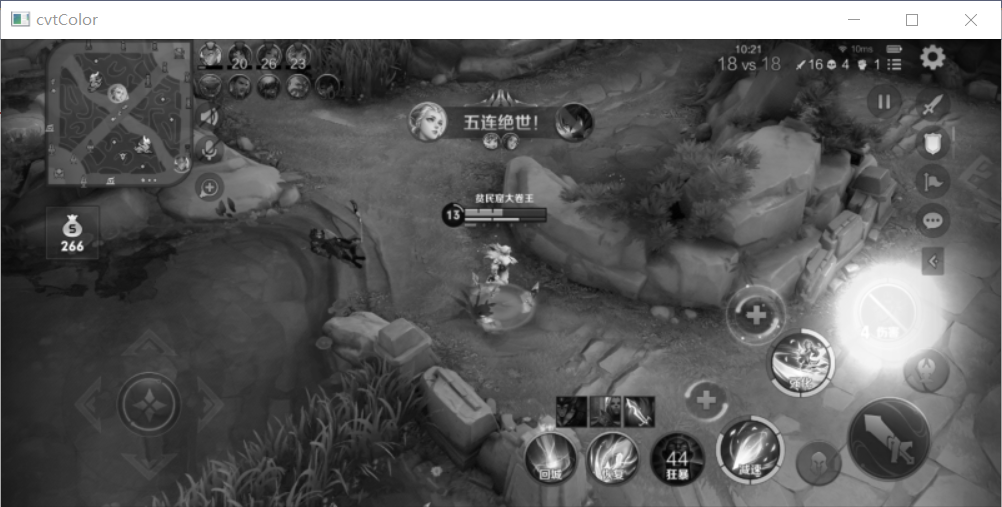
The most common type is to convert the image from BGR color image to gray image:
img = cv.cvtColor(img_1,cv.COLOR_BGR2GRAY)
The output image is:
Function can also convert the image into HSV space. You can try it on your own according to your needs.
3. Basic drawing operation
opencv provides the function of drawing graphics. Let's briefly introduce it.
3.1 draw a straight line
The general commands for drawing lines are:
cv.line(img,pt1,pt2,color,thickness = None,lineType = None)
The meaning of the parameter is:
1. Image object to be drawn
2. Pixel coordinates of line starting point
3. Pixel coordinates of line end point
4. Color, represented by (B,G,R)
5. Line width and line type, with default values
3.2 draw rectangle
The general commands for drawing rectangles are:
cv.rectangle(img,pt1,pt2,color,thickness = None,lineType = None)
PT1 and pT2 are the pixel coordinates of the upper left corner and the lower right corner of the rectangle, and other parameters are the same as those of the drawn line (hereinafter referred to as common parameters).
3.3 drawing circle
The general commands for drawing circles are:
cv.circle(img,center,radius,color,thickness = None,lineType = None)
Center is the pixel coordinate of the center of the circle, radius is the radius length, and others are public parameters. It should be pointed out that when thckness=-1, a solid circle is drawn; When positive, draws a hollow circle
3.4 drawing ellipses
The general commands for drawing ellipses are:
cv.ellipse(img,center,axes,angle,startAngle,endAngle,color,thickness = None,lineType = None)
Center is the coordinate of the central pixel, axes is the length of the major axis and minor axis, angle is the rotation angle around the center, startAngle and endAngle are the starting and ending angles of the ellipse measured clockwise from the main axis, thckness is the same as that of the circle, and the rest are common parameters
3.5 drawing polygons
The general commands for drawing polygons are:
cv.polylines(img,pts,isClosed,color,thickness = None,lineType = None)
pts is a collection of polygon points, which can be numpy Array definition. isClosed can select True or False. The former indicates closed, the latter indicates not closed (that is, whether the last point is connected to the first point), and the rest are public parameters
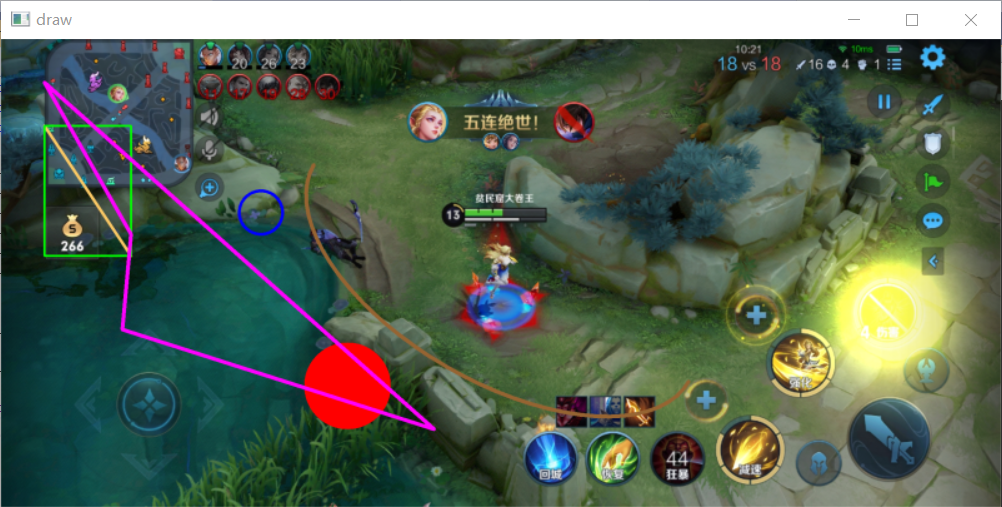
3.6 examples
Complete code examples of the above drawing operations:
import cv2 as cv
import imutils as it
import numpy as np

img_1 = cv.imread('D:/programming/Python learn/PythonApplication1/pic_1.jpg')
img_1 = cv.line(img_1,(100,200),(300,500),(100,200,250),5)
img_1 = cv.rectangle(img_1,(100,200),(300,500),(0,255,0),3)
img_1 = cv.circle(img_1,(800,800),100,(0,0,255),-1)
img_1 = cv.circle(img_1,(600,400),50,(255,0,0),5)
img_1 = cv.ellipse(img_1,(1155,540),(500,250),30,0,180,(50,100,150),8)

pts = np.array([[100,100],[300,450],[280,670],[1000,900]],np.int32)
img_1 = cv.polylines(img_1,[pts],True,(255,0,255),7)

cv.imshow('draw',it.resize(img_1,800))

if cv.waitKey(-1)==ord('A'):
    cv.destroyAllWindows()
The result is: