preface
I have written a map heat map article in openlayers 4 before, but because it is written by encapsulating a layer of js code, many beginners seem to be a bit laborious, so this article rewrites a map heat map article, directly based on the latest version of openlayers 6, in the form of pure html + js + css, without any encapsulation.
Content overview
1. Realize the effect of map thermal map based on openlayers6
2. Download the source code demo
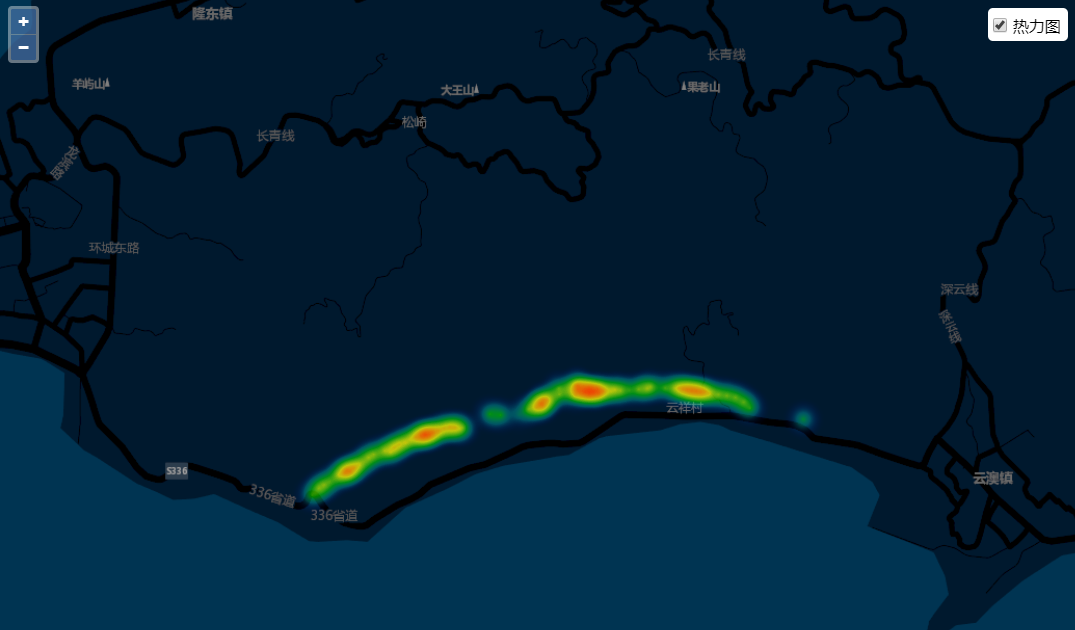
The renderings are as follows:
The main idea is as follows: read json, construct features of openlayers thermal map data source, create thermal map layer (core class of Heatmap), set some initialization parameter values of Heatmap, such as weight weight weight value, radius, gradient, blur, etc. see api of openlayers official website for parameter details Heatmap ; after creating the heat map layer, I don't write the radius value in a fixed way here. I dynamically set the different sizes of radius by listening to the map scaling events. In order to make the heat map rendering more optimistic, I have no other intention.
Specific implementation process
- html style
<!DOCTYPE html>
<html>
<head>
<meta charset="utf-8">
<title>Using OpenLayers with Webpack</title>
<link rel="stylesheet" href="https://openlayers.org/en/latest/css/ol.css" type="text/css">
<style>
html, body {
margin: 0;
height: 100%;
}
#map {
position: absolute;
top: 0;
bottom: 0;
width: 100%;
}
</style>
</head>
<body>
<div id="map"></div>
<div id="heatmapFeatureLayer" style="padding:5px;background:#ffffff;width:70px;position:absolute;right:10px;top:10px;border-radius:5px;">
<input type="checkbox" checked="checked" name="heatmapFeatureLayer" id="heatmap1" style="width: 15px;height: 15px;vertical-align: middle;margin: auto;"/>
<label style="font-weight: normal;vertical-align: middle;margin: auto;">Thermograph</label>
</div>
<script src="http://libs.baidu.com/jquery/2.1.4/jquery.min.js"></script>
<script src="./dz.js"></script>
<script src="./bundle.js"></script>
</body>
</html>
Part of the core code, see the source code for the complete demo download
1.Create heat map
/**
* Initial loading - thermodynamic diagram
*/
function initHeatMapLayer(data){
isLoad = true;
var num = data.features.length;
if (num > 0) {
var features = new Array(num);
for (var i = 0; i < num; i++) {
var geo = data.features[i].geometry;
var coordinate = [geo.x, geo.y];
features[i] = new Feature({
geometry: new Point(coordinate),
weight: data.features[i].attributes[field_dz]
});
}
loadHeatLayer(features);
}
}
function loadHeatLayer(features){
layer = createHeatMap({ features: features, radius: self.radius, gradient: self.gradient1 });//Create thermal layer
map.addLayer(layer);
map.getView().on('change:resolution', handleHeatMap);
//Zoom to range
map.getView().fit(layer.getSource().getExtent(), map.getSize());
}
/**
* Create thermal layer
* @method createHeatmap
* @param features The feature set of rendering heat map
* @return Heatmap Return to thermal layer
*/
function createHeatMap(options){
var vector = new HeatmapLayer({
source: new VectorSource({//Heat map data source
features: options.features
}),
id: 'heat',
extent: options.extent,
weight: weightFunction,//Set weight,Value at 0-1 between
gradient: options.gradient,
blur: 15,//Default 15
radius: options.radius || 8//Default 8
});
/*
*Set weight
*/
function weightFunction(feature) {
var weight = feature.get('weight');
weight = parseFloat(weight);
//weight = parseFloat(weight) / 10;
return weight;
}
return vector;
}
2. Dynamically set the rendering radius of the thermal map according to the zoom level of the map
/**
* Listen to map zoom events
* Dynamically setting the rendering radius of the thermal map according to the zoom level of the map
*/
function handleHeatMap(){
if (layer) {
layer.setVisible(true);
var radius = getRadiusByMapZoom();
//console.log('Thermodynamic diagram radius',radius);
layer.setRadius(radius);
}
}

function getRadiusByMapZoom(){
var radius = 2;
//console.log('map.getView().getZoom()',map.getView().getZoom());
switch (Math.floor(map.getView().getZoom())) {
case 9:
radius = 2;
break;
case 10:
radius = 3;
break;
case 11:
radius = 4;
break;
case 12:
radius = 5;
break;
case 13:
radius = 6;
break;
case 14:
radius = 7;
break;
case 15:
radius = 8;
break;
case 16:
radius = 9;
break;
default:
if (map.getView().getZoom() > 16) {
radius = 9;
}
else {
radius = 2;
}
}
return radius;
}

/**
* Create thermal layer
* @method createHeatmap
* @param features The feature set of rendering heat map
* @return Heatmap Return to thermal layer
*/
function createHeatMap(options){
var vector = new HeatmapLayer({
source: new VectorSource({//Heat map data source
features: options.features
}),
id: 'heat',
extent: options.extent,
weight: weightFunction,//Set weight,Value at 0-1 between
gradient: options.gradient,
blur: 15,//Default 15
radius: options.radius || 8//Default 8
});
/*
*Set weight
*/
function weightFunction(feature) {
var weight = feature.get('weight');
weight = parseFloat(weight);
//weight = parseFloat(weight) / 10;
return weight;
}
return vector;
}
3. Set the visibility of heat map layer