1. Outlier definition
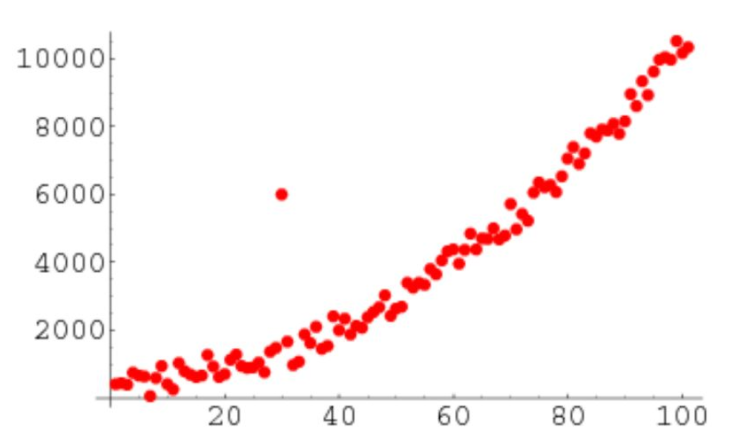
In statistics, outliers are data points that do not belong to a specific population, and are abnormal observations far away from other values. Outliers are observations different from other well structured data.
For example, you can clearly see the outliers in this list: [20,24,22,19,29,184300,30,18]
It is easy to identify outliers when the observations are a pile of numbers and all are one-dimensional, but if thousands of observations or data are multidimensional, you may need a smarter method to detect these outliers.
2. Outlier handling method
2.1 mean square deviation
3σprinciple
 If the data follows a normal distribution, in 3σIn principle, outliers are defined as values in a set of measured values that deviate from the average by more than three times the standard deviation.
Under normal distribution, the average distance is 3σThe probability of occurrence of values other than P(|x-μ|>3σ)<=0.003,It belongs to a very small probability event.
If the data does not obey the normal distribution, it can also be described by how many times the standard deviation away from the average
This principle has a prerequisite: the data needs to obey the normal distribution
In 3∂In principle, if the difference between the observed value and the average value exceeds 3 times the standard deviation, it can be regarded as an abnormal value.
Plus or minus 3∂The probability is 99.7%,Then the average distance is 3∂The probability of occurrence of values other than P(|x-u| > 3∂) <= 0.003,It belongs to a very small probability event.
import numpy as np
import pandas as pd

def detect_outliers(data,threshold=3):
    mean_d = np.mean(data)
    std_d = np.std(data)
    outliers = []

    for y in data_d:
        z_score= (y - mean_d)/std_d
        if np.abs(z_score) > threshold:
            outliers.append(y)
    return outliers
2.3 box diagram
The concept of interquartile spacing (IQR) was used to construct box graphs. IQR is a concept in statistics, which measures statistical dispersion and data variability by dividing the data set into quartiles.
In short, any data set or any set of observations can be divided into four determined intervals according to the values of the data and their comparison with the whole data set. The quartile divides the data into three points and four intervals.
Interquartile spacing is very important to define outliers. It is the difference between the third quartile and the first quartile (IQR = Q3 -Q1). In this case, the outlier is defined as the observed value lower than the tentacle on the box diagram (or Q1 − 1.5x IQR) or higher than the tentacle on the box diagram (or Q3 + 1.5x IQR).
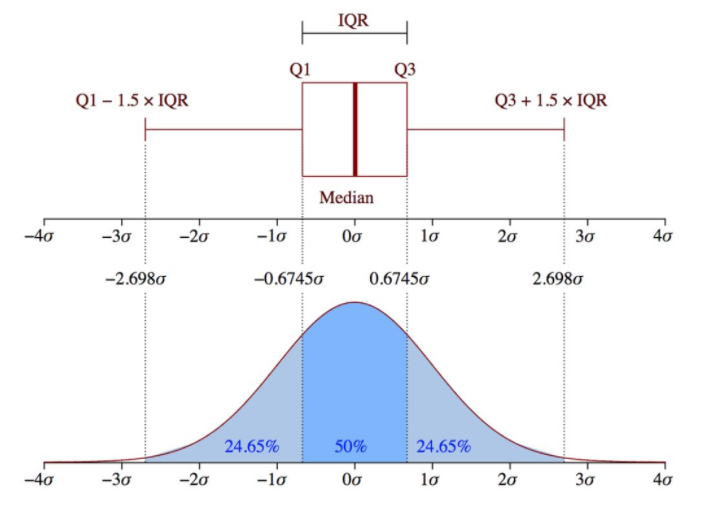
IQR is a measure of statistical dispersion degree. The dispersion degree needs to be observed with the help of box graph. Generally, data points less than Q1 - 1.5 * IQR or greater than Q3 + 1.5 * IQR are regarded as outliers. The formula for detecting outliers is:
outliers = value < ( Q1 - 1.5 * IQR ) or value > ( Q3 + 1.5 * IQR )
This method of detecting outliers is the default method of box graph, which provides a standard for identifying outliers / outliers:
Outliers are usually defined as less than QL - l.5 IQR Or greater than Qu + 1.5 IQR The value of, QL Called the lower quartile, Qu Called the upper quartile, IQR It's called the interquartile range, yes Qu Upper quartile sum QL The difference in the lower quartile, which includes half of all observations.
def detect_outliers(sr):
    q1 = sr.quantile(0.25)
    q3 = sr.quantile(0.75)
    iqr = q3-q1 #Interquartile range
    fence_low  = q1-1.5*iqr
    fence_high = q3+1.5*iqr
    outliers = sr.loc[(sr < fence_low) | (sr > fence_high)]
    return outliers
3. Actual combat
After the introduction of the basic data knowledge above, let's move on to today's topic, that is, using python and pandas for data analysis. Today's main goal is to find outliers in the data. (we use the first method described earlier)
3.1 loading data
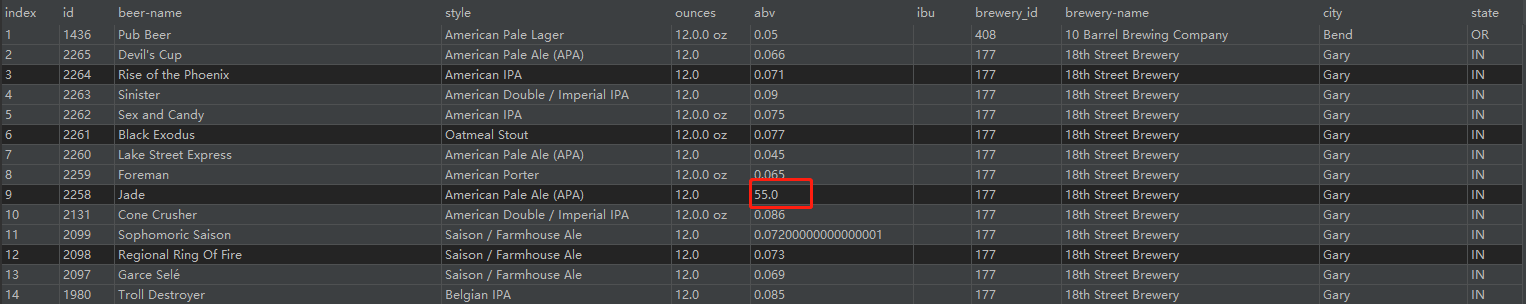
First, we need to load the data for analysis. We also use beer's data. However, the data here is processed. We can see that most of the values of the abv attribute column are 0.0 *, basically no more than 1, but there are also 55 data, that is, these data are much larger than other data. We mainly process this part of data.
class Repair_Dirty(object):
    __init_data = 0

    def __init__(self, filename):
        self.filename = filename

    def get_data(self):
        if self.filename == " ":
            # print("the file path you entered is empty")
            return
        else:
            self.__init_data = pd.read_csv(self.filename)

        return self.__init_data

#The main function defines an object and calls the method
if __name__ == "__main__":
    file_path = 'dirty_beer_last.csv'
    data_cla = Repair_Dirty(file_path)
    data = data_cla.get_data()#Get data
As shown in the following data diagram, the data in the red box is 55, which is what we call outliers. Our goal is to find such data through the first method.
3.2 detection of outlier data
Using the first detection method to detect outliers, we mainly define a function find_outlier(), and the function is implemented inside the class.
    # Outliers found, abv column
    def find_outlier(self, attribute):
        data_att = self.__init_data[attribute]
        # Outliers found
        outlier = data_att[np.abs(data_att - data_att.mean()) > 3 * data_att.std()]
        print(data.loc[data[attribute] == 55])#Output the abnormal value of abv attribute
        #print(np.where(self.__init_data[attribute] == 55))  # Returns the index of the specified location
        return outlier
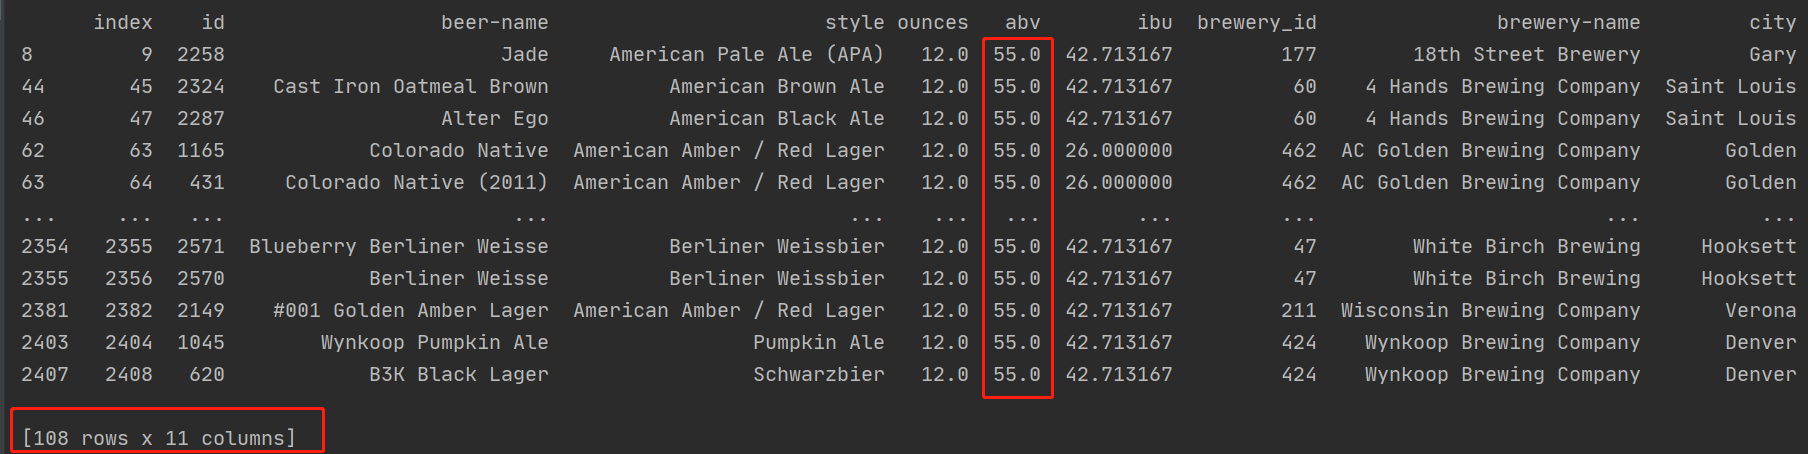
In the following picture, we can see that the abv value in 108 rows of data in the whole data table is 55, so it is obvious that we have basically achieved the desired goal and found the abnormal value in the data. According to the index or id, we can replace the value and repair the abnormal value.
3.4 index position for displaying outliers
Now that we have found the abnormal value, it is easier for us to index and display it, that is, a line of code. In fact, we can see it in the above code, but the above line of code has been commented out by us, and it will be displayed separately below.
print(np.where(self.__init_data[attribute] == 55)) # Returns the index of the specified location
This line of code displays the outlier index.
So far, today's blog post on data analysis and outlier processing has been written here. Xiao Zhang is still learning nonstop. I hope this article can help the little partner who is learning data analysis!!!
awesome
Finally, attach the source code, which can be taken by small partners in need.
import pandas as pd
import numpy as np
import re

class Repair_Dirty(object):
    __init_data = 0

    def __init__(self, filename):
        self.filename = filename

    def get_data(self):
        if self.filename == " ":
            # print("the file path you entered is empty")
            return
        else:
            self.__init_data = pd.read_csv(self.filename)

        return self.__init_data

	# Outliers found, abv column
    def find_outlier(self, attribute):
        data_att = self.__init_data[attribute]
        # Outliers found
        outlier = data_att[np.abs(data_att - data_att.mean()) > 3 * data_att.std()]
        print(data.loc[data[attribute] == 55])#Output the abnormal value of abv attribute
        print(np.where(self.__init_data[attribute] == 55))  # Returns the index of the specified location
        return outlier

if __name__ == "__main__":
    file_path = 'dirty_beer_last.csv'
    data_cla = Repair_Dirty(file_path)
    data = data_cla.get_data()
    print((data))
    if data is None:
        print("The path is empty, the program exits!!!")
    else:
        data = data_cla.fill_na()
        outlier = data_cla.find_outlier()
        print(outlier)