Characteristic Engineering
1. Definitions
1.1 why feature engineering is needed
- The features in the sample data may have missing values, duplicate values, abnormal values, etc., so the relevant noise data in the features need to be processed
- Processing purpose: there is a purer sample set, so that the model can have better prediction ability based on this set of data
1.2 what is characteristic engineering
- Feature engineering is the process of transforming the original data into a better feature representing the potential problems of the prediction model, so as to improve the accuracy of the prediction of unknown data
- For example, AlphaGo's learning data includes chess scores, recipes and lyrics. Some interference data will definitely affect AlphaGo's learning
1.3 significance of characteristic Engineering
- It will directly affect the prediction results of the model
1.4 realize characteristic Engineering
- Tool: sklearn
- Introduction to sklearn
- It is a machine learning tool in python language, including the implementation of many well-known machine learning algorithms. Its documents are perfect and easy to use
- function
- Classification model
- regression model
- Clustering model
- Characteristic Engineering
2. Feature extraction
2.1 purpose
-
The characteristic data in the collected samples are often string or other types of data. The computer can only recognize binary numerical data. If the string is given to the computer, the computer cannot recognize [if it is not numerical data, it cannot recognize]
-
Effect demonstration [convert string to number]
from sklearn.feature_extraction.text import CountVectorizer
vector=CountVectorizer()
res=vector.fit_transform(['lift is short,I love python','lift is too long,I hate python'])
print(res.toarray())
# [[0 1 1 0 1 1 1 0]
#  [1 1 1 1 0 1 0 1]]
-
conclusion
- Feature extraction is to convert text and other data into numerical data. The purpose of feature extraction is to make the machine better understand the data
2.2 method of feature extraction
2.2.1 dictionary feature extraction
- Function: to characterize dictionary data
from sklearn.feature_extraction import DictVectorizer
fit_transform(X) #X is the dictionary or the iterator containing the dictionary, and the return value is the sparse matrix
inverse_transform(X) #X is a sparse matrix or array, and the return value is the data format before conversion
transform(X) #Convert according to the original standard
get_feature_names() #Return category name
- Sample code
from sklearn.feature_extraction import DictVectorizer
alist=[
{"city":'AHui','temp':33},
{'city':'GZ','temp':42},
{'city':'SH','temp':40}
]
d=DictVectorizer() #Instantiate a tool class object
feature=d.fit_transform(alist) #Returns a sparse matrix (stored is the result of eigenvalueization)
print(feature)
# (0, 0) 1.0
# (0, 3) 33.0
# (1, 1) 1.0
# (1, 3) 42.0
# (2, 2) 1.0
# (2, 3) 40.0
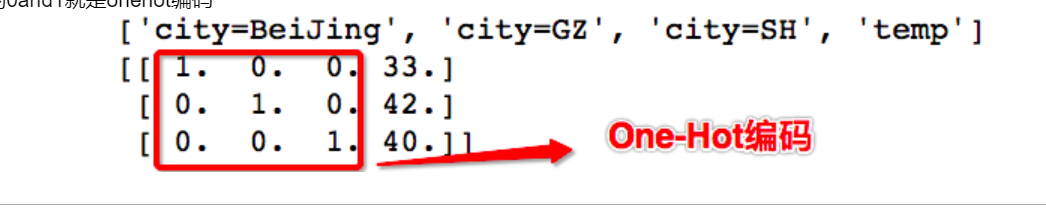
print(d.get_feature_names())
# ['city=AHui', 'city=GZ', 'city=SH', 'temp']
print(feature.toarray())
# [[ 1. 0. 0. 33.]
# [ 0. 1. 0. 42.]
# [ 0. 0. 1. 40.]]
-
Supplementary, understanding of spark matrix
- If you set spark = false in the constructor of DictVectorizer class, you will return an array instead of a spark matrix
- The spark matrix is a disguised array or list to save memory
-
Sample code
from sklearn.feature_extraction import DictVectorizer
alist=[
    {"city":'AHui','temp':33},
    {'city':'GZ','temp':42},
    {'city':'SH','temp':40}
]
d=DictVectorizer(sparse=False)
#Returns a two-dimensional list
fature=d.fit_transform(alist)
print(d.get_feature_names())    # ['city=AHui', 'city=GZ', 'city=SH', 'temp']
print(feature)
#Output result: 1 is yes, 0 is No
                               # [[ 1.  0.  0. 33.]
                               #  [ 0.  1.  0. 42.]
                                # [ 0.  0.  1. 40.]]
2.2.2 text feature extraction
-
Function: to characterize text data
from sklearn.feature_extraction.text import CountVectorizer
fit_transform(X) #X is text or an iteratable object containing a text string, and returns the spark matrix
inverse_transform(X) #X is a sparse matrix or array, and the return value is the data format before conversion
toarray() #Convert sparse matrix to array
-
Sample code
from sklearn.feature_extraction.text import CountVectorizer
vector=CountVectorizer()
res=vector.fit_transform(['lift is is short,I love python','lift is too long,I hate python'])
print(res)#sparse matrix
#   (0, 2)	1
#   (0, 1)	2
#   (0, 6)	1
#   (0, 4)	1
#   (0, 5)	1
#   (1, 2)	1
#   (1, 1)	1
#   (1, 5)	1
#   (1, 7)	1
#   (1, 3)	1
#   (1, 0)	1
print(vector.get_feature_names())
#['hate', 'is', 'lift', 'long', 'love', 'python', 'short', 'too']
print(res.toarray())#Convert sparse matrix into array
# [[0 2 1 0 1 1 1 0]
#  [1 1 1 1 0 1 0 1]]
#Note: a single letter is not counted (because a single letter does not represent the actual meaning), and then each number represents the number of times the word appears
-
-
Feature extraction of Chinese text [feature extraction of Chinese text with punctuation marks]
from sklearn.feature_extraction.text import CountVectorizer
vector=CountVectorizer()
res=vector.fit_transform(['Life is short, I use it python','Life is long, no need python'])
print(res)
# (0, 2)	1
#   (0, 3)	1
#   (1, 1)	1
#   (1, 0)	1
print(vector.get_feature_names())
['no need python', 'Life is long', 'Life is short', 'I use python']
print(res.toarray())
# [[0 0 1 1]
#  [1 1 0 0]]
-
Feature extraction of Chinese text [feature extraction of Chinese text with punctuation and space separation] [Note: single Chinese character is not counted]
from sklearn.feature_extraction.text import CountVectorizer
vector=CountVectorizer()
res=vector.fit_transform(['Life is short, I use it python','Life is long, no need python'])
print(res)
# (0, 2)	1
#   (0, 5)	1
#   (0, 4)	1
#   (1, 2)	1
#   (1, 3)	1
#   (1, 1)	1
#   (1, 0)	1
print(vector.get_feature_names())
# ['python', 'no need', 'life', 'long', 'use python', 'bitter short']
print(res.toarray())
# [[0 0 1 0 1 1]
#  [1 1 1 1 0 0]]
-
At present, CountVectorizer can only extract features from texts with punctuation marks and separators, which can not meet the requirements [in natural language processing, we need to extract relevant words, idioms, adjectives... In a Chinese text]
2.2.3 Jieba participle
-
Word segmentation of Chinese articles
-
use
#Basic usage: word segmentation of articles
import jieba
jb = jieba.cut('I am a good man')
content = list(jb)
ct = ' '.join(content)
print(ct) #Returns space sensitive words
import jieba from sklearn.feature_extraction.text import CountVectorizer jb1=jieba.cut('Life is short, I use it python,Do you think I'm right?') ct1=" ".join(list(jb1)) print(ct1) # Life is short. I use python. Do you think I'm right? jb2=jieba.cut('Life is long, no need python,Do you think I'm right?') ct2=" ".join(list(jb2)) print(ct2) # Life is long without python. Do you think I'm right? vector=CountVectorizer() res=vector.fit_transform([ct1,ct2]) print(res) # (0, 2) 1 # (0, 5) 1 # (0, 3) 1 # (0, 0) 1 # (0, 6) 1 # (1, 2) 1 # (1, 0) 1 # (1, 4) 1 # (1, 1) 1 print(vector.get_feature_names()) # ['python', 'don't use', 'life', 'I use', 'full length', 'bitter short', 'feel'] print(res.toarray()) # [[1 0 1 1 0 1 1] # [1 1 1 0 1 0 0]]
2.3 onhot coding
-
0 and 1 in the sparse matrix are onehot codes
[the external chain picture transfer fails. The source station may have an anti-theft chain mechanism. It is recommended to save the picture and upload it directly (img-dF8vyrS3-1643612347729)(assets/1.PNG)]
-
Why do you need onehot coding
-
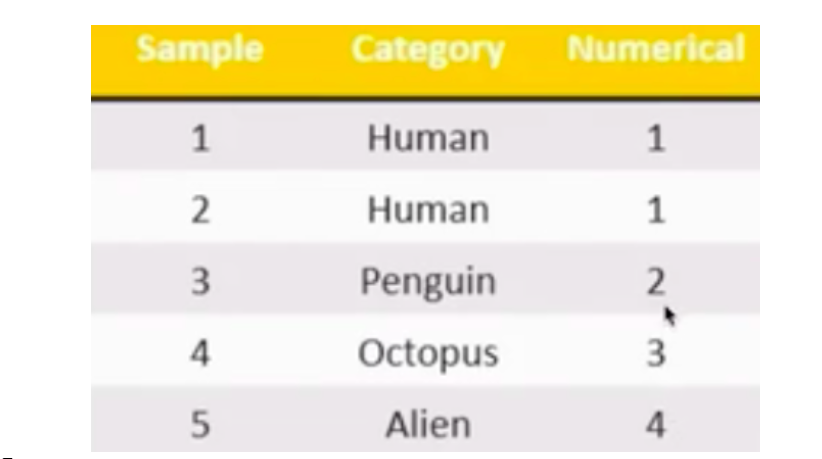
The main purpose of feature extraction is to eigenvalue non numerical data! If you need to manually eigenvalue the human and alien in the figure below, alien is 4 and human is 1. Is there a priority or weight between 1 and 4?
[the external chain image transfer fails. The source station may have an anti-theft chain mechanism. It is recommended to save the image and upload it directly (img-P7c3FYns-1643612347731)(assets/2)
.PNG)] -
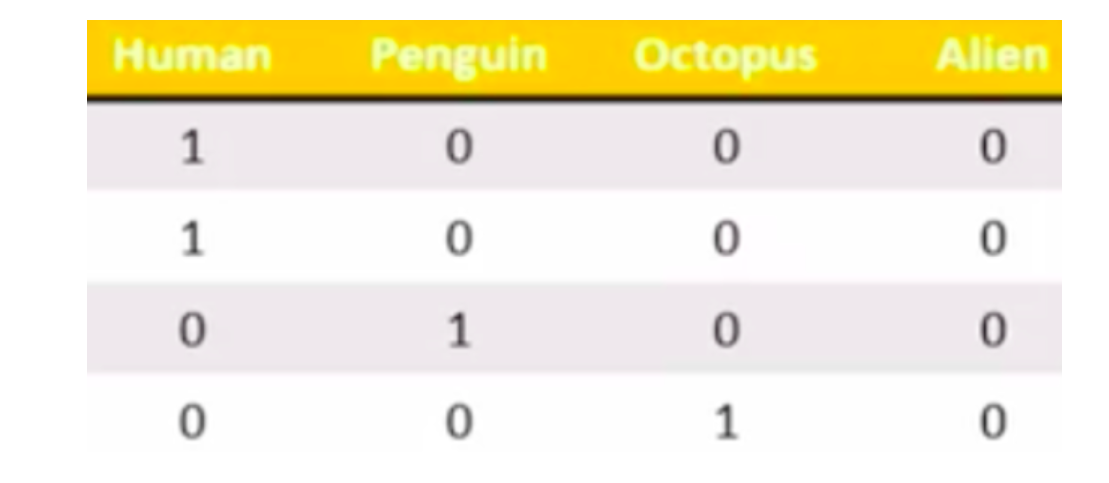
You need to encode with onehot
[the external chain picture transfer fails. The source station may have an anti-theft chain mechanism. It is recommended to save the picture and upload it directly (img-11SUV0vP-1643612347732)(asset)
s/3.PNG)] -
Implementation of onehot coding based on pandas [pd.get_dummies(df['col ']]
import pandas as pd
df=pd.DataFrame([
    ['green','M',20,'class1'],
    ['red','L',21,"class2"],
    ['blue','XL',30,'class3']
])
df.columns=['color','size','weight','class label']
#Turn the color column into one hot encoding
pd.get_dummies(df['color'])

#		blue	green	red
#	0	0		1		0
#	1	0		0		1
#	2	1		0		0
-
3. Pretreatment of eigenvalues
-
Processing numerical data
-
Pretreatment is the way to realize unlimited tempering
-
Unlimited tempering:
- In the practice of machine learning algorithms, we often have the need to convert data of different specifications to the same specification, or data of different distributions to a specific distribution. This demand is collectively referred to as "dimensionless" of data
- For example:
- In the algorithm with gradient and matrix as the core; Logistic regression, support vector machine, neural network, immeasurable tempering can speed up the solution speed;
- In distance models, such as k-nearest neighbors and K-Means clustering, immeasurable tempering can help us improve the accuracy of the model and avoid the impact of a feature with a particularly large value range on distance calculation (a special case is the integrated algorithm of decision tree and tree, which does not need immeasurable tempering for decision tree, and the decision tree can handle any data very well)
-
Meaning: after feature extraction, we can obtain the corresponding numerical sample data, and then process the data
-
Concept: convert the algorithm into the data required by the algorithm through specific statistical methods (mathematical methods)
-
mode
- normalization
- Standardization
-
case analysis
[the external chain picture transfer fails. The source station may have an anti-theft chain mechanism. It is recommended to save the picture and upload it directly (img-S30Zty3d-1643612347734)(as
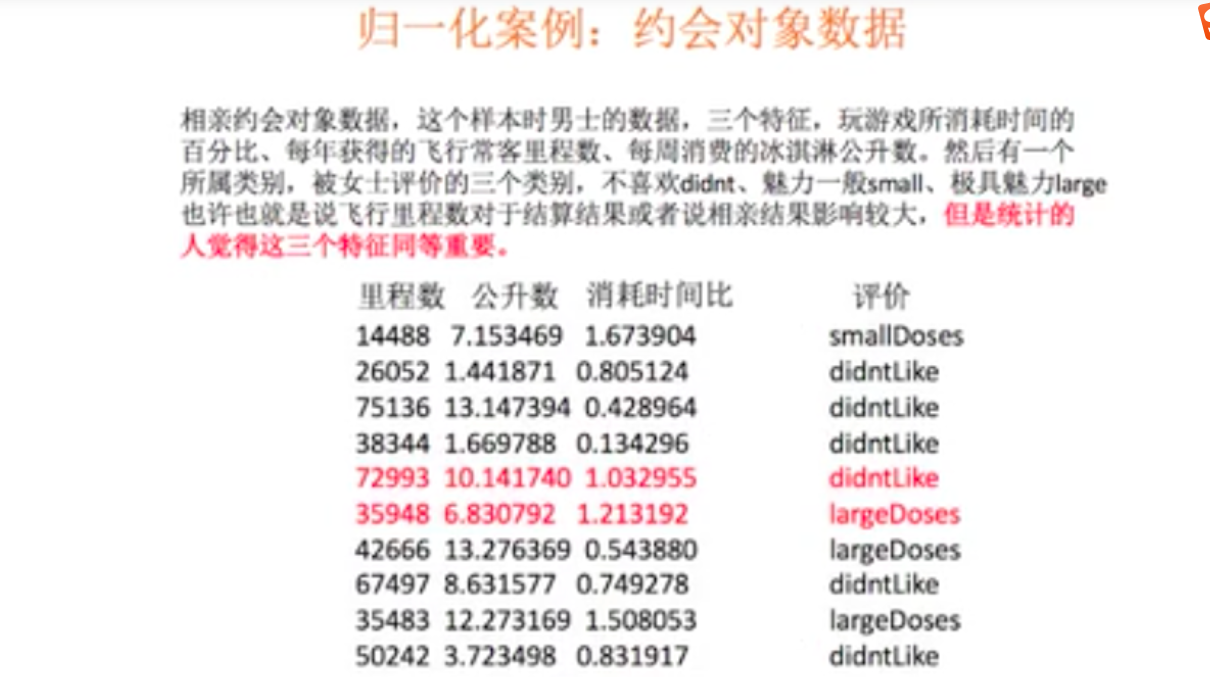
sets/4.PNG)]- If it is considered that each feature with the same weight is equally important, it must be normalized
- KNN algorithm can be used to explain the influence of features.
3.1 normalization realization
[the external chain picture transfer fails. The source station may have an anti-theft chain mechanism. It is recommended to save the picture and upload it directly (img-wBAaUL3l-1643612347734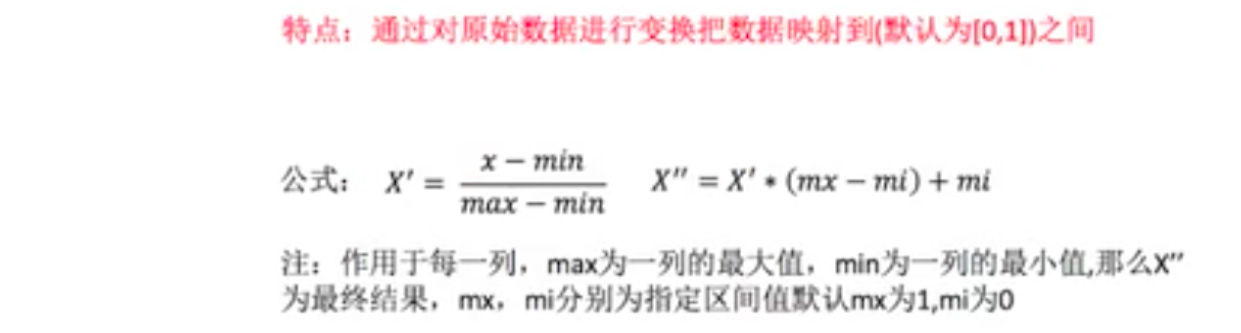
)(assets/5.PNG)]
- The normalized data obey normal distribution
from sklearn.preprocessing import MinMaxScaler
 Parameters: feature_range Represents the zoom range, usually using(0,1)
Function: so that a feature will not have a great impact on the final result
from sklearn.preprocessing import MinMaxScaler
mm=MinMaxScaler(feature_range=(0,1))  #Scale range for each feature
data=[[90,2,10,40],[60,5,15,45],[73,3,13,45]]
data=mm.fit_transform(data)#data requires normalized features
print(data)
# [[1.         0.         0.         0.        ]
#  [0.         1.         1.         1.        ]
#  [0.43333333 0.33333333 0.6        1.        ]]
-
Question: if there are many outliers in the data, what will be the impact?
- Combined with the formula of normalization calculation, outliers have a great impact on the maximum and minimum values in the original features, so they will also affect the normalized values. This is also a disadvantage of normalization, which can not deal with many outliers well
-
Normalization summary:
- In a specific scene, the maximum and minimum values change. In addition, the maximum and minimum values are easily affected by outliers, so this normalization method has certain limitations. Therefore, it leads to a better way called: standardization!!!
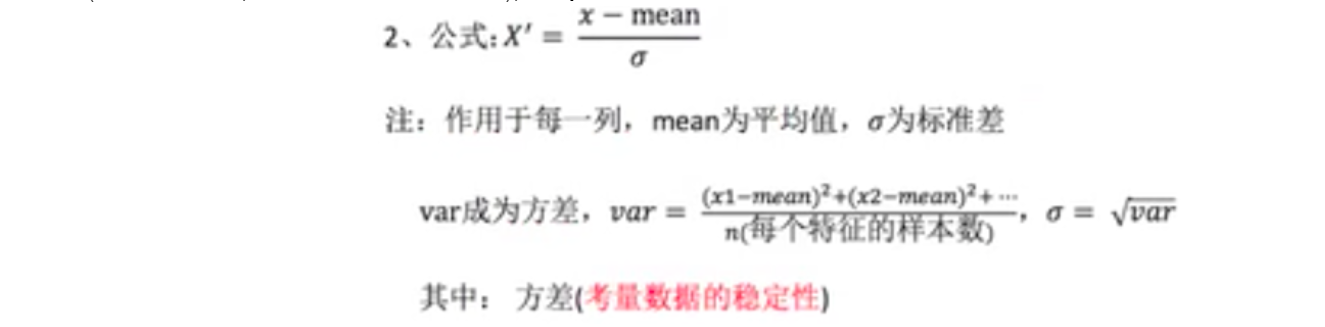
3.2 standardized treatment
-
When the data is centered according to the mean value and then scaled according to the standard deviation, the data will obey the normal distribution (i.e. standard normal distribution) with mean value of 0 and variance of 1. This process is called data Standardization (also known as Z-score normalization). The formula is as follows
[the transfer of external chain pictures fails. The source station may have an anti-theft chain mechanism. It is recommended to save the pictures and upload them directly (img-86191hYD-1643612347735)(assets/6.P
NG)] -
It can be seen from the formula that the outliers have little effect on the mean and standard deviation
-
API
-
After processing, all the data in each column are clustered around the range with mean value of 0 and standard deviation of 1
-
Standardized API:
from sklearn.preprocessing import StandardScaler
fit_transform(X) #Standardize X
mean_#mean value
var_ #variance
-
Examples
from sklearn.preprocessing import StandardScaler
ss=StandardScaler()
data=[[90,2,10,40],[60,5,15,45],[73,3,13,45]]
ss.fit_transform(data)
# array([[ 1.27540458, -1.06904497, -1.29777137, -1.41421356],
#        [-1.16685951,  1.33630621,  1.13554995,  0.70710678],
#        [-0.10854507, -0.26726124,  0.16222142,  0.70710678]])
ss.mean_   #array([74.33333333,  3.33333333, 12.66666667, 43.33333333])
ss.var_   #array([150.88888889,   1.55555556,   4.22222222,   5.55555556])
-
3.3 summary of normalization and standardization
- Normalization, if there is an abnormal value, it will affect the maximum value and minimum value of the feature, and the final result will be greatly affected
- Standardization: if there are outliers, due to a certain amount of data, a small number of outliers have little impact on the average value, so the change of standard deviation is relatively small
3.4 standardscaler and MinMaxSclaer which one to choose?
- In most machine learning algorithms, StandardSclaer will be selected for feature scaling, because MinMaxSclaer is very sensitive to outliers. Among the algorithms of CPA, clustering, logistic regression, support vector machine and neural network, StandardSclaer is often the best choice.
- MinMaxScaler is widely used when it does not involve distance measurement, gradient, covariance calculation and data needs to be compressed to a specific interval. For example, when quantifying pixel intensity in digital image processing, MinMaxScaler will be used to compress data into [0,1] interval
- It is recommended to use StandardScaler first. If the effect is not good, replace MinMaxScaler
4. Feature selection
4.1 definitions
-
Select the features that are meaningful and helpful to the model from the features as the final machine learning input data
-
be careful
- Before making feature selection, there are three very important things:
- Contact the data provider
- Communicate with data providers
- Meeting with data providers
- Be sure to catch the people who provide you with data, especially those who understand the business and the meaning of data. Talk to them for a while. Technology can make the model take off. The premise is that you understand the data as well as the salesperson. Therefore, feature selection is the first step. Select features with business common sense according to the goal
- Before making feature selection, there are three very important things:
4.2 reasons for feature selection
- Redundancy: some features have high correlation and are easy to consume computer performance [high data similarity] [for example, there are floors and heights in the house price prediction data, and the correlation of these two features is high]
- Noise: some features have a paranoid impact on the prediction results [data unrelated to the prediction] [for example, house price prediction, including the height of the person who bought the house, data unrelated to the prediction]
4.3 realization of feature selection
-
Artificially discard irrelevant features
-
In real data application fields, such as finance, medical treatment and e-commerce, we have a lot of data features. It is obvious that if we encounter extreme situations and we can't rely on our understanding of the business to select the features, what should we do?
- Based on the existing features and corresponding prediction results, relevant tools are used to filter some useless or low weight features
- tool
- Filter
- Embedded: the decision tree model will select its own important features
- PCA dimensionality reduction
- tool
- Based on the existing features and corresponding prediction results, relevant tools are used to filter some useless or low weight features
4.4 feature selection tool
4.4.1 filter formula (variance filter):
-
Principle: This is to screen feature classes through the variance of the feature itself. For example, if the variance of a feature itself is very small, it means that the samples have basically no difference in this feature. Most of the values in the feature may be the same, or even the values of the whole feature are the same. Then this feature has no effect on sample differentiation, so no matter what the next feature engineering needs to do, Priority should be given to eliminating features with 0 or low variance
-
API
from sklearn.feature_selection import VarianceThreshold
VarianceThreshold(threshold=x) #threshold is the value of variance. All features with variance lower than x are deleted. The default value is 0, which means that all features with variance other than 0 are retained
fit_transform(X) #X is characteristic
-
Examples
from sklearn.feature_selection import VarianceThreshold
#Value of threshold variance, threshold=1, delete all features with variance lower than 1, default to 0, and keep all features with variance other than 0
v=VarianceThreshold(threshold=1)
v.fit_transform([[0,2,4,3],[0,3,7,3],[0,9,6,3]])#X is characteristic [data is characteristic]
-
-
If there are many remaining features after taking out the features with 0 or very low variance, and the effect of the model is not significantly improved, the variance can be used to select the features [one step in place]. If half of the features are left, you can set a variance threshold to halve the total number of features, that is, find the median of the feature variance and take the median as the value of the parameter threshold
from sklearn.feature_selection import VarianceThreshold
#Value of threshold variance, threshold=1, delete all features with variance lower than 1, default to 0, and keep all features with variance other than 0
v=VarianceThreshold(threshold=np.median(X.var().values))
v.fit_transform(X)## X is the characteristic column in the sample data
-
Influence of variance filtering on the model
-
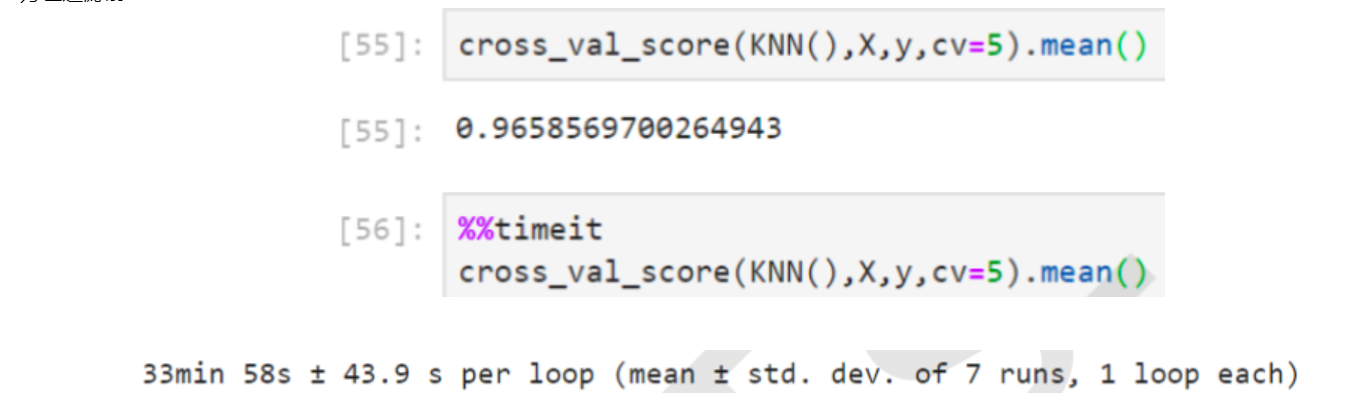
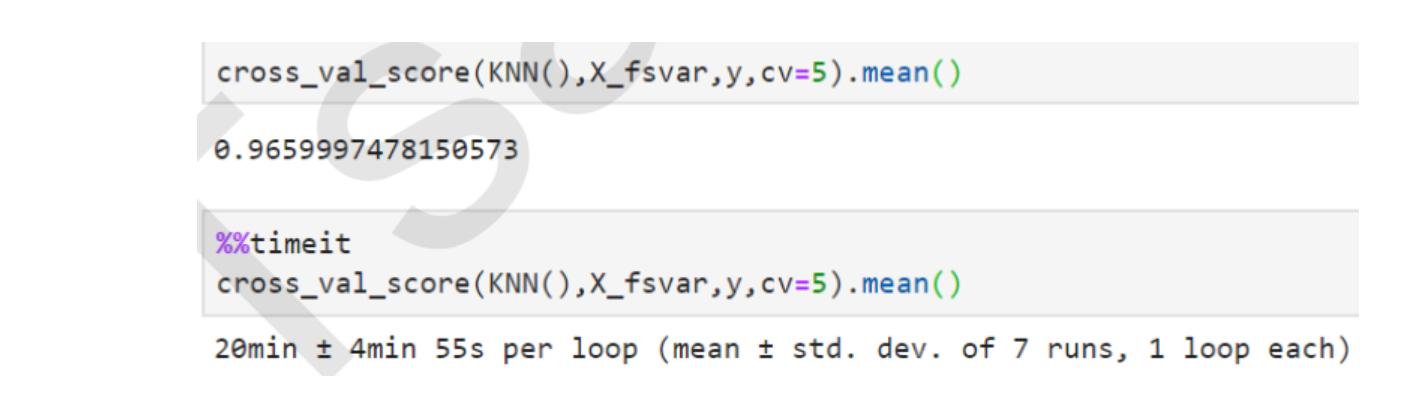
For example, the comparison of the running effect and running time of KNN before and after variance filtering. KNN is a classification algorithm in K-nearest neighbor algorithm. Its principle is very simple. It uses the distance between each sample and other sample points to judge the similarity of each sample point, and then classifies the samples. KNN must traverse each feature and each sample, so the more features, the slower the calculation of KNN. The following is the comparison of code running time.
-
Before variance filtering
It is suggested to save pictures directly from jb73g-47s (if there is an anti-theft mechanism, it is possible to save pictures from jb73g-47s)
)] -
Variance filtered
[the external chain picture transfer fails. The source station may have an anti-theft chain mechanism. It is recommended to save the picture and upload it directly (IMG pulauhv2-1643612347737) (assets)/
8.PNG)] -
It can be seen that for KNN, the effect of filtering is very obvious: the accuracy is slightly improved, but the average running time is reduced by 10 minutes, and the efficiency of the algorithm after feature selection is increased by 1 / 3
-
Note: the main service object of variance filtering is the algorithm model that needs to traverse the characteristics, and the main purpose of filtering is to help the algorithm reduce the computing cost on the premise of maintaining the performance of the algorithm
-
4.4.2 PCA dimensionality reduction (principal component analysis)
-
definition
- PCA dimensionality reduction (principal component analysis): it is a technology to analyze and simplify data sets
-
The dimension value of dimension reduction is the type of feature
-
Idea: how to use two-dimensional representation for a three-dimensional object
[the external chain picture transfer fails. The source station may have an anti-theft chain mechanism. It is recommended to save the picture and upload it directly (img-Y6mqK5jn-1643612347738)(assets)/
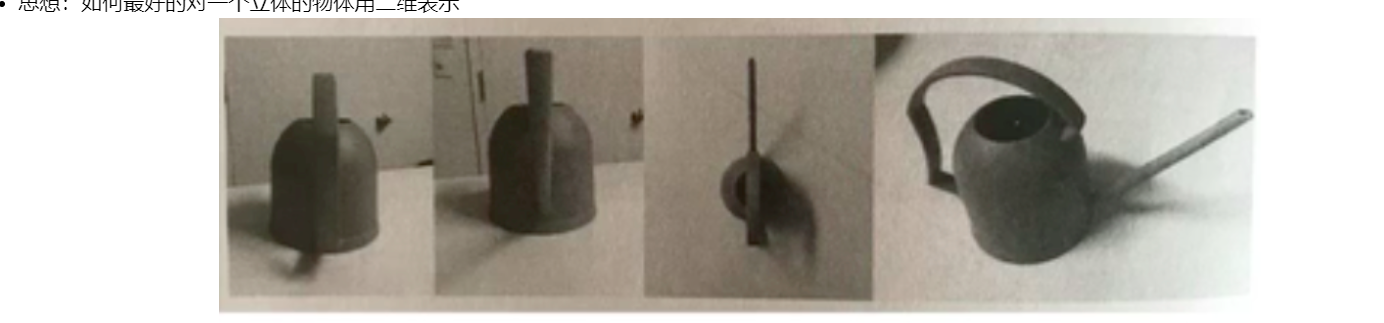
9.PNG)] -
Of course, the fourth two-dimensional picture can better identify a three-dimensional kettle. However, it should also be clear that when using a low latitude to represent a high latitude object, there will be some information differences. It can make the low latitude can correctly represent the high latitude things, or the information difference can be minimized.
-
Objective: when the number of features reaches hundreds or thousands, consider the optimization of data. Compress the data dimension, reduce the dimension (complexity) of the source data as much as possible, and lose a small amount of information.
-
Function: it can reduce the number of features in regression analysis or cluster analysis
-
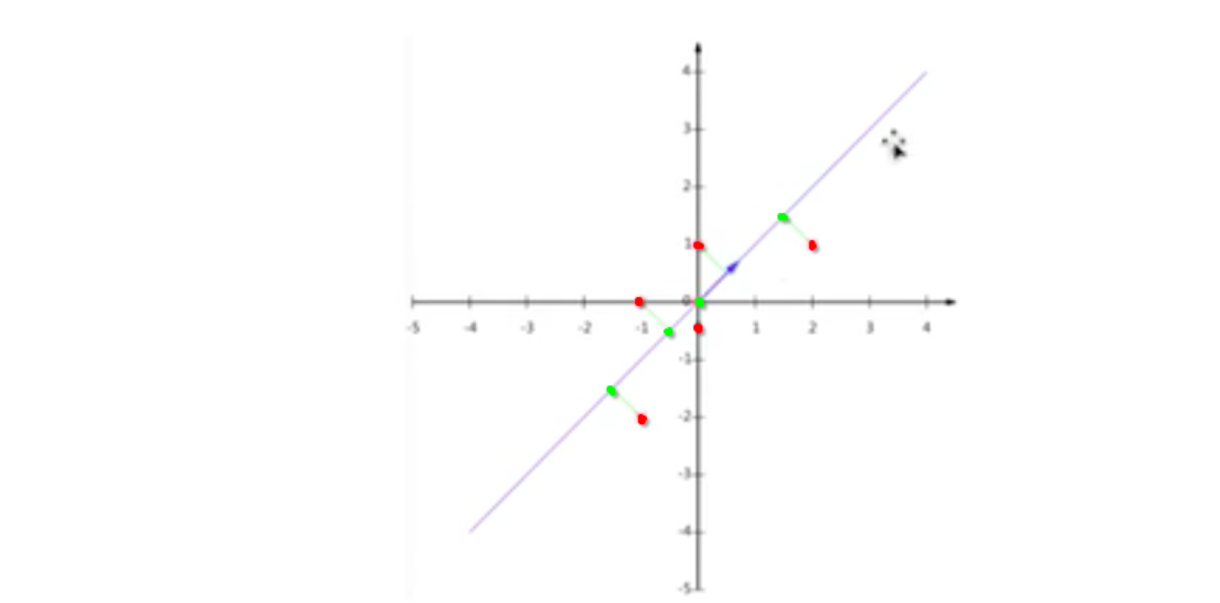
General principle of PCA
[the external chain image transfer fails. The source station may have an anti-theft chain mechanism. It is recommended to save the image and upload it directly (IMG sqlcsfqy-1643612347739) (assets / 1)
0.PNG)] -
Red is the original sample feature and two-dimensional feature. If it is reduced to one-dimensional, five red original features can be mapped to one-dimensional line segments and become four features.
-
PCA syntax
from sklearn.decomposition import PCA
pca=PCA(n_components=None)
# n_components can be decimal (percentage of features retained), integer (number of features reduced)
pca.fit_transform(X)
-
Examples
from sklearn.decomposition import PCA
#Decompose data into lower dimensional spaces
#n_components can be decimal (percentage of reserved features), integer (number of reduced features) [several feature values reserved]
pca=PCA(n_components=2)
pca.fit_transform([[0,2,4,3],[0,3,7,3],[0,9,6,3]])