Recently, I was learning OxyPlot chart control. Some basic learning experiences are recorded here to facilitate future search.
1, Quote
The OxyPlot control can be downloaded directly from the "Nuget" of VS
choice:
Just download the latest version.
Github: https://github.com/oxyplot/
Documentation: https://oxyplot.readthedocs.io/
2, Use
In the front-end interface, we need to add references:
xmlns:oxy="http://oxyplot.org/wpf"
After reference, add the chart's host control PlotView:
1 <Grid>
2     <oxy:PlotView Model="{Binding Model}" />
3 </Grid>
The "Model" is bound to the ViewModel of the back-end. This property is equivalent to the Content property of the ContentControl control.
In the back-end ViewModel, we define the "Model" attribute bound in the front-end interface:
1 private PlotModel model;
2 public PlotModel Model
3 {
4     get { return model; }
5     set { SetProperty(ref model, value); }
6 }
Now we can start "creating"!
3, Add content
Here we will go directly to the code, and the corresponding explanation will be put in the code:
1. Straight line
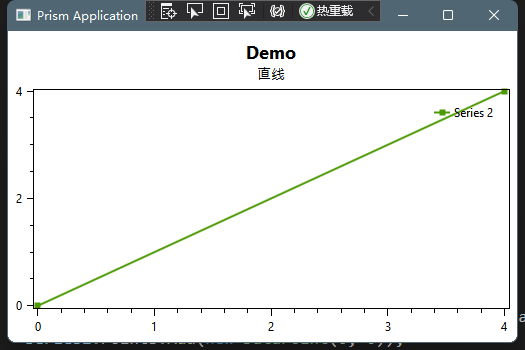
First, let's draw a straight line
 1 Private void GetLine()
 2 {
 3     var tmp = new PlotModel
 4     {
 5         Title = "Demo", //Titile of chart
 6         Subtitle = "straight line" //Description of chart
 7     };
 8     var series2 = new LineSeries
 9     {
10         Title = "Series 2", //Description of line
11         MarkerType = MarkerType.Square //Type and shape of marked points
12     };
13     series2.Points.Add(new DataPoint(0, 0));//Add the coordinates of the first point of the line
14     series2.Points.Add(new DataPoint(4, 4));//Add the coordinates of the second point of the line
15     tmp.Series.Add(series2);//Adds a line to the icon's container
16     this.Model = tmp;//assignment
17 }
Operation results:
2. Curve
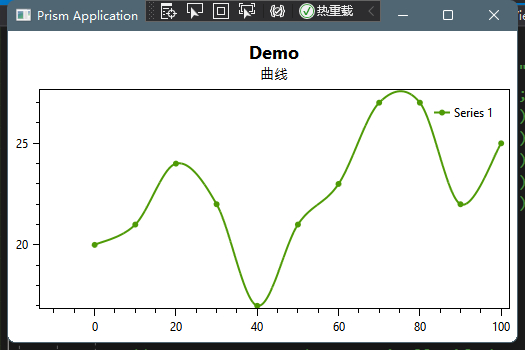
If you know how to draw a straight line, let's see how to draw a smooth curve
 1 Private void GetSpline()
 2 {
 3       var lineSeries1 = new LineSeries { Title = "Series 1", MarkerType = MarkerType.Circle };
 4       //To draw a curve, you need to set the InterpolationAlgorithm property of the line to CanonicalSpline to turn it into a curve
 5       lineSeries1.InterpolationAlgorithm = InterpolationAlgorithms.CanonicalSpline;
 6       lineSeries1.Points.Add(new DataPoint(0, 20));
 7             lineSeries1.Points.Add(new DataPoint(10, 21));
 8             lineSeries1.Points.Add(new DataPoint(20, 24));
 9             lineSeries1.Points.Add(new DataPoint(30, 22));
10             lineSeries1.Points.Add(new DataPoint(40, 17));
11             lineSeries1.Points.Add(new DataPoint(50, 21));
12             lineSeries1.Points.Add(new DataPoint(60, 23));
13             lineSeries1.Points.Add(new DataPoint(70, 27));
14             lineSeries1.Points.Add(new DataPoint(80, 27));
15             lineSeries1.Points.Add(new DataPoint(90, 22));
16             lineSeries1.Points.Add(new DataPoint(100, 25));
17             tmp.Series.Add(lineSeries1);
18             this.Model = tmp;
19 }
3. Filled line
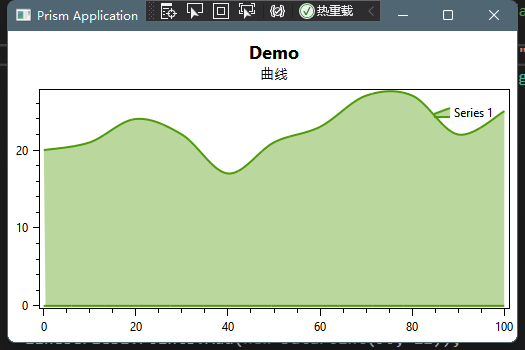
Sometimes there is a need to fill the lines to achieve better visual effects:
Take the above example:
 1 Private void GetSpline()
 2 {
 3       //Fill the line mainly by changing the line type to AreaSeries, but Mark points will not be displayed at this time
 4       var lineSeries1 = new AreaSeries { Title = "Series 1", MarkerType = MarkerType.Circle };
 5
 6       //To draw a curve, you need to set the InterpolationAlgorithm property of the line to CanonicalSpline to turn it into a curve
 7       lineSeries1.InterpolationAlgorithm = InterpolationAlgorithms.CanonicalSpline;
 8       lineSeries1.Points.Add(new DataPoint(0, 20));
 9             lineSeries1.Points.Add(new DataPoint(10, 21));
10             lineSeries1.Points.Add(new DataPoint(20, 24));
11             lineSeries1.Points.Add(new DataPoint(30, 22));
12             lineSeries1.Points.Add(new DataPoint(40, 17));
13             lineSeries1.Points.Add(new DataPoint(50, 21));
14             lineSeries1.Points.Add(new DataPoint(60, 23));
15             lineSeries1.Points.Add(new DataPoint(70, 27));
16             lineSeries1.Points.Add(new DataPoint(80, 27));
17             lineSeries1.Points.Add(new DataPoint(90, 22));
18             lineSeries1.Points.Add(new DataPoint(100, 25));
19             tmp.Series.Add(lineSeries1);
20             this.Model = tmp;
21 }
4. Identification
3. From the filled lines, it can be seen that the identification of the line blocks part of the line, which may lose a lot of data during composition
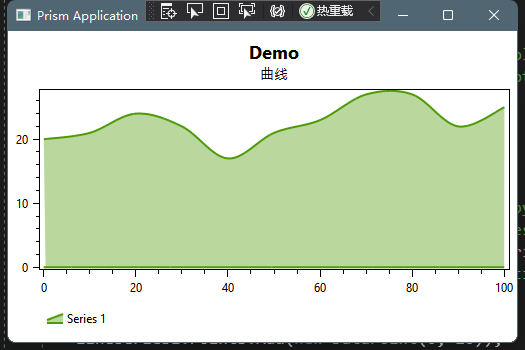
In order to avoid this situation, it is necessary to move the location of the sign
What are you asking about the logo???
This is the logo!!
Take the above example:
 1 var tmp = new PlotModel { Title = "Demo", Subtitle = "curve" };
 2             tmp.LegendBackground = OxyColor.FromArgb(200, 255, 255, 255);//Set background color
 3             tmp.LegendBorder = OxyColors.Transparent;//Set border color
 4             tmp.LegendOrientation = LegendOrientation.Horizontal;//Set the method of identification
 5             tmp.LegendPlacement = LegendPlacement.Outside;//Set whether the relative position of the logo in the icon is inside or outside
 6             tmp.LegendPosition = LegendPosition.BottomLeft;//Set the position of the identification in the whole container. At this time, it is the lower left corner
 7
 8       //Fill the line mainly by changing the line type to AreaSeries, but Mark points will not be displayed at this time
 9       var lineSeries1 = new AreaSeries { Title = "Series 1", MarkerType = MarkerType.Circle };
10       //To draw a curve, you need to set the InterpolationAlgorithm property of the line to CanonicalSpline to turn it into a curve
11       lineSeries1.InterpolationAlgorithm = InterpolationAlgorithms.CanonicalSpline;
12       lineSeries1.Points.Add(new DataPoint(0, 20));
13             lineSeries1.Points.Add(new DataPoint(10, 21));
14             lineSeries1.Points.Add(new DataPoint(20, 24));
15             lineSeries1.Points.Add(new DataPoint(30, 22));
16             lineSeries1.Points.Add(new DataPoint(40, 17));
17             lineSeries1.Points.Add(new DataPoint(50, 21));
18             lineSeries1.Points.Add(new DataPoint(60, 23));
19             lineSeries1.Points.Add(new DataPoint(70, 27));
20             lineSeries1.Points.Add(new DataPoint(80, 27));
21             lineSeries1.Points.Add(new DataPoint(90, 22));
22             lineSeries1.Points.Add(new DataPoint(100, 25));
23             tmp.Series.Add(lineSeries1);
24             this.Model = tmp;
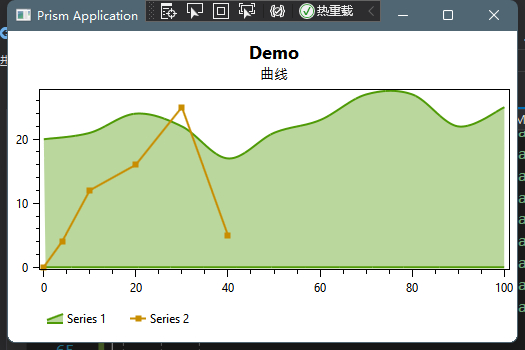
The renderings are as follows:
The following is the case of multiple lines:
 1 var tmp = new PlotModel { Title = "Demo", Subtitle = "curve" };
 2             tmp.LegendBackground = OxyColor.FromArgb(200, 255, 255, 255);//Set background color
 3             tmp.LegendBorder = OxyColors.Transparent;//Set border color
 4             tmp.LegendOrientation = LegendOrientation.Horizontal;//Set the method of identification
 5             tmp.LegendPlacement = LegendPlacement.Outside;//Set whether the relative position of the logo in the icon is inside or outside
 6             tmp.LegendPosition = LegendPosition.BottomLeft;//Set the position of the identification in the whole container. At this time, it is the lower left corner
 7
 8       //line1
 9       //Fill the line mainly by changing the line type to AreaSeries, but Mark points will not be displayed at this time
10       var lineSeries1 = new AreaSeries { Title = "Series 1", MarkerType = MarkerType.Circle };
11       //To draw a curve, you need to set the InterpolationAlgorithm property of the line to CanonicalSpline to turn it into a curve
12       lineSeries1.InterpolationAlgorithm = InterpolationAlgorithms.CanonicalSpline;
13       lineSeries1.Points.Add(new DataPoint(0, 20));
14             lineSeries1.Points.Add(new DataPoint(10, 21));
15             lineSeries1.Points.Add(new DataPoint(20, 24));
16             lineSeries1.Points.Add(new DataPoint(30, 22));
17             lineSeries1.Points.Add(new DataPoint(40, 17));
18             lineSeries1.Points.Add(new DataPoint(50, 21));
19             lineSeries1.Points.Add(new DataPoint(60, 23));
20             lineSeries1.Points.Add(new DataPoint(70, 27));
21             lineSeries1.Points.Add(new DataPoint(80, 27));
22             lineSeries1.Points.Add(new DataPoint(90, 22));
23             lineSeries1.Points.Add(new DataPoint(100, 25));
24             tmp.Series.Add(lineSeries1);
25
26             //Line2
27             var series2 = new LineSeries { Title = "Series 2", MarkerType = MarkerType.Square };
28             series2.Points.Add(new DataPoint(0, 0));
29             series2.Points.Add(new DataPoint(4, 4));
30             series2.Points.Add(new DataPoint(10, 12));
31             series2.Points.Add(new DataPoint(20, 16));
32             series2.Points.Add(new DataPoint(30, 25));
33             series2.Points.Add(new DataPoint(40, 5));
34             tmp.Series.Add(series2);
35
36             this.Model = tmp;
The operation effect is as follows:
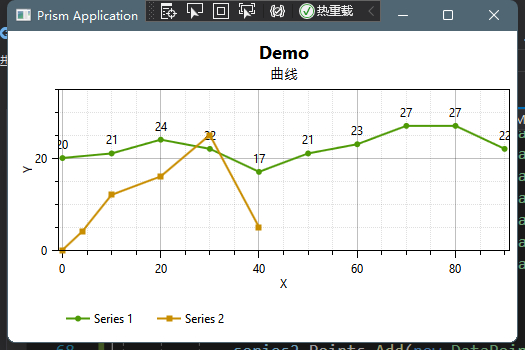
5. Set the coordinate axis, and set the polyline with value display
 1 var tmp = new PlotModel { Title = "Demo", Subtitle = "curve" };
 2             tmp.LegendBackground = OxyColor.FromArgb(200, 255, 255, 255);
 3             tmp.LegendBorder = OxyColors.Transparent;
 4             tmp.LegendOrientation = LegendOrientation.Horizontal;
 5             tmp.LegendPlacement = LegendPlacement.Outside;
 6             tmp.LegendPosition = LegendPosition.BottomLeft;
 7             tmp.LegendSymbolLength = 24;
 8
 9             var linearAxis1 = new LinearAxis();
10             linearAxis1.MajorGridlineStyle = LineStyle.Solid;
11             linearAxis1.MinorGridlineStyle = LineStyle.Dot;
12             linearAxis1.Title = "Y";
13             linearAxis1.Minimum = 0;
14             linearAxis1.Maximum = 35;
15             tmp.Axes.Add(linearAxis1);
16
17             var linearAxis2 = new LinearAxis();
18             linearAxis2.MajorGridlineStyle = LineStyle.Solid;
19             linearAxis2.MinorGridlineStyle = LineStyle.Dot;
20             linearAxis2.Position = AxisPosition.Bottom;
21             linearAxis2.Title = "X";
22             tmp.Axes.Add(linearAxis2);
23
24             var lineSeries1 = new LineSeries { Title = "Series 1", MarkerType = MarkerType.Circle };
25          lineSeries1.LabelFormatString = "{1}";
26             lineSeries1.Points.Add(new DataPoint(0, 20));
27             lineSeries1.Points.Add(new DataPoint(10, 21));
28             lineSeries1.Points.Add(new DataPoint(20, 24));
29             lineSeries1.Points.Add(new DataPoint(30, 22));
30             lineSeries1.Points.Add(new DataPoint(40, 17));
31             lineSeries1.Points.Add(new DataPoint(50, 21));
32             lineSeries1.Points.Add(new DataPoint(60, 23));
33             lineSeries1.Points.Add(new DataPoint(70, 27));
34             lineSeries1.Points.Add(new DataPoint(80, 27));
35             lineSeries1.Points.Add(new DataPoint(90, 22));
36             tmp.Series.Add(lineSeries1);
37
38             var series2 = new LineSeries { Title = "Series 2", MarkerType = MarkerType.Square };
39             series2.Points.Add(new DataPoint(0, 0));
40             series2.Points.Add(new DataPoint(4, 4));
41             series2.Points.Add(new DataPoint(10, 12));
42             series2.Points.Add(new DataPoint(20, 16));
43             series2.Points.Add(new DataPoint(30, 25));
44             series2.Points.Add(new DataPoint(40, 5));
45
46          tmp.Series.Add(series2);
47            this.Model = tmp;
The operation diagram is as follows:
7. Chart export:

That's all for the temporary study. The rest may be updated later.
If there are mistakes, I hope I can get your guidance in time.

