1, Implementation steps
The detailed explanation can be seen from the deep sea of the up main designer of station B "Motionless" . Here I will briefly describe it.
In short, there are three steps:
-
Draw three identical images as like as two peas.
-
Change the colors of the three images in the order of left, middle and right, as shown below.

-
The three images are superimposed in the order of left and right, in which the left image deviates from the middle image by several pixels to the left, and the right image traverses the middle image by several pixels to the right. In this way, the phenomenon of visual illusion can be realized. As shown below.

2, Code implementation
1. Basic framework construction
var backColor =127;

function setup() {
    createCanvas(320,320);
    background(backColor);
}

function draw() {
    translate(width/2,height/2);
    background(backColor);
}
2. Create Graphics class
To sum up, we can know that there are the following attributes in the Graphics class:
- Central coordinates
- colour
- The size of a hollowed out circle (a circle with a boundary but no filling)
- Length of equilateral triangle
There are several methods in the Graphics class:
- Drawing graphics
- Change color
Therefore, the creation of Graphics class is as follows.
function Graphics(tempX,tempY) {
    // Central coordinates
    this.x = tempX;
    this.y = tempY;

	// The side length from the center of the triangle to each vertex
    this.l = 50;

    // Circular radius size
    this.r = 100;

    // Set color, range (0 ~ 255)
    this.black = 255;

    // Draw triangles through self built classes
    this.triangle = new Triangle(tempX,tempY,this.l);

    // Define drawing methods
    this.display = function() {
        push();
        stroke(this.black);
        strokeWeight(50); // Sets the thickness of the circular line
        fill(this.black,0); // Make the circle fill completely transparent
        ellipse(this.x,this.y,this.r*2,this.r*2);
        pop();

        this.triangle.display(this.black);
    }

    // Define how to change color
    this.changeColor = function(tempC){
    	this.black = tempC;
    }
}

// Self built rounded triangle class
function Triangle(tempX,tempY,tempL) {
    this.x = tempX;
    this.y = tempY;
    this.l = tempL;

    this.display = function(tempC){
        push();

        fill(tempC);
        strokeJoin(ROUND); // Make a smooth transition at the connection
        strokeWeight(10);
        stroke(tempC);

        // Draw equilateral rounded triangles with custom shapes
        beginShape();
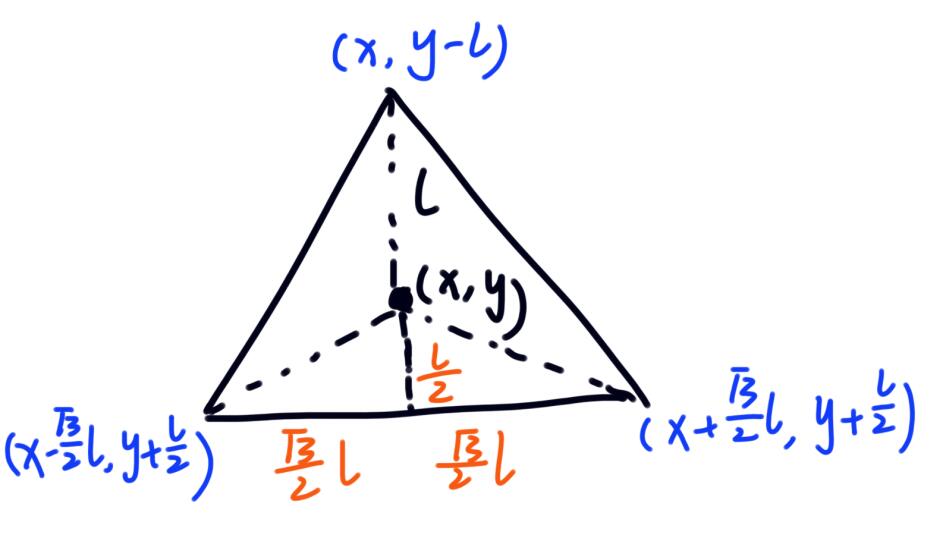
        vertex(this.x,this.y-this.l);
        vertex(this.x+sqrt(3)*this.l/2,this.y+this.l/2);
        vertex(this.x-sqrt(3)*this.l/2,this.y+this.l/2);
        endShape(CLOSE);

        pop();
    }
}
The coordinates of the three points of an equilateral triangle are calculated as follows. Since the positive direction of the y axis of p5js is opposite to that of the normal coordinate system, attention should be paid to the calculation.

The declaration of the Graphics class is as follows. I take the second figure as the center figure, and the other two figures take it as the center, offset left and right by three pixels.
var graphics = [];
function setup() {
	...

	// Create composite drawings
    graphics[0] = new Graphics(0,-3);
    graphics[1] = new Graphics(0,0);
    graphics[2] = new Graphics(0,3);
}
3. Set the gray value change mechanism
I take the modulus of a certain number of cumulative frames as a variable and work with the sinusoidal function to realize the cyclic change of gray value. There are two map maps, which are
-
map(count,0,changeRate-1,0,TWO_PI)+0/0.25*PI/0.5*PI
-
map(sin(x),-1,1,0,255)
The first mapping is to change the value of the accumulated frame number from [0, changerate-1] = > [0,2] π \pi π] , in order to realize the periodic change of sinusoidal function, the 0/0.25*PI/0.5*PI added later is to realize the different values of three graphs at the same time. The second map map is to convert the sine value from [- 1, 1] = > [0255] to realize the conversion between sine value and gray value.
After that, the visual illusion effect can be realized by displaying the combined graphics in the left and right order.
Some codes are shown below.
function draw() {
    ...
    var changeRate = 20;
    var count = frameCount % changeRate;
    var angle = PI / 2;

    push();
    angleMode(RADIANS);
    // Rotate an angle
    rotate(angle);

    var c = map(sin(map(count,0,changeRate-1,0,TWO_PI)+0.5*PI),-1,1,0,255);
    graphics[2].changeColor(c);
    graphics[2].display();

    c = map(sin(map(count,0,changeRate-1,0,TWO_PI)),-1,1,0,255);
    graphics[0].changeColor(c);
    graphics[0].display();

    c = map(sin(map(count,0,changeRate-1,0,TWO_PI)+1/2*0.5*PI),-1,1,0,255);
    graphics[1].changeColor(c);
    graphics[1].display();

    pop();
}
4. Simple improvements
We have realized the optical illusion in one direction, and then we can change it to either direction. Therefore, we control the "motion direction" of visual illusion through the position of the mouse.
First, define a function to calculate the angle between a vector and the y-axis. At the initial time, the orientation of the triangle is upward, so its direction vector is [0, - 1] (in p5js, downward is the positive direction). The definition code is shown below. because a r c c o s ( x ) ∈ [ 0 , π ] arccos(x)\in[0,\pi] arccos(x) ∈ [0, π], so it is necessary to further process the calculated angle to make a r c c o s ( x ) ∈ [ − π , π ] arccos(x)\in[-\pi,\pi] arccos(x)∈[−π,π].
function calAngle(x,y) {
    var angle = acos(y/sqrt(x*x+y*y));

    if (x < 0){
        angle = -angle;
    }else {
        angle = angle;
    }
    return angle;
}
In the draw code, replace the original angle declaration and definition code with the following code to realize the "movement" of the image towards the position of the mouse. Achieve the effect, such as station B video [processing] reverse Phi illumination As shown in.
var angle = calAngle(mouseX-width/2,height/2-mouseY);
// var angle = PI / 2;