Using pie chart to display data is a very common method of data display. We can see the proportion of data intuitively through it. It is very convenient for comparison and analysis of some data.
Recently, when using echarts plug-in to make pie charts, we have encountered some problems, that is, when there are many kinds of data, the legend will break the picture or cover the pie charts, which will cause the layout of the picture to be disrupted, and the experience is very poor.
Finally, combined with a series of data search, a simple and clear method of legend paging is summarized. As follows:
html: (Legend Paging Button)
<div id="legend_page" style="width:300px;height:20px;left:223px;top:190px;border:0px solid;position:absolute;display:none;">
     	<span class="glyphicon glyphicon-step-backward" style="color:#334B5C;" id="preIcon"></span>
     	<span id="page_text"></span>
     	<span class="glyphicon glyphicon-step-forward" style="color:#D53A35;" id="nextIcon"></span>
</div>
<div id="pie_legend_page" style="width:300px;height:20px;left:522px;top:190px;border:0px solid;position:absolute;display:none;">
     	<span class="glyphicon glyphicon-step-backward" style="color:#334B5C;" id="preBtn"></span>
     	<span id="pie_page_text"></span>
     	<span class="glyphicon glyphicon-step-forward" style="color:#D53A35;" id="nextBtn"></span>
</div>
js: (Paging method)
//Legend Paging Display Function
function setLegendPagination(totalLegendData,pageNumber,chart,pieNum) {
    var total = totalLegendData.length;
    if(total>7){
    	$("#legend_page").show();
    	$("#pie_legend_page").show();
    }else{//Not shown when legend is less than 7
    	$("#legend_page").hide();
    	$("#pie_legend_page").hide();
    }
    var totalPage = Math.ceil(total / 7); //PageCount
    if (pageNumber <= totalPage && pageNumber > 0) {//Ensure that the number of pages is within the valid range
        var legendData = [];
        var skip = parseInt((pageNumber - 1)) * 7;
        for (var i = skip; i < skip + 7; ++i) {
            legendData[i - skip] = totalLegendData[i];
        }
        if(pieNum==1){//Judge which figure it is
        	$("#Page_text". HTML (pageNumber +'/'+ total Page); //Paging icon in the middle of the display content, such as 1/7, represents the current page and the total number of pages
        }else{
        	$("#pie_page_text").html(pageNumber + '/' + totalPage);
        }
        chart.setOption({
            legend: {
                data: legendData
            }
        })
    }
}//Legend Initialization Function (optional time pie chart)
function setPage(arr,chart){
var pageNumber=1;
$("#preIcon").click(function(){
pageNumber--;
setLegendPagination(arr,pageNumber,chart,1);
});
$("#nextIcon").click(function(){
pageNumber++;
setLegendPagination(arr,pageNumber,chart,1);
});
setLegendPagination(arr,pageNumber,chart,1);
}
//Legend initialization function (non-optional time pie chart)
function setPiePage(arr,chart){
var pageNumber=1;
$("#preBtn").click(function(){
pageNumber--;
setLegendPagination(arr,pageNumber,chart,2);
});
$("#nextBtn").click(function(){
pageNumber++;
setLegendPagination(arr,pageNumber,chart,2);
});
setLegendPagination(arr,pageNumber,chart,2);
}The above function is used to initialize the graphics and paginate the legend when the button is clicked.
              		   var arr = [];
                  	   var value = [];
                  	   for(var i=0;i<result.length;i++){
                  		   arr.push(result[i]["parent_a_name"]);
                  	   }

                  	   for(var i=0;i<result.length;i++){
                  		   value.push({value:result[i]["h_total_energy"],name:result[i]["parent_a_name"]});

                  	   }

                  	 pieChart.setOption({        //Load data charts
                         series: [{

                             data: value
                         }]
                     });
                  	setPiePage(arr,pieChart);
The above code calls the method directly in the area where the result of AJAX is successfully returned, so that the graphics parameters can be initialized after the data is requested by ajax, and the legends can be paginated and displayed.
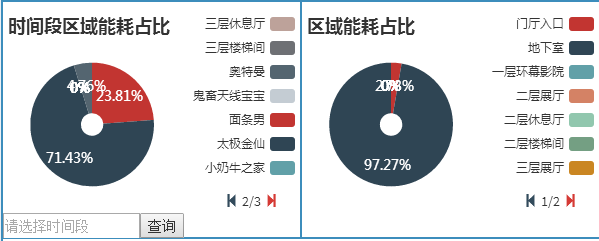
The results are as follows: