1. Pre competition preparation
1.1 Preface
Sponsored by open source learning organization Datawhale, this event mainly leads learners to use Python for data analysis and data visualization, including four parts: data set processing, data exploration and clarity, data analysis and data visualization, using pandas, matplotlib Third party libraries such as wordcloud take you to play with data analysis ~ there are rich gifts waiting for you to pick up ~ learning event address: https://tianchi.aliyun.com/competition/entrance/531837/introduction
1.2 introduction to data set sources
All candidate information this document provides a record for each candidate and shows the candidate's information, total income, transfers received from the authorization Committee, total payments, transfers to the authorization Committee, total cash on hand, loans and liabilities, and other financial summary information. Detailed description of data field: https://www.fec.gov/campaign-finance-data/all-candidates-file-description/ Key field description
CAND_ID candidate ID CAND_NAME candidate name CAND_PTY_AFFILIATION candidate party
Data source: https://www.fec.gov/files/bulk-downloads/2020/weball20.zip
The candidate Committee links information to the candidate's ID number, the election year of the candidate, the election year of the Federal Election Commission, the committee's identification number, the type of the committee, the name of the Committee and the link identification number. Detailed information description: https://www.fec.gov/campaign-finance-data/candidate-committee-linkage-file-description/ Key field description
CAND_ID candidate ID CAND_ELECTION_YR candidate election year CMTE_ID Committee ID
Data source: https://www.fec.gov/files/bulk-downloads/2020/ccl20.zip
Personal donation file information [note] due to the large file, this data set only contains relevant data from July 22, 2020 to August 20, 2020. If more complete data is needed, it can be downloaded through the address in the data source. The document contains information about the committee that received the contribution, the report on the disclosure of the contribution, the individual who made the contribution, the date of the contribution, the amount and other information about the contribution. Detailed information description: https://www.fec.gov/campaign-finance-data/contributions-individuals-file-description/ Key field description
CMTE_ID Committee ID
NAME donor NAME
CITY donor CITY
State of donor
Employee donor EMPLOYER / company
OCCUPATION of donor
Data source: https://www.fec.gov/files/bulk-downloads/2020/indiv20.zip
2. Data analysis
Before data processing, we need to know what kind of data we finally want. Because we want to analyze the relationship between candidates and donors, we want a data table with one-to-one correspondence between donors and candidates. Therefore, we need to correlate the current three data tables one by one and summarize them into the required data.
import pandas as pd
import numpy as np
import matplotlib.pyplot as plt
%matplotlib inline
#Read candidate information data
candidates = pd.read_csv("weball20.txt", sep = '|',names=['CAND_ID','CAND_NAME','CAND_ICI','PTY_CD','CAND_PTY_AFFILIATION','TTL_RECEIPTS',
                                                          'TRANS_FROM_AUTH','TTL_DISB','TRANS_TO_AUTH','COH_BOP','COH_COP','CAND_CONTRIB',
                                                          'CAND_LOANS','OTHER_LOANS','CAND_LOAN_REPAY','OTHER_LOAN_REPAY','DEBTS_OWED_BY',
                                                          'TTL_INDIV_CONTRIB','CAND_OFFICE_ST','CAND_OFFICE_DISTRICT','SPEC_ELECTION','PRIM_ELECTION','RUN_ELECTION'
                                                          ,'GEN_ELECTION','GEN_ELECTION_PRECENT','OTHER_POL_CMTE_CONTRIB','POL_PTY_CONTRIB',
                                                          'CVG_END_DT','INDIV_REFUNDS','CMTE_REFUNDS'],)
candidates
#Read the contact information of the candidate and the Committee
cll=pd.read_csv("ccl.txt", sep = '|',names=['CAND_ID','CAND_ELECTION_YR','FEC_ELECTION_YR','CMTE_ID','CMTE_TP','CMTE_DSGN','LINKAGE_ID'])

#Link candidates to candidate committees
ccl=pd.merge(cll,candidates,)

#Extract required columns
cll=pd.DataFrame(ccl, columns=[ 'CMTE_ID','CAND_ID', 'CAND_NAME','CAND_PTY_AFFILIATION'])

#Match candidates and donors one by one through CMTE_ID associates two tables
#Through CMTE-ID, the currently processed relationship table between the candidate and the committee is associated with the personnel donation file to obtain the one-to-one correspondence contact table cil between the candidate and the donor.

# Read personal donation data. Since the original data has no header, you need to add a header
# Tip: it takes about 5-10s to read this file
itcont = pd.read_csv('itcont_2020_20200722_20200820.txt', sep='|',names=['CMTE_ID','AMNDT_IND','RPT_TP','TRANSACTION_PGI',
                                                                                  'IMAGE_NUM','TRANSACTION_TP','ENTITY_TP','NAME','CITY',
                                                                                  'STATE','ZIP_CODE','EMPLOYER','OCCUPATION','TRANSACTION_DT',
                                                                                  'TRANSACTION_AMT','OTHER_ID','TRAN_ID','FILE_NUM','MEMO_CD',
                                                                                  'MEMO_TEXT','SUB_ID'])

# Merge the candidate Committee relationship table ccl and individual donation data table itcont through CMTE_ID
cil=pd.merge(cll,itcont)
# Extract the required data column
c_itcont = pd.DataFrame(cil, columns=[ 'CAND_NAME','NAME', 'STATE','EMPLOYER','OCCUPATION',
                                           'TRANSACTION_AMT', 'TRANSACTION_DT','CAND_PTY_AFFILIATION'])
c_itcont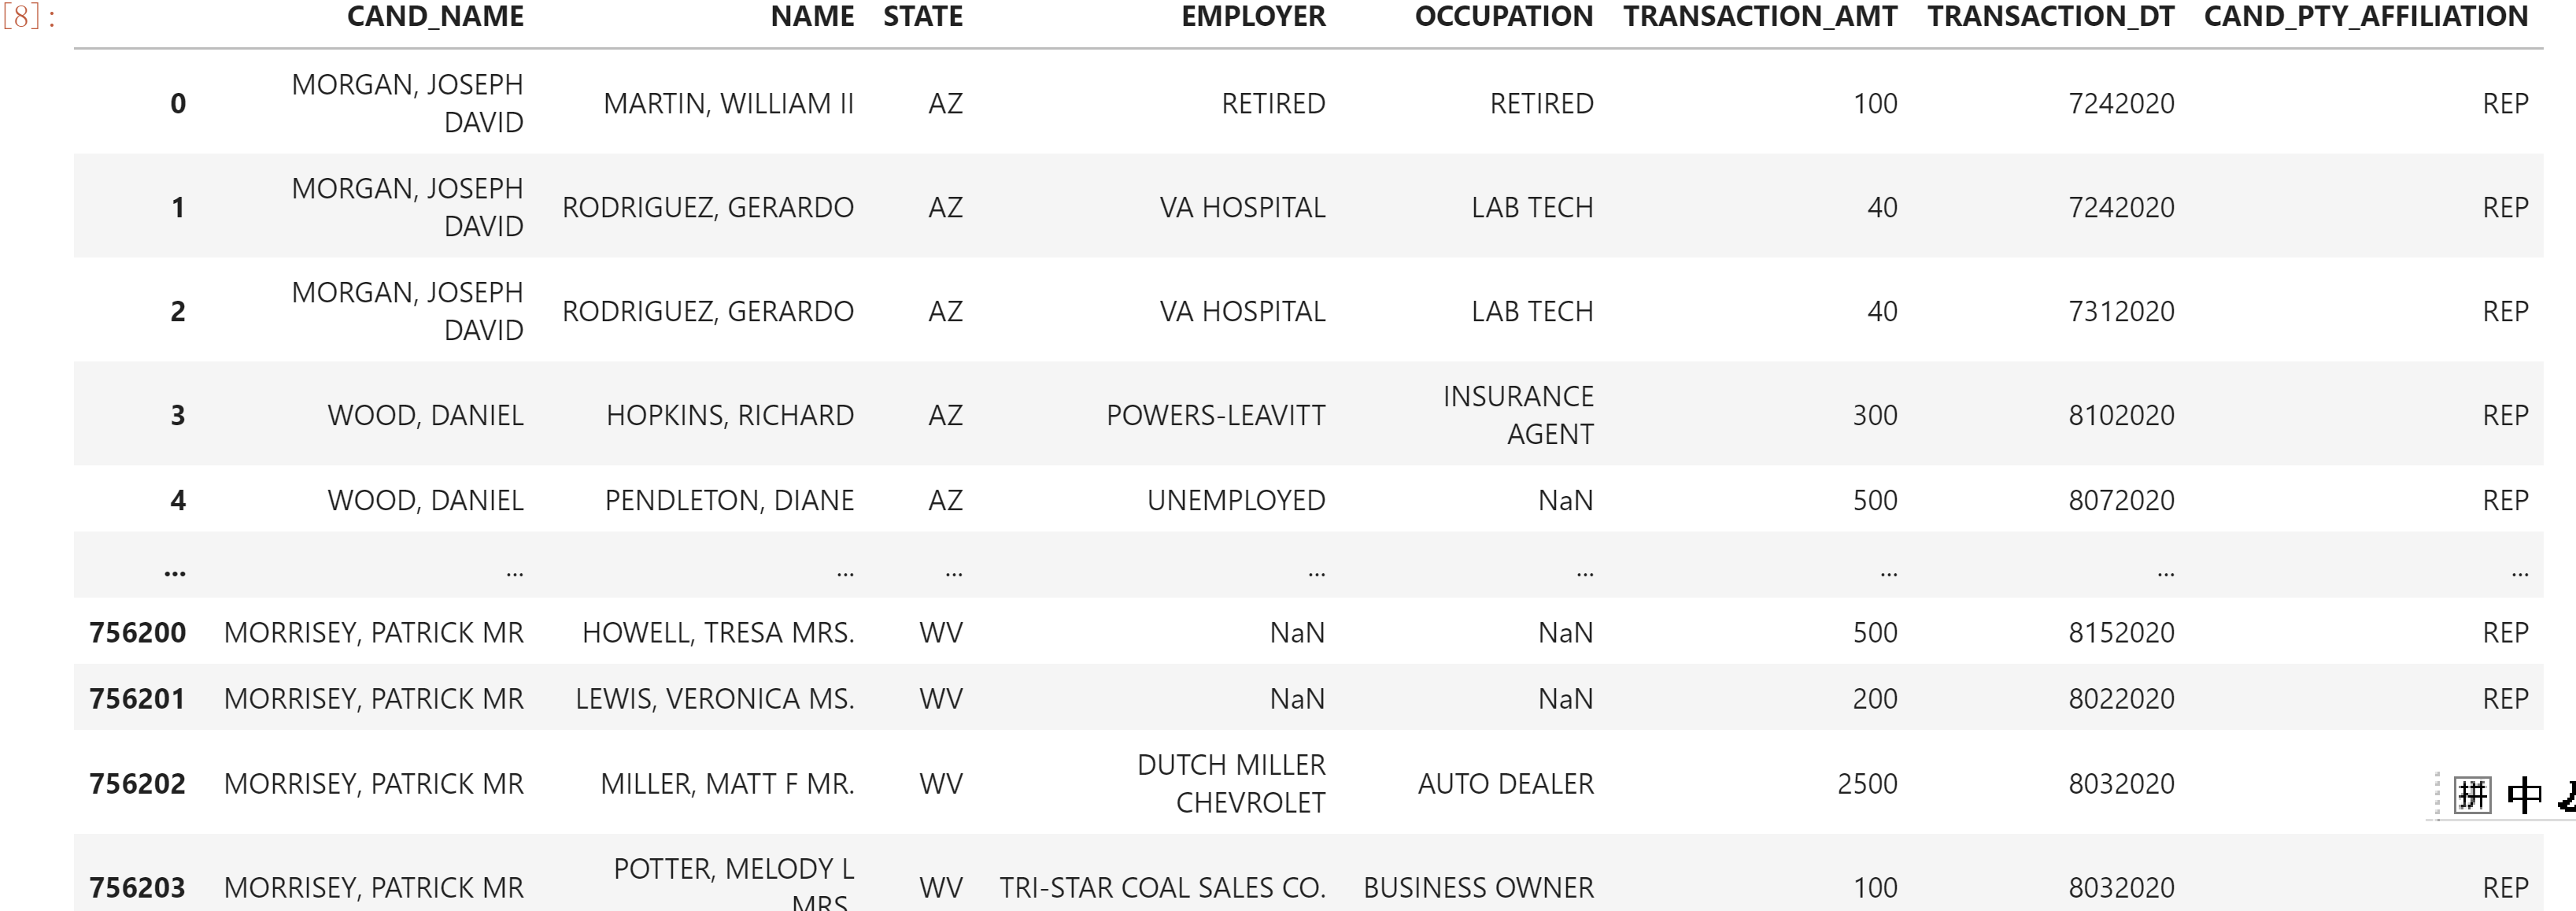
#Data description CAND_NAME – name of the candidate receiving the donation
NAME – donor NAME
STATE – donor STATE
Employee – the company of the donor
OCCUPATION – donor OCCUPATION
TRANSACTION_AMT – donation amount (USD)
TRANSACTION_DT – date of receipt of donation
CAND_PTY_AFFILIATION – candidate party
3. Data cleaning
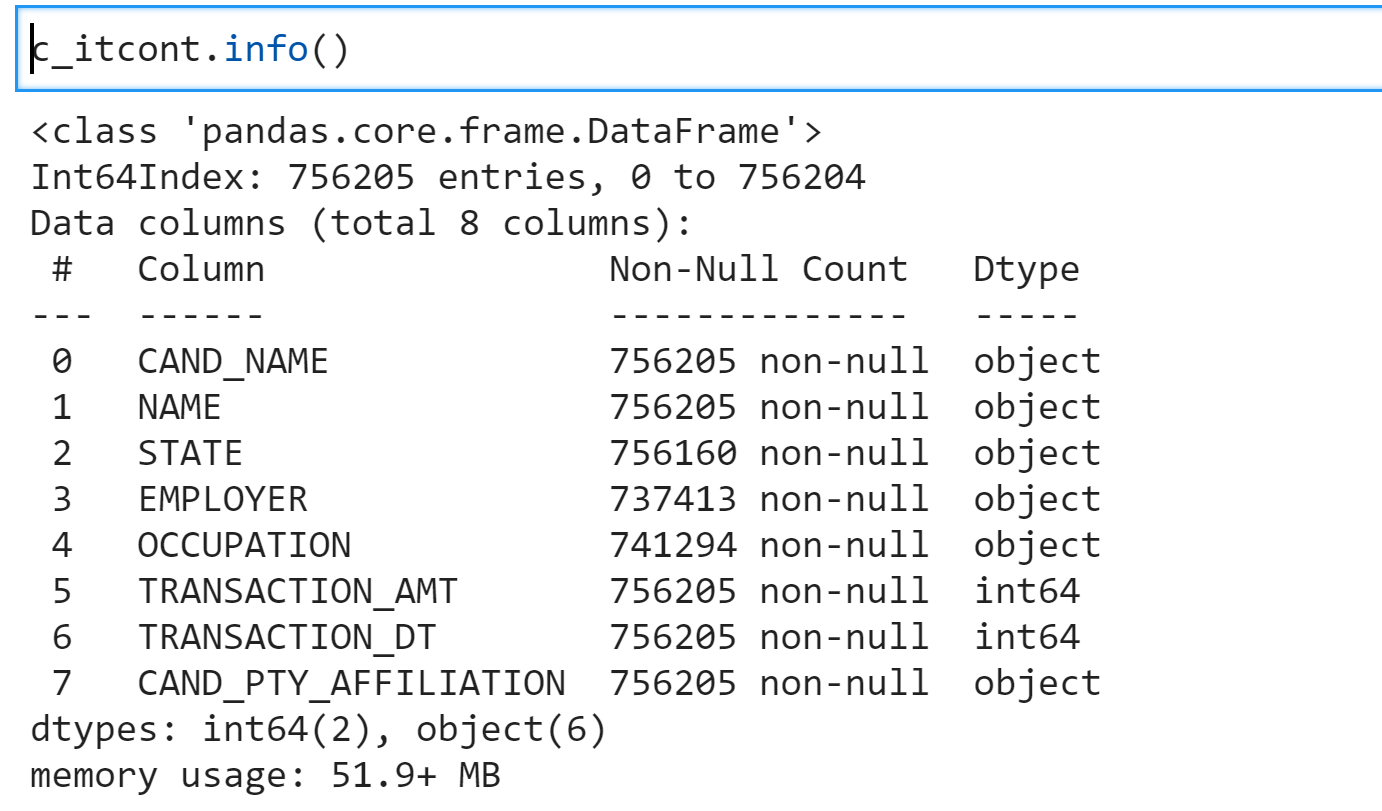
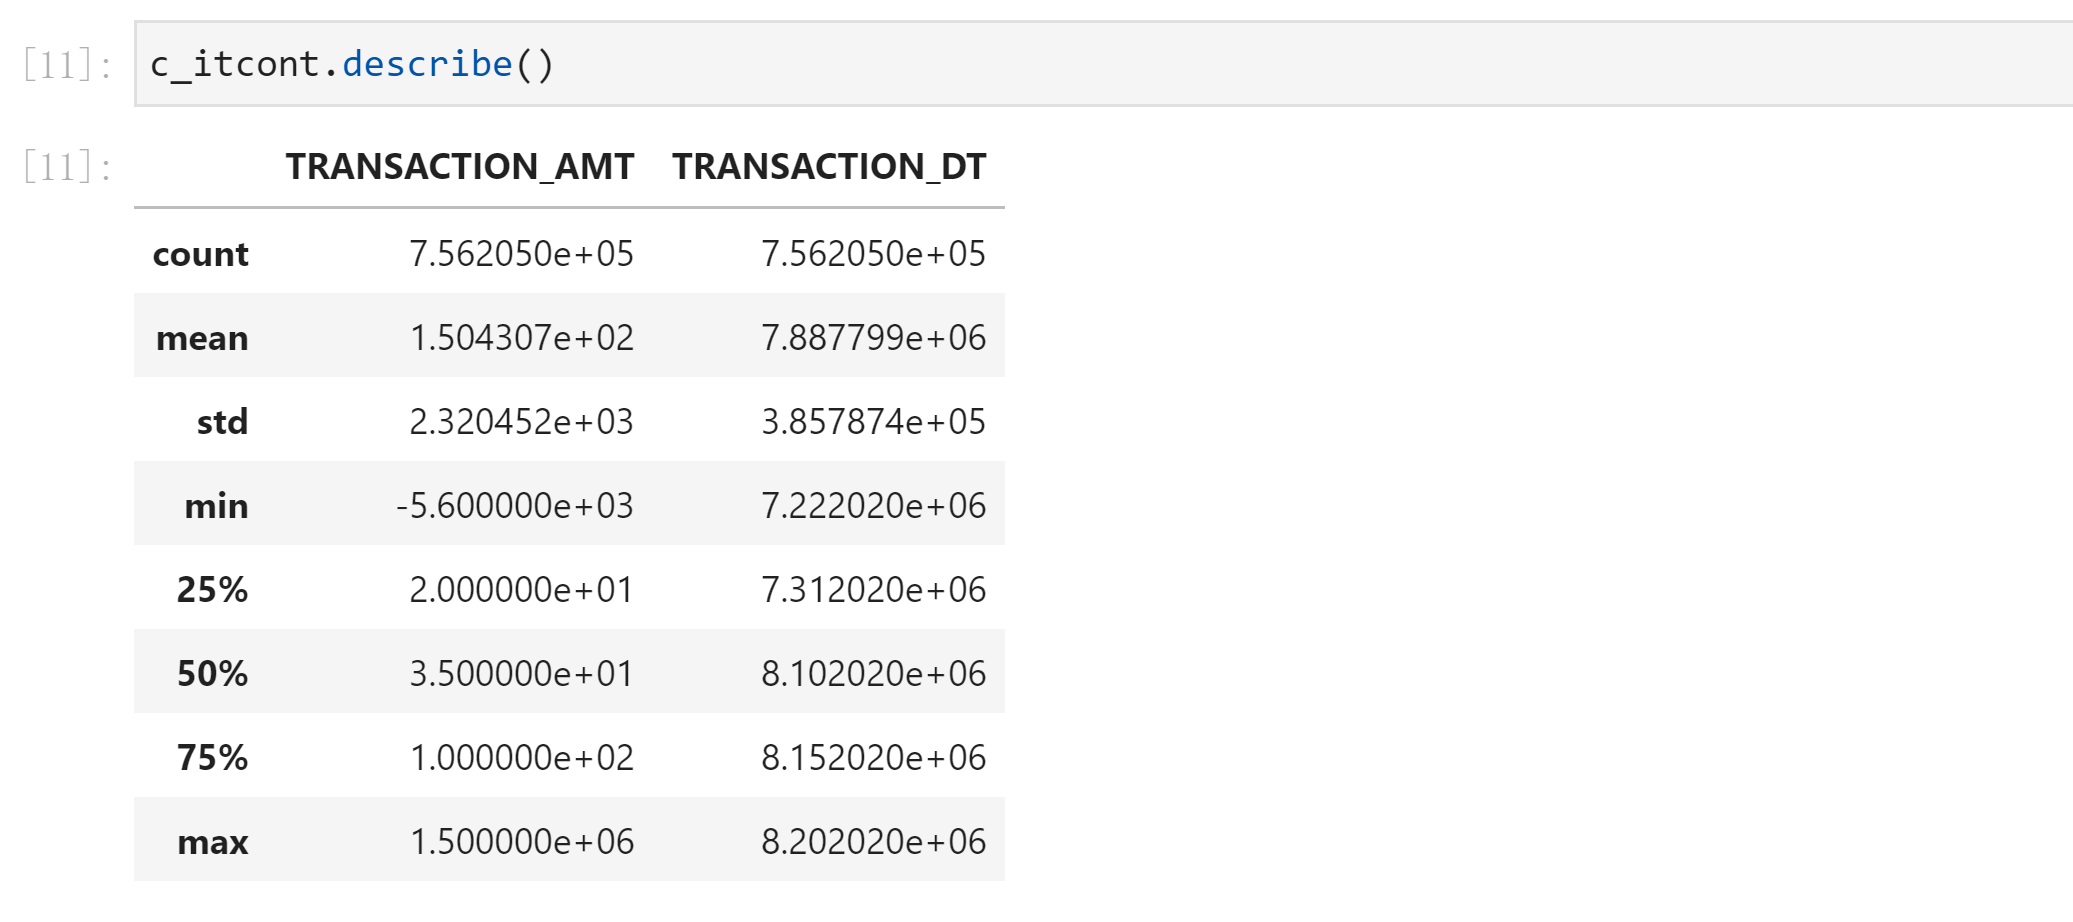
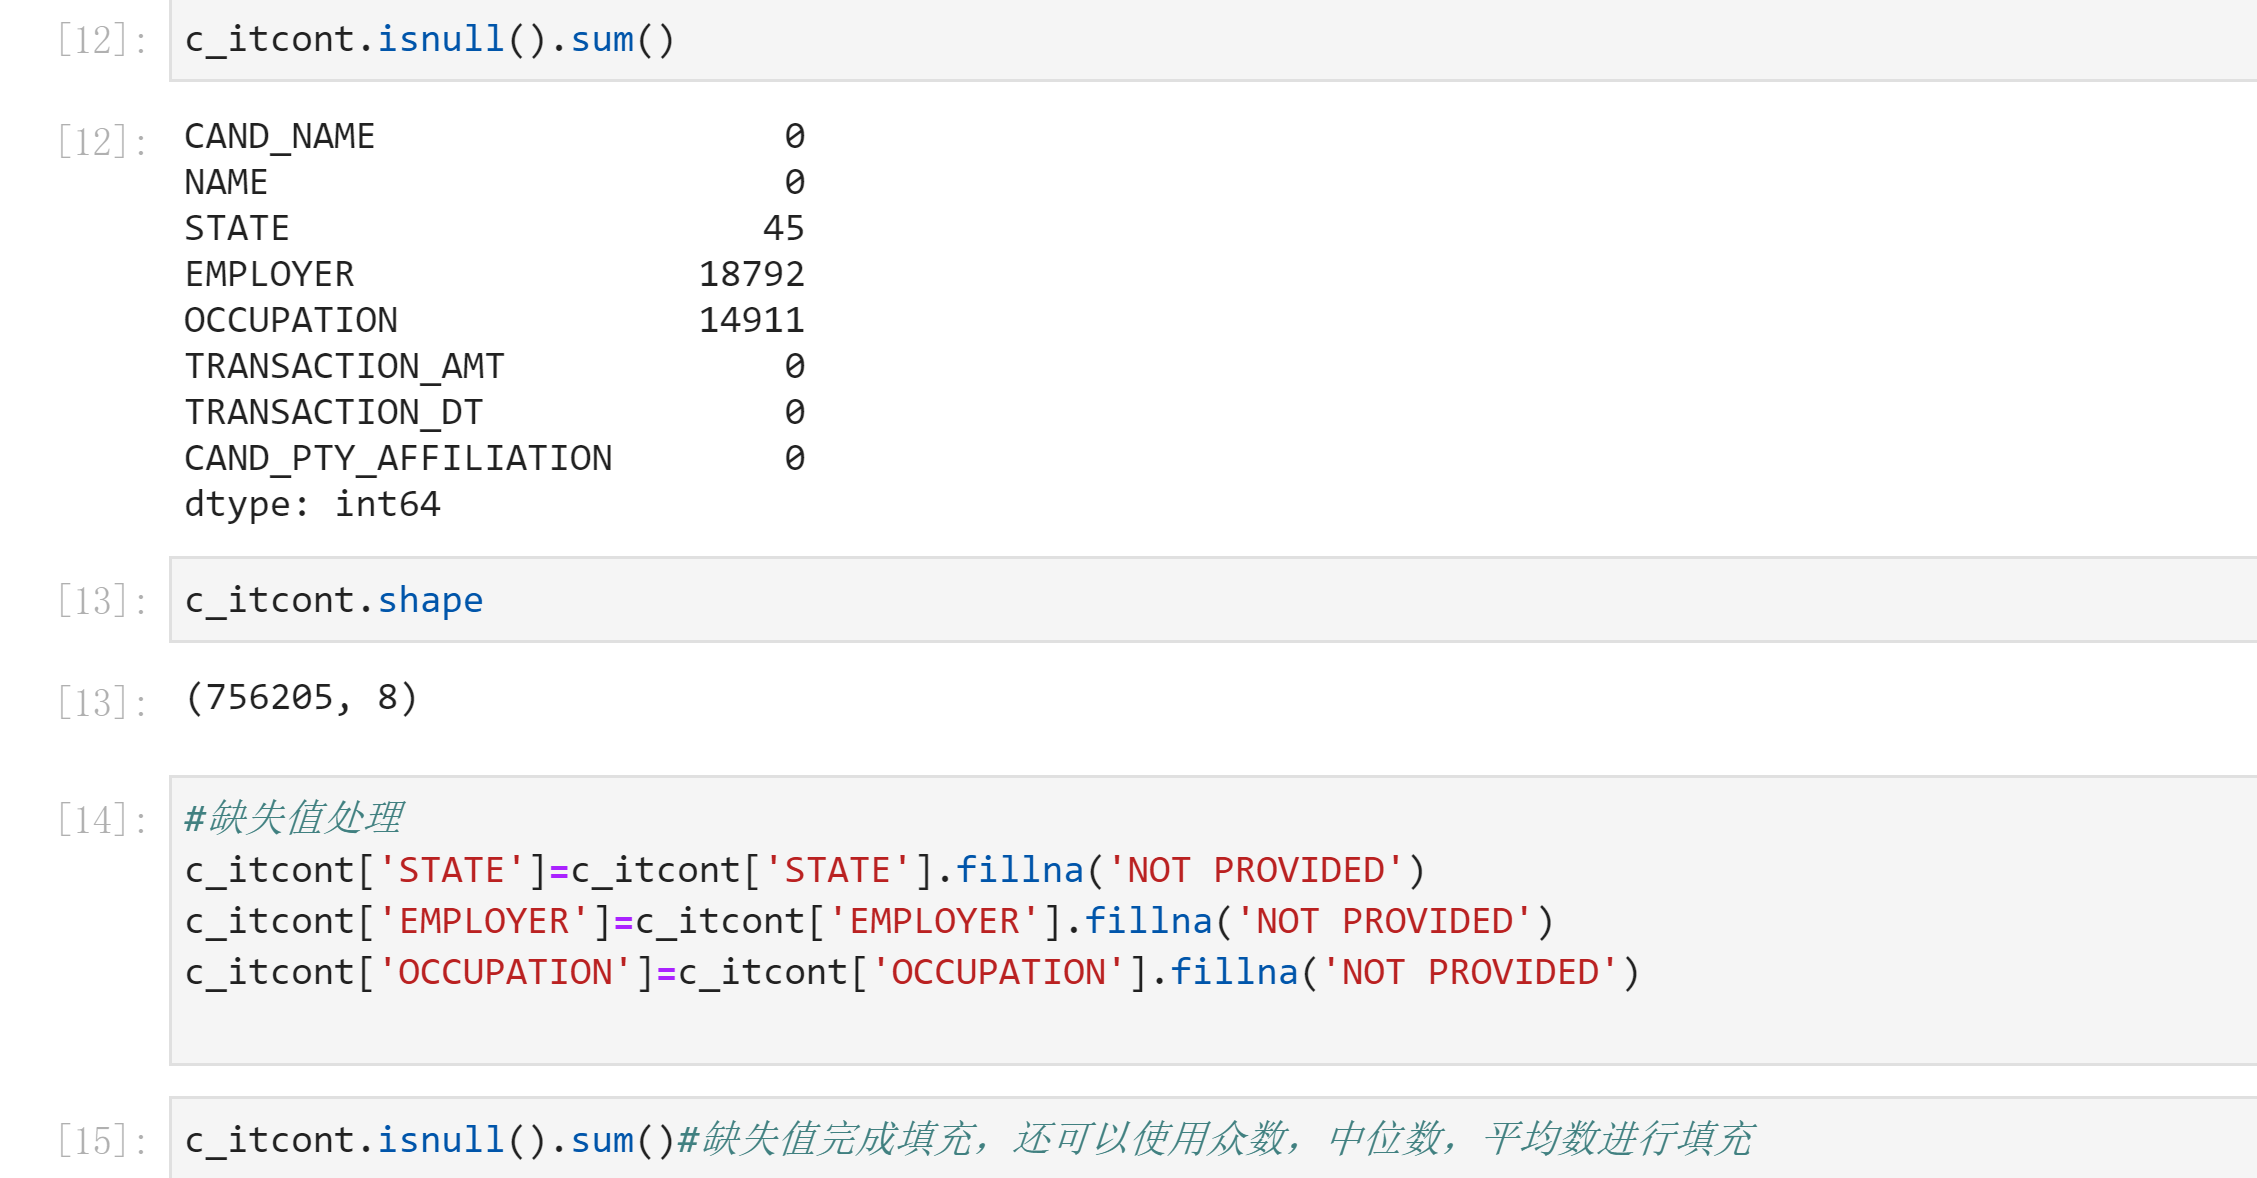
# Transaction on date_ DT column for processing
c_itcont['TRANSACTION_DT']
def date_time(x):
    x=str(x)
    x=x[3:7]+x[0:3]
    return x
#Change the number to the normal date

c_itcont['TRANSACTION_DT']=c_itcont['TRANSACTION_DT'].apply(date_time)

#Analyze the data again
c_itcont.info()

#For a single column, describe analysis can be carried out - Classification variables
c_itcont['CAND_NAME'].describe()
count 756205 unique 312 top BIDEN, JOSEPH R JR freq 507816 Name: CAND_NAME, dtype: object
4. Data analysis
#Calculate the total amount of donations received by each party, and then sort to the top ten
c_itcont.groupby('CAND_PTY_AFFILIATION').sum()['TRANSACTION_AMT'].sort_values(ascending=False)[:10]

# Calculate the total amount of donations received by each presidential candidate, and then sort it to the top ten
c_itcont.groupby('CAND_NAME').sum()['TRANSACTION_AMT'].sort_values(ascending=False)[:10]

CAND_NAME
BIDEN, JOSEPH R JR                  68111142
TRUMP, DONALD J.                    16594982
SULLIVAN, DAN                        9912465
JACOBS, CHRISTOPHER L.               6939209
BLOOMBERG, MICHAEL R.                3451916
MARKEY, EDWARD J. SEN.                606832
SHAHEEN, JEANNE                       505446
KENNEDY, JOSEPH P III                 467738
CORNYN, JOHN SEN                      345959
FIGLESTHALER, WILLIAM MATTHEW MD      258221
Name: TRANSACTION_AMT, dtype: int64
The parties receiving the most donations are DEM (Democratic Party) and rep (Republican Party), which correspond to Biden, Joseph r Jr (Biden) and TRUMP, DONALD J. (trump) respectively. From the data of July 22, 2020 to August 20, 2020 we currently analyze, in the donation data of voters, the Democratic Party represented by Biden completely wins the Republican Party represented by trump. Due to the large amount of complete data, Therefore, there is no summary and analysis of all the data, so it is uncertain that Biden will be elected if the result of the November election is announced
# Check the total amount of donations from people of different occupations, and then sort to get the top ten
c_itcont.groupby('OCCUPATION').sum()['TRANSACTION_AMT'].sort_values(ascending=False)[:10]


c_itcont["OCCUPATION"].value_counts()[:10]


NOT EMPLOYED    224109
RETIRED         151834
ATTORNEY         19666
NOT PROVIDED     14912
PHYSICIAN        14033
CONSULTANT        8333
PROFESSOR         8022
TEACHER           8013
ENGINEER          7922
SALES             6435
Name: OCCUPATION, dtype: int64
From the perspective of the donor's occupation, we will find that the total donation amount of not employed (freelance) is the largest. By looking at the number of donations from each occupation, we will find that it is because there are many not employed (freelance) and there are also a large number of retirees, so the total donation amount corresponds to a large number, such as lawyers, founders Doctors, consultants, professors and supervisors, although the total number of donations is small, the total amount of donations also accounts for a large proportion.
# The total amount of donations received by each state is then ranked in the top five
c_itcont.groupby('STATE').sum()['TRANSACTION_AMT'].sort_values(ascending=False)

c_itcont.groupby('STATE').sum().sort_values('TRANSACTION_AMT',ascending=False).head(5)

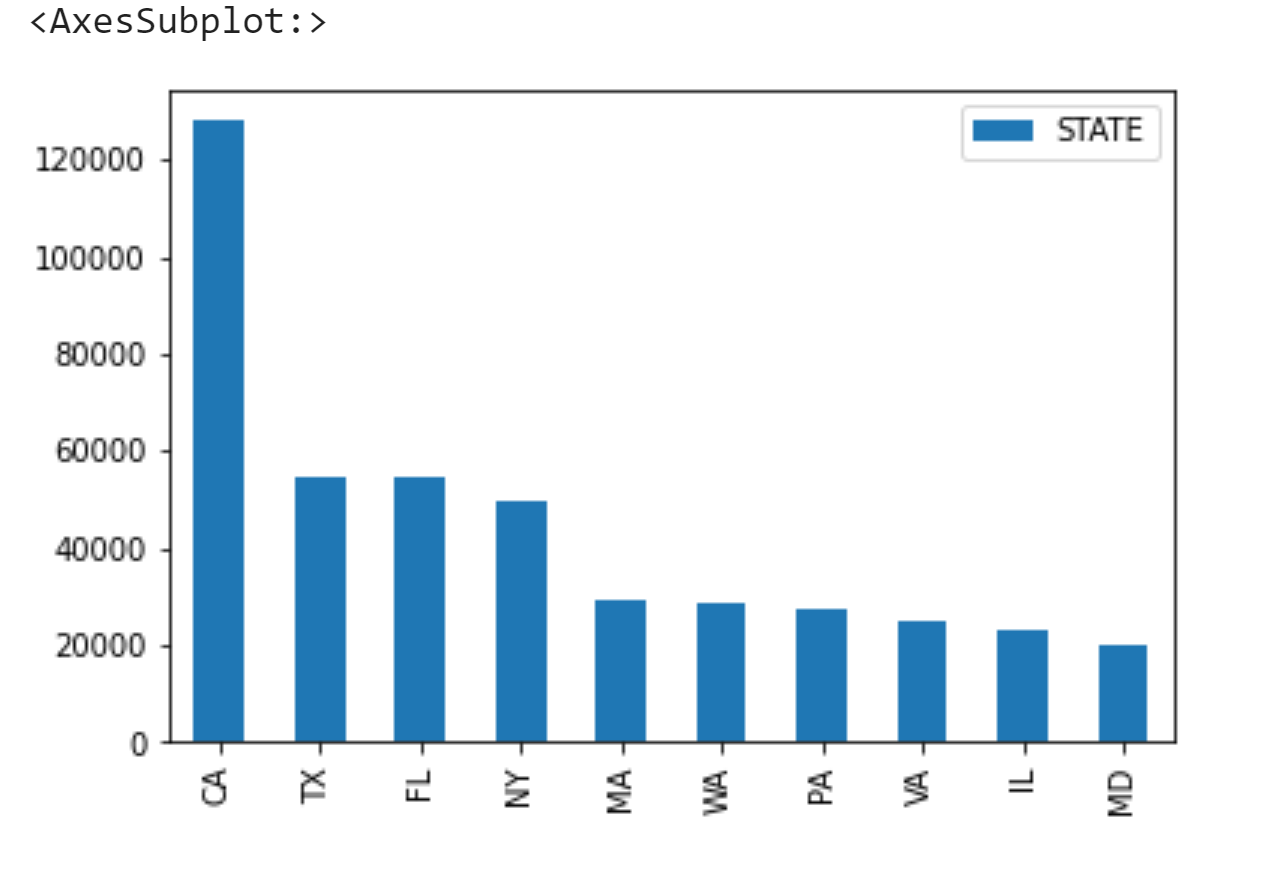
#Check the number of donors in each state
c_itcont['STATE'].value_counts()

CA    127895
TX     54457
FL     54343
NY     49453
MA     29314
       ...
AA        22
MP        10
PW         6
AS         2
FM         1
Name: STATE, Length: 63, dtype: int64
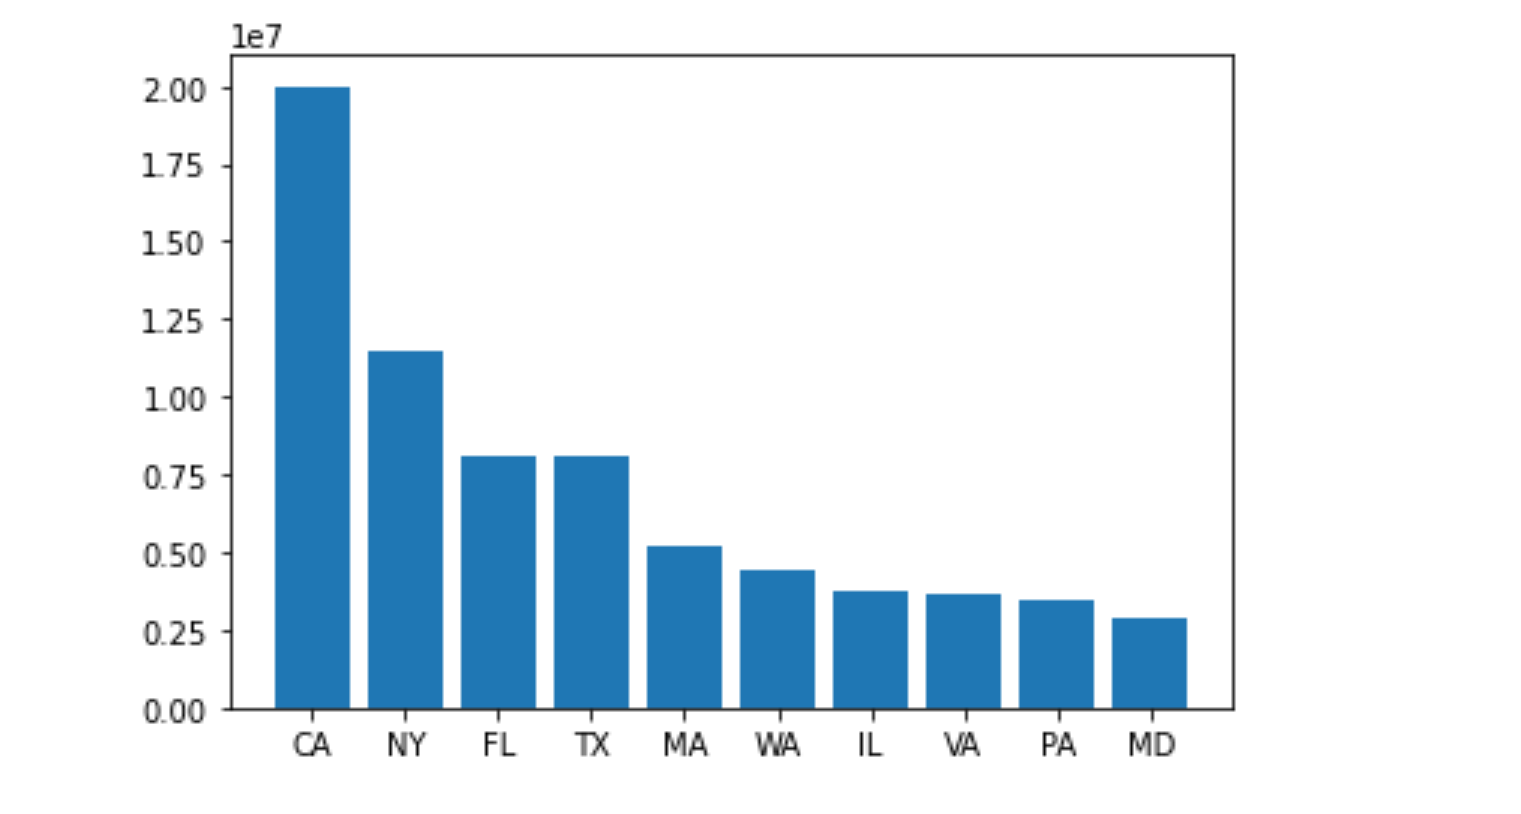
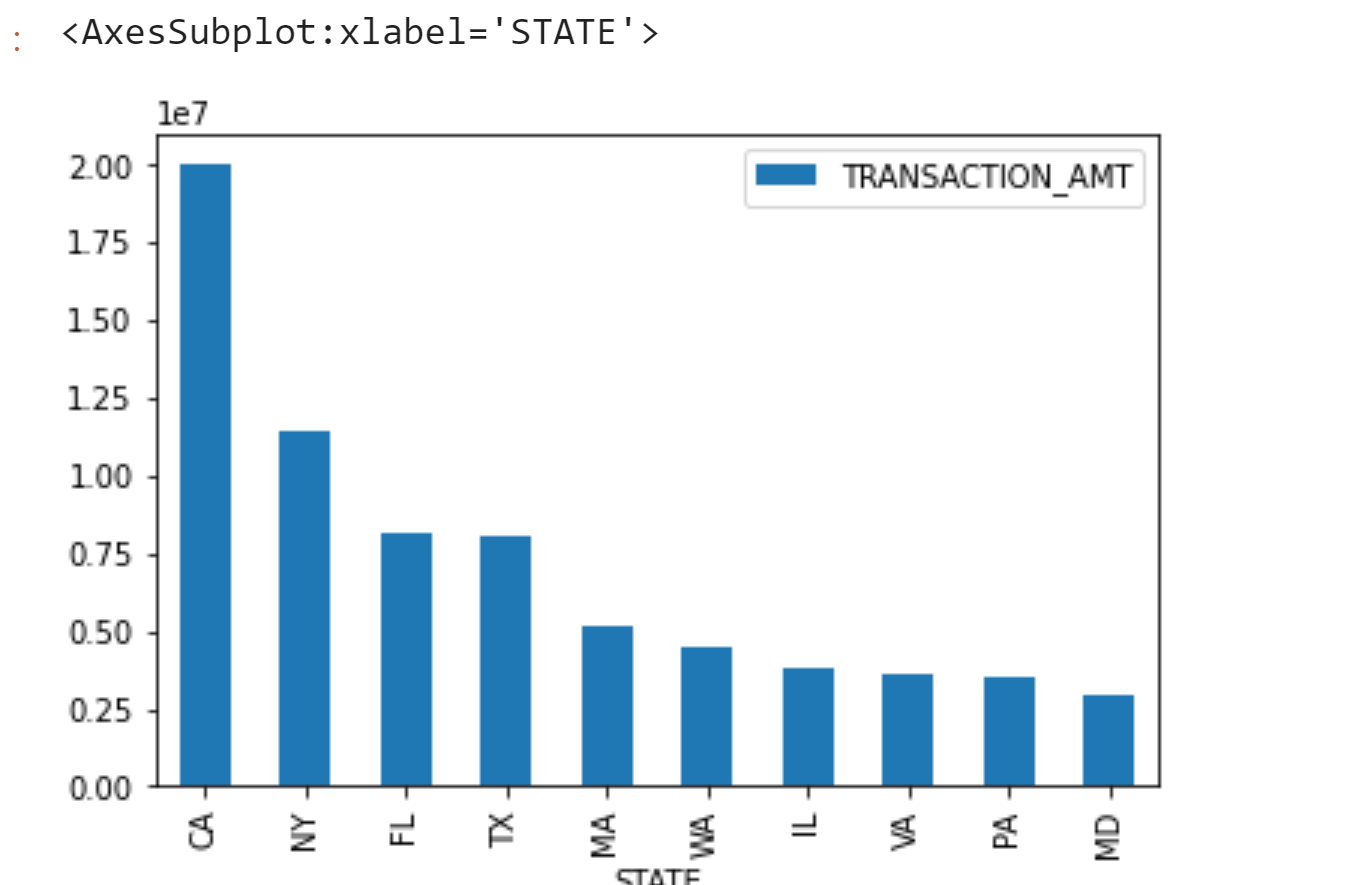
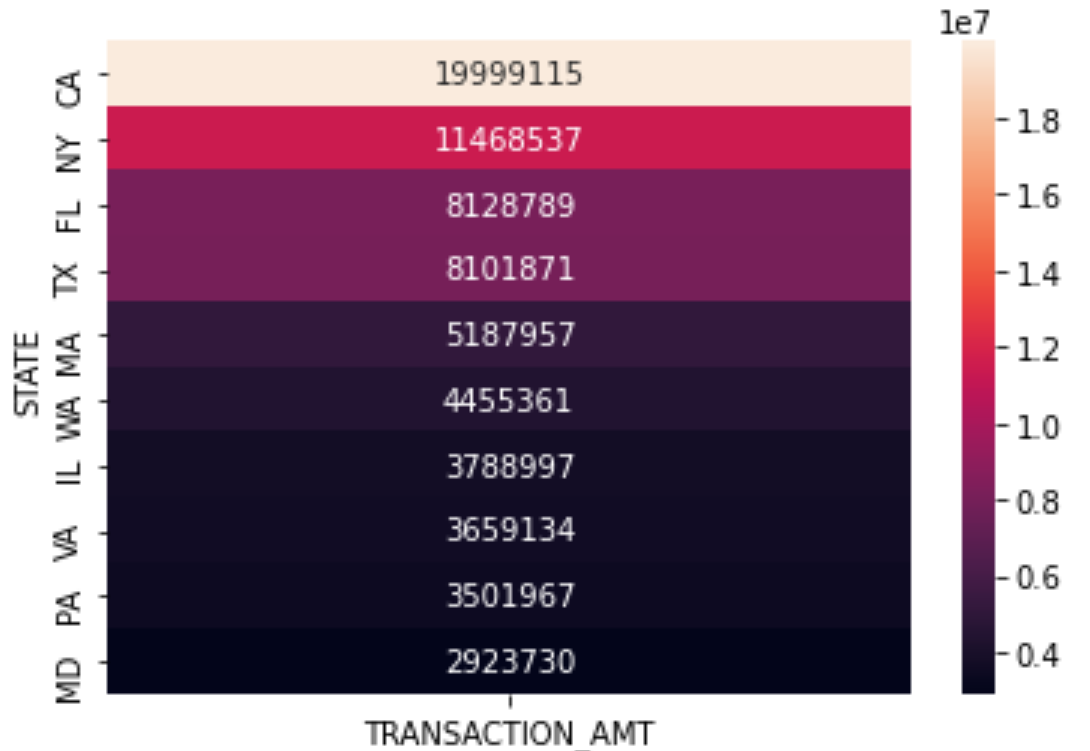
Finally, looking at the total amount of donations from each state, we will find that Ca (California), NY (New York) and FL (Florida) have the largest donations, and the number of donations is also at the Top. On the other hand, it also highlights the developed economic level of these states. You can also check the distribution of the high-end occupations listed above in various states through the data for further analysis and exploration
4. Data visualization
4.1 histogram of total donations and total donations by state
st_amt=c_itcont.groupby('STATE').sum()['TRANSACTION_AMT'].sort_values(ascending=False)[:10]
st_amt

plt.bar(st_amt.index,st_amt.values)
st_amt=pd.DataFrame(st_amt)
st_amt

#Drawing with dataframe
st_amt.plot(kind='bar')
4.2 visualization of the total number of state donations
4.3 proportion of donations received by popular candidate Biden in various states
#Extract the target data from many data
baiden=c_itcont[c_itcont['CAND_NAME']=='BIDEN, JOSEPH R JR']
#Count state support for Biden lv

baiden_state=baiden.groupby('STATE').sum().sort_values('TRANSACTION_AMT',ascending=False)[:10]
baiden_state

baiden_state.plot.pie(figsize=(10,10),subplots=True,autopct='%0.2f%%')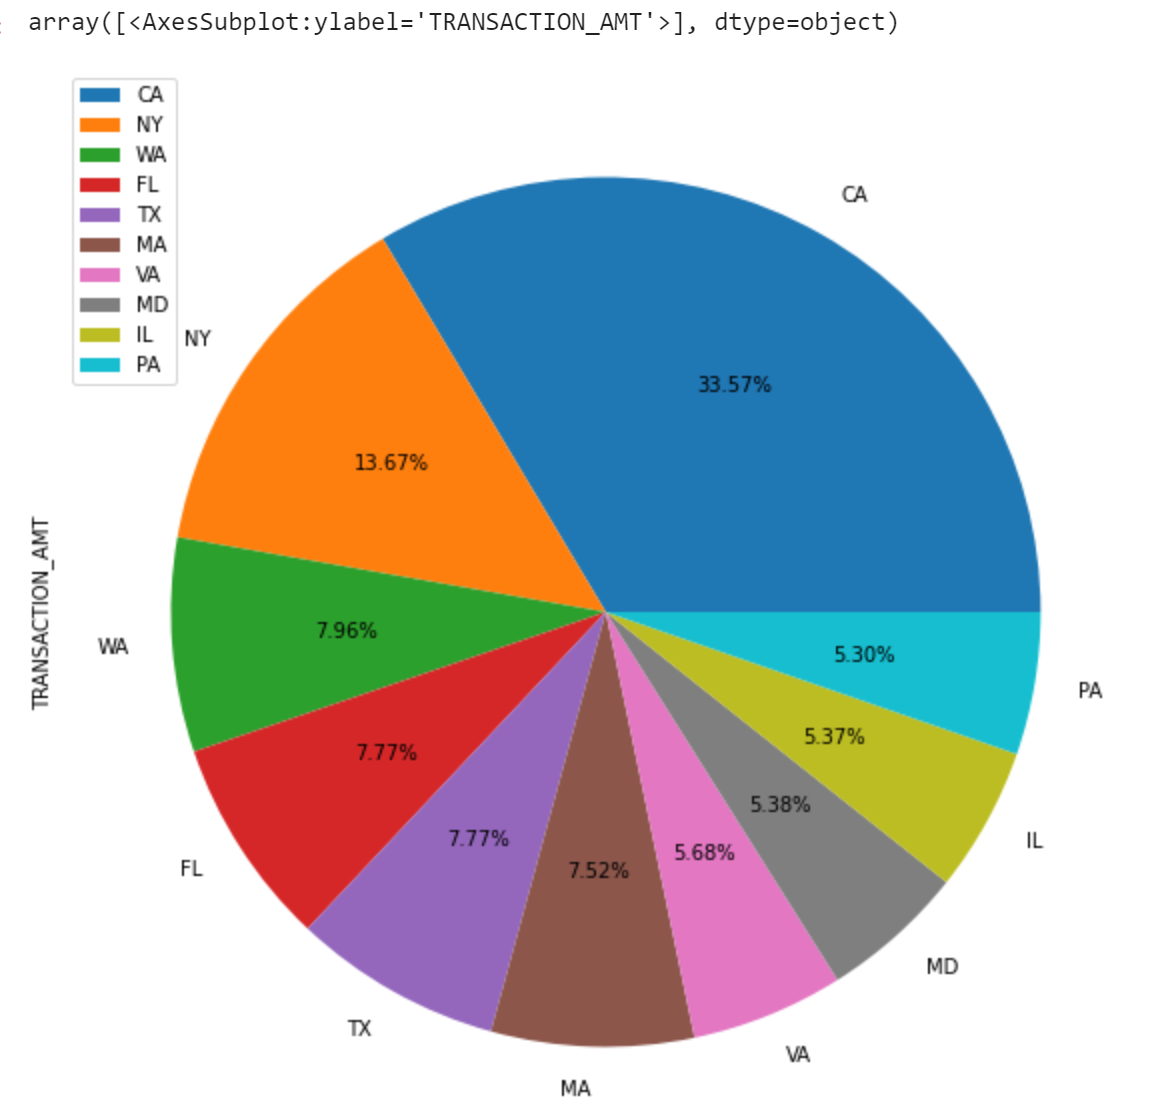
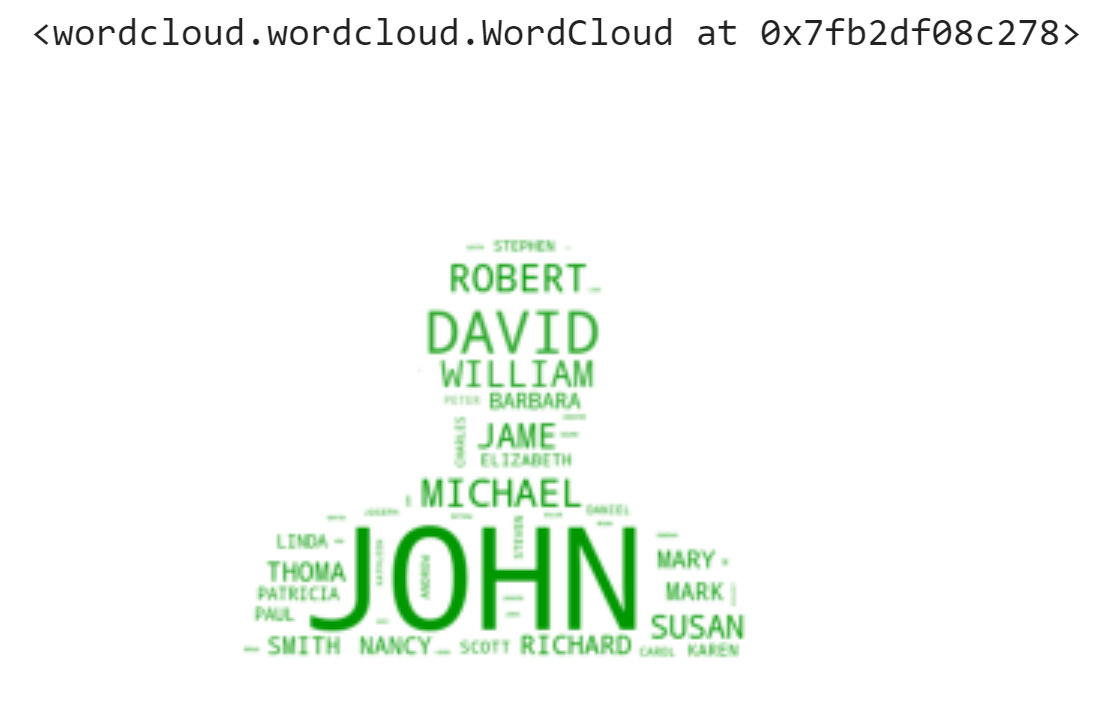
4.3 words and phrases of candidate donors with the largest total donation
 First download the picture model,Here are the processed images. Interested players can write their own code for image processing
# Processing result: it is necessary to separate the human image from the background color and fill it with solid color, so that the word cloud can only be displayed in the human image area
# Biden Original: https://img.alicdn.com/tfs/TB1pUcwmZVl614jSZKPXXaGjpXa-689-390.jpg
# Biden processed pictures: https://img.alicdn.com/tfs/TB10Jx4pBBh1e4jSZFhXXcC9VXa-689-390.jpg
# Trump Original: https://img.alicdn.com/tfs/TB1D0l4pBBh1e4jSZFhXXcC9VXa-298-169.jpg
# Trump processed image: https://img.alicdn.com/tfs/TB1BoowmZVl614jSZKPXXaGjpXa-298-169.jpg
# Here we first download the processed image
!wget https://img.alicdn.com/tfs/TB10Jx4pBBh1e4jSZFhXXcC9VXa-689-390.jpg

#Because the picture name is too long, modify the name
import os
os.rename('TB10Jx4pBBh1e4jSZFhXXcC9VXa-689-390.jpg','baideng.jpg')

from wordcloud import WordCloud,ImageColorGenerator
import matplotlib.image as mpig
mg_plt = plt.imread('./baideng.jpg')

#mpig.imread('baideng.jpg')
plt.imshow(mg_plt , cmap=plt.cm.binary)

data = ' '.join(baiden["NAME"].tolist())
# Read picture file
bg = plt.imread("baideng.jpg")
# generate
wc = WordCloud(# FFFAE3
    background_color="white",  # Set the background to white and default to black
    width=890,  # Set the width of the picture
    height=600,  # Set the height of the picture
    mask=bg,    # canvas
    margin=10,  # Set the edge of the picture
    max_font_size=100,  # Maximum font size displayed
    random_state=20,  # Returns a PIL color for each word
).generate_from_text(data)
# Picture background
bg_color = ImageColorGenerator(bg)
# Start drawing
plt.imshow(wc.recolor(color_func=bg_color))
# Remove the coordinate axis for the cloud image
plt.axis("off")
# Draw a cloud picture to show
# Save cloud image
wc.to_file("baiden_wordcloud.png")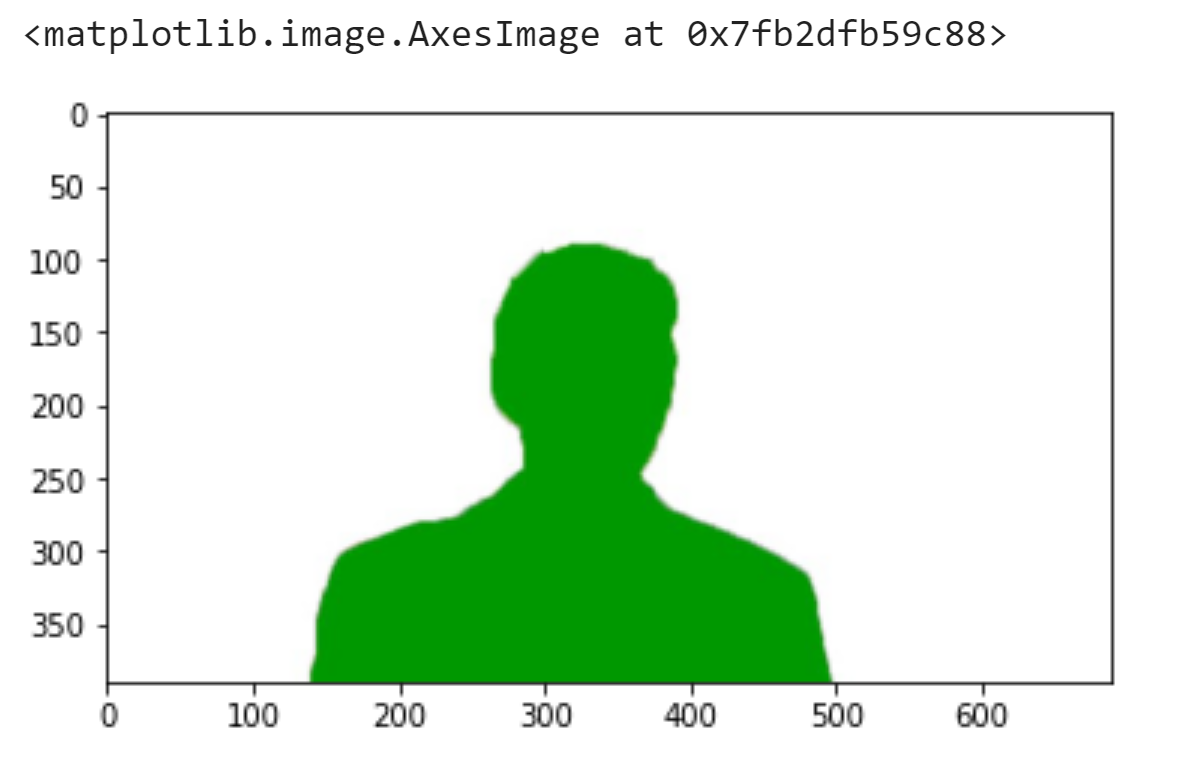
4.4 total contributions by state
S_AMT=c_itcont.groupby('STATE').sum().sort_values('TRANSACTION_AMT',ascending=False)
S_AMT

S_AMT=pd.DataFrame(S_AMT,columns=['TRANSACTION_AMT'])[0:10]
S_AMT

sns.heatmap(S_AMT, annot=True, fmt='.0f')
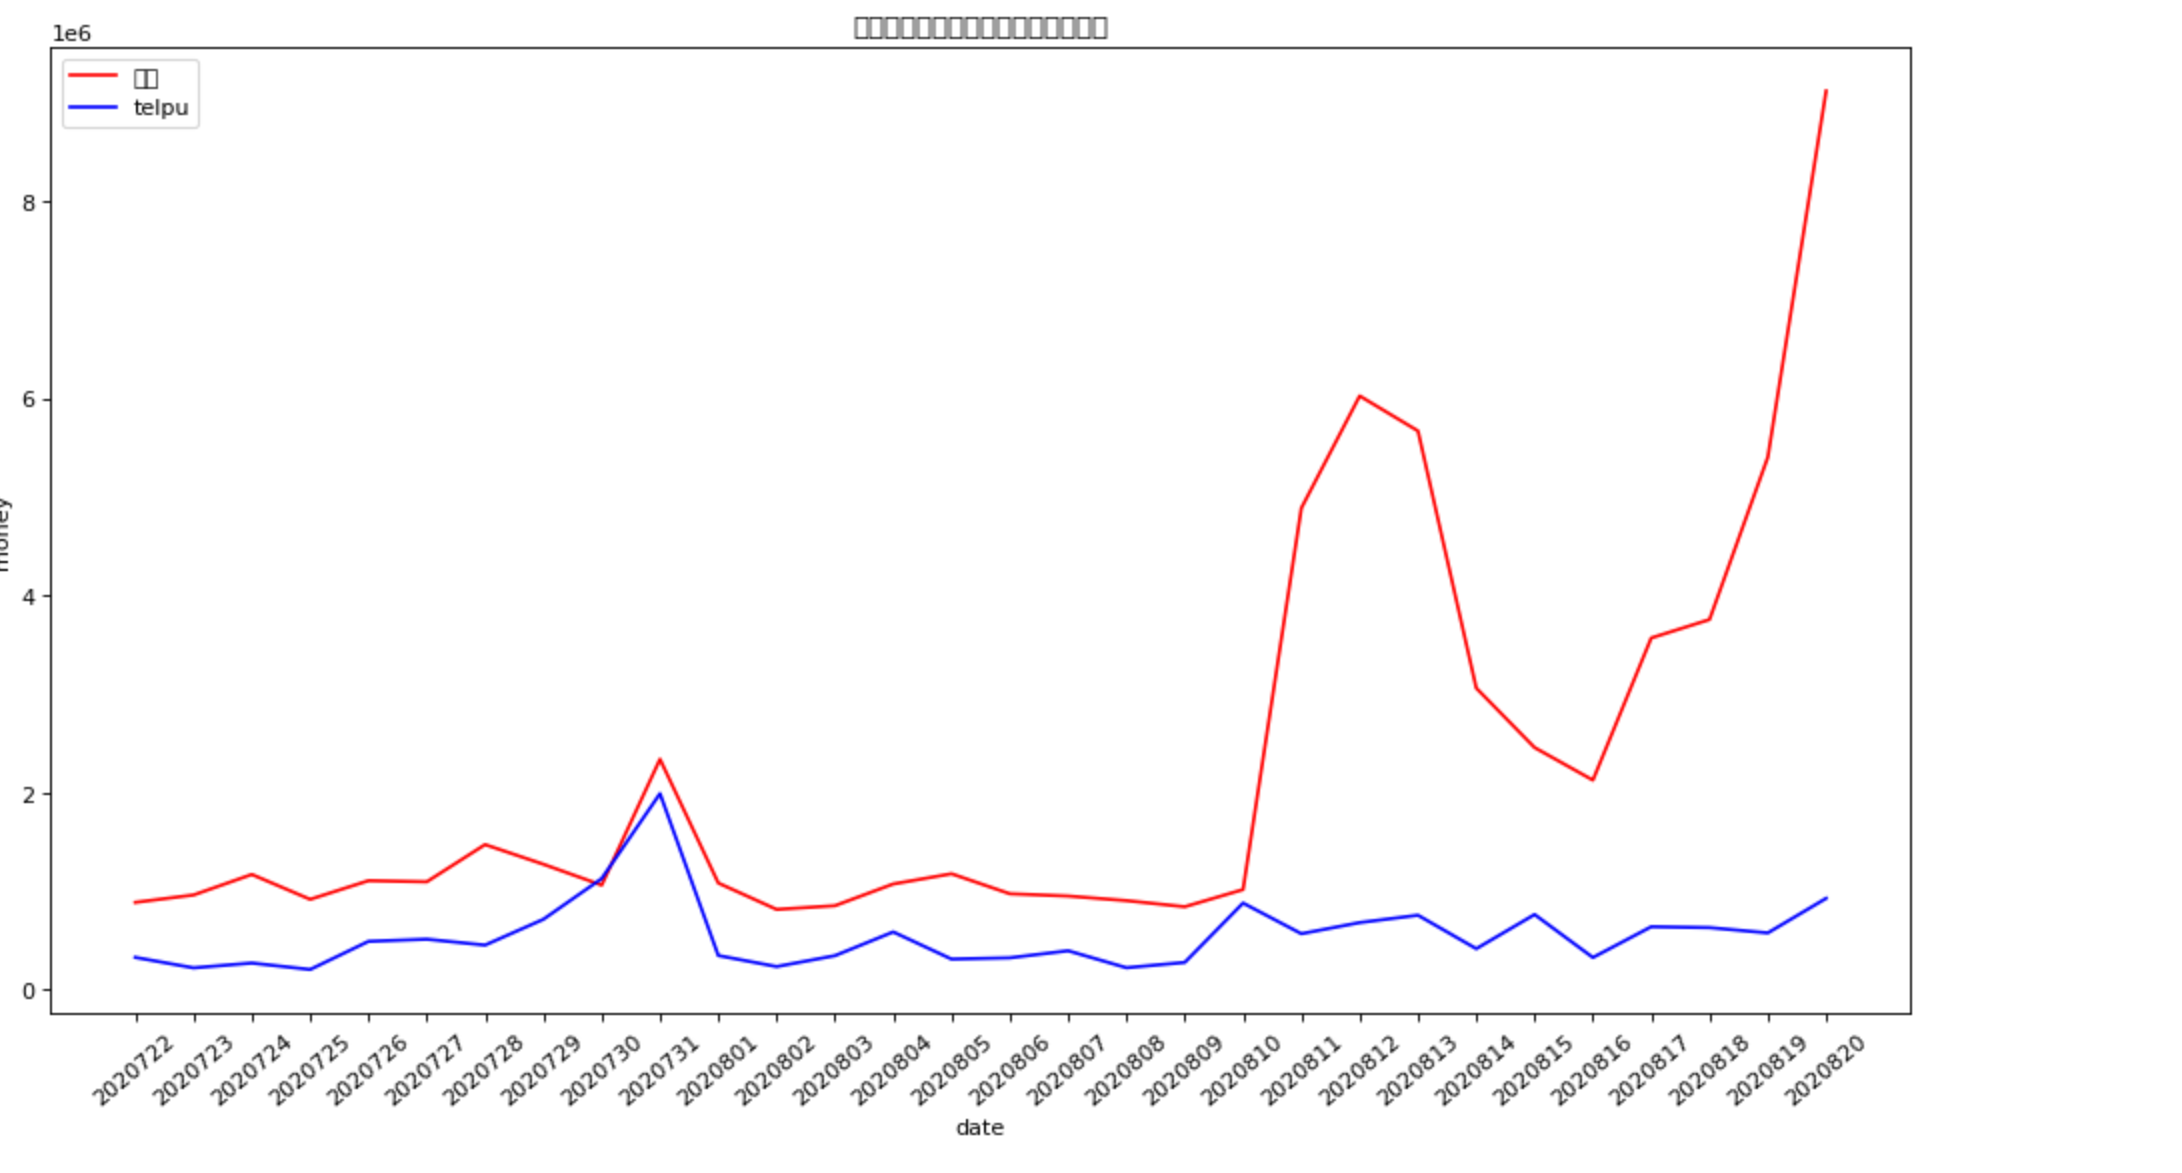
4.5 trends in the total donations of the two candidates who received the most donations
S_AMT=c_itcont.groupby('CAND_NAME').sum().scort_values('TRANSACTION_AMT',ascending=False)
S_AMT

D=c_itcont.groupby(['TRANSACTION_DT','CAND_NAME'],as_index=False).sum()
D

D_baiden=D[D['CAND_NAME']=='BIDEN, JOSEPH R JR']
D_baiden

D_telpu=D[D['CAND_NAME']=='TRUMP, DONALD J.']
D_telpu

#Merge two data tables
D_merge=D_baiden.merge(D_telpu,on='TRANSACTION_DT',how='left')
D_merge

fig = plt.figure(figsize=(15, 8), dpi=80)
plt.xticks(rotation=40)
plt.xlabel('date')
plt.ylabel('money')
plt.plot(D_merge['TRANSACTION_DT'], D_merge['TRANSACTION_AMT_x'], label='baideng', color='red')
plt.plot(D_merge['TRANSACTION_DT'], D_merge['TRANSACTION_AMT_y'], label='telpu', color='blue')
plt.legend(loc='upper left')
plt.title('Trends in trump and Biden's political contributions')
plt.show()
Solve the problem of Chinese garbled Code:
plt. Rcparams ['font. Sans serif '] = ['simhei'] # is used to display Chinese labels normally
plt.rcParams['axes.unicode_minus']=False # used to display negative signs normally