What is panda?
pandas is a NumPy based tool, which is created to solve data analysis tasks. pandas incorporates a large number of libraries and some standard data models, providing the tools needed to efficiently operate large datasets. pandas provides a large number of functions and methods that enable us to process data quickly and conveniently. You will soon find that it is one of the important factors that make Python a powerful and efficient data analysis environment.
Why to learn pandas
So here comes the problem: numpy has been able to help us deal with data, and can solve the problem of data analysis with matplotlib. So what is the purpose of pandas learning?
numpy can help us deal with numerical data, but it's not enough
Most of the time, in addition to numerical value, our data includes string, time series, etc
For example, we get the data stored in the database through the crawler
For example, in the previous youtube example, in addition to the numerical value, there are also country information, video classification (tag) information, title information, etc
Therefore, numpy can help us deal with numerical values, but pandas can help us deal with other types of data besides numerical values (based on numpy)
Common data types of pandas
Series one dimensional, labeled array
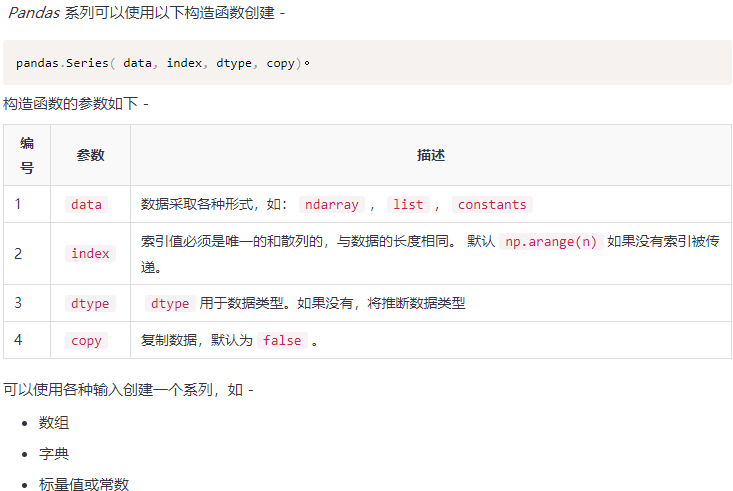
Create a series from darray
If the data is ndarray, the index passed must have the same length. If no index value is passed, the default index will be the range (n), where n is the array length, that is, [0,1,2,3 . range(len(array))-1] - 1].
Case 1:
#import the pandas library and aliasing as pd
import pandas as pd
import numpy as np
data = np.array(['a','b','c','d'])##Array objects in numpy
s = pd.Series(data)
print s
//Operation result:
0   a
1   b
2   c
3   d
dtype: object
[Note] the index name is not specified here, so it is the default.
#import the pandas library and aliasing as pd
import pandas as pd
import numpy as np
data = np.array(['a','b','c','d'])
s = pd.Series(data,index=[100,101,102,103])
print s
//Operation result:
//case2:
100  a
101  b
102  c
103  d
dtype: object
[notes]The index name is passed here
Create a series from a dictionary
A dictionary can be passed as input. If no index is specified, the dictionary keys are obtained in the sort order to construct the index. If an index is passed, the values in the data corresponding to the label in the index are pulled out.
Example 1
#import the pandas library and aliasing as pd
import pandas as pd
import numpy as np
data = {'a' : 0., 'b' : 1., 'c' : 2.}
s = pd.Series(data)
print s
Python
//Execute the above example code, and the output is as follows -
a 0.0
b 1.0
c 2.0
dtype: float64

//be careful - Dictionary keys are used to build indexes. dType I can specify the type myself
Example 2
#import the pandas library and aliasing as pd
import pandas as pd
import numpy as np
data = {'a' : 0., 'b' : 1., 'c' : 2.}
s = pd.Series(data,index=['b','c','d','a'])
print s
//Execute the above example code, and the output is as follows -
b 1.0
c 2.0
d NaN##If the key corresponding to the index is not available, it is filled with NAN
a 0.0
dtype: float64
Access data from series with location
The data in the series can be accessed using data similar to that in ndarray.
Example 1:
Retrieve the first element. For example, you already know that arrays count from zero, the first element is stored at zero, and so on.
import pandas as pd
s = pd.Series([1,2,3,4,5],index = ['a','b','c','d','e'])

#retrieve the first element
print s[0]
Execute the above example and get the following results-
1
Example 2
Retrieve the first three elements in the series. If a: is inserted in front of it, all items forward from the index are extracted. If you use two parameters (using between them), items between two indexes (excluding stop indexes).
import pandas as pd
s = pd.Series([1,2,3,4,5],index = ['a','b','c','d','e'])

#retrieve the first three element
print s[:3]
//Execute the above example and get the following results -
a  1
b  2
c  3
dtype: int64
Example 3
To retrieve the last three elements, refer to the following example code-
import pandas as pd
s = pd.Series([1,2,3,4,5],index = ['a','b','c','d','e'])

#retrieve the last three element
print s[-3:]
//Execute the above example code and get the following results -
c  3
d  4
e  5
dtype: int64
Retrieving data (index) using tags
A series is like a fixed size dictionary, which can get and set values through index labels.
Example 1
Use index label values to retrieve individual elements.
import pandas as pd
s = pd.Series([1,2,3,4,5],index = ['a','b','c','d','e'])

#retrieve a single element
print s['a']
Execute the above example code and get the following results-
1
Example 2
Retrieve multiple elements using the index label value list.
import pandas as pd
s = pd.Series([1,2,3,4,5],index = ['a','b','c','d','e'])

#retrieve multiple elements
print s[['a','c','d']]
Python
//Execute the above example code and get the following results -
a  1
c  3
d  4
dtype: int64
Example 3
If the label is not included, an exception occurs.
import pandas as pd
s = pd.Series([1,2,3,4,5],index = ['a','b','c','d','e'])

#retrieve multiple elements
print s['f']
Execute the above example code and get the following results-
...
KeyError: 'f'
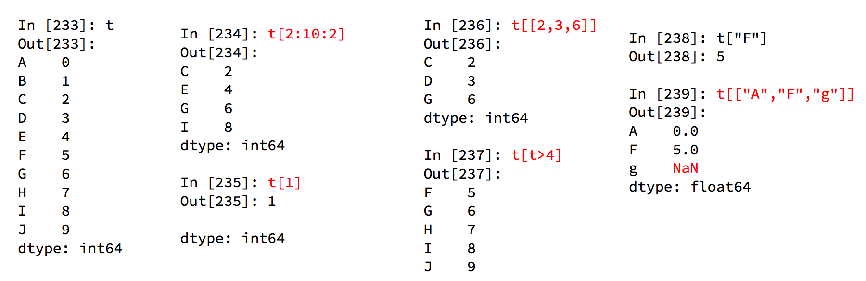
Series slice and index of pandas
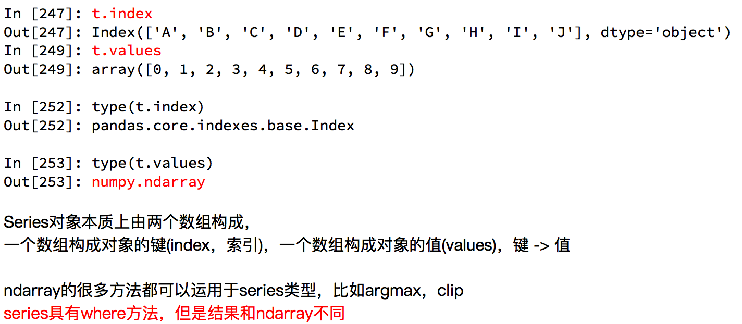
Index and value of pandas Series
Reading external data of pandas
Now suppose we have a group of statistics about the dog's name. What should we do to observe this group of statistics?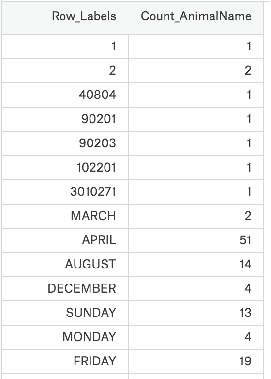
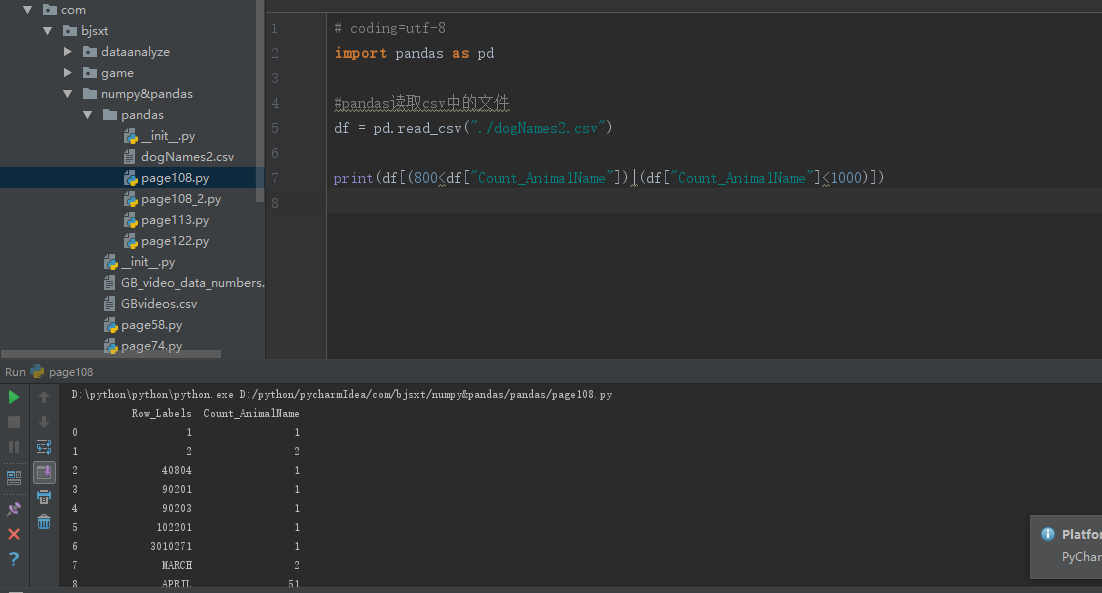
[note] I used the Boolean index to filter some data, only counting 800-1000 times. Obviously, this is no longer a series, but a new data structure, that is, the DataFrame to be introduced next!
DataFrame 2D, Series container
DataFrame of pandas
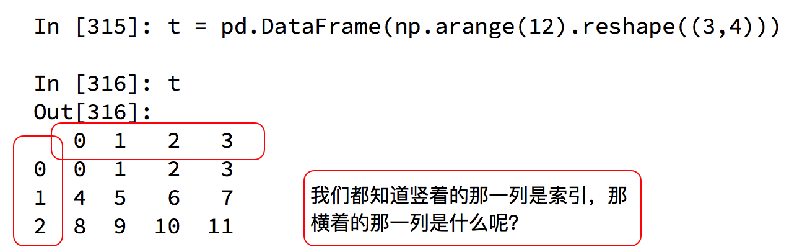
DataFrame objects have both row and column indexes
Row index, indicating different rows, horizontal index, called index, axis 0, axis=0
Column index, different table names, vertical index, called columns, 1 axis, axis=1
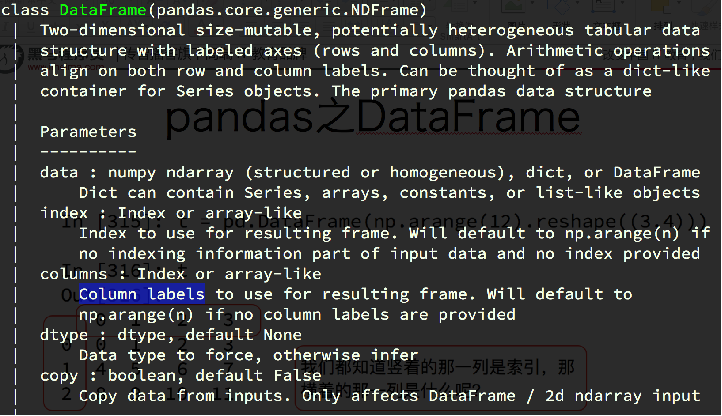
[note] in the figure above, you can see the parameters to be passed in the dataframe!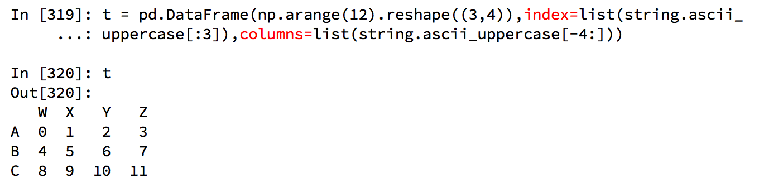
Just like a ndarray, we know the basic information of this ndarray through shape, ndim and dtype. So how do we know about DataFrame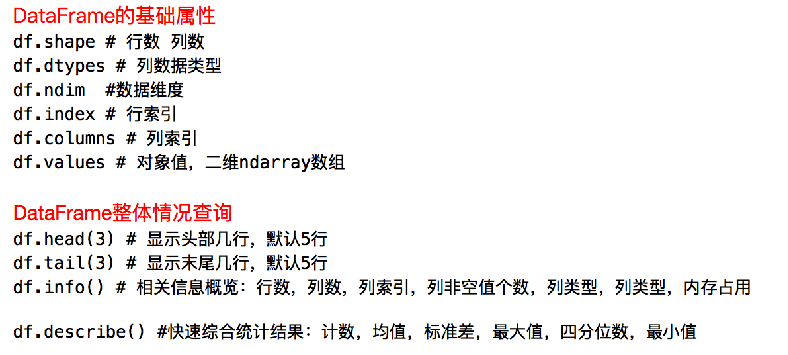
Create DataFrame from list
Instance-1
import pandas as pd
data = [1,2,3,4,5]
df = pd.DataFrame(data)
print df

Execute the above example code and get the following results-
     0
0    1
1    2
2    3
3    4
4    5
Example-2
import pandas as pd
data = [['Alex',10],['Bob',12],['Clarke',13]]
df = pd.DataFrame(data,columns=['Name','Age'])
print df

Execute the above example code and get the following results-
      Name      Age
0     Alex      10
1     Bob       12
2     Clarke    13
Example -3
import pandas as pd
data = [['Alex',10],['Bob',12],['Clarke',13]]
df = pd.DataFrame(data,columns=['Name','Age'],dtype=float)
print df

Execute the above example code and get the following results-
      Name     Age
0     Alex     10.0
1     Bob      12.0
2     Clarke   13.0
Note - you can observe that the dtype parameter changes the type of the Age column to floating point.
Create a DataFrame from the dictionaries of darrys / lists
All ndarrays must have the same length. If an index is passed, the length of the index should be equal to the length of the array.
If no index is passed, by default, the index will be range(n), where n is the array length.
Instance-1
import pandas as pd
data = {'Name':['Tom', 'Jack', 'Steve', 'Ricky'],'Age':[28,34,29,42]}
df = pd.DataFrame(data)
print df

Execute the above example code and get the following results-
      Age      Name
0     28        Tom
1     34       Jack
2     29      Steve
3     42      Ricky
Note - observations 0,1,2,3. They are the default indexes assigned to each use function range(n).
Example-2
Use an array to create an indexed data frame.
import pandas as pd
data = {'Name':['Tom', 'Jack', 'Steve', 'Ricky'],'Age':[28,34,29,42]}
df = pd.DataFrame(data, index=['rank1','rank2','rank3','rank4'])
print df

//Execute the above example code and get the following results -
         Age    Name
rank1    28      Tom
rank2    34     Jack
rank3    29    Steve
rank4    42    Ricky
Note - the index parameter assigns an index to each row, colmun is the column.
Create DataFrame from list
The dictionary list can be passed as input data to create a data frame. The dictionary key defaults to the column name.
Instance-1
The following example shows how to create a data frame by passing in a list of dictionaries.
import pandas as pd
data = [{'a': 1, 'b': 2},{'a': 5, 'b': 10, 'c': 20}]
df = pd.DataFrame(data)
print df

Execute the above example code and get the following results-
    a    b      c
0   1   2     NaN
1   5   10   20.0
Note - it was observed that Nan (not a number) was attached to the missing area.
Example-2
The following example shows how to create a data frame by passing a dictionary list and a row index.
import pandas as pd
##It is equivalent to making column index a,b,c
data = [{'a': 1, 'b': 2},{'a': 5, 'b': 10, 'c': 20}]
df = pd.DataFrame(data, index=['first', 'second'])
print df

//Execute the above example code and get the following results -
        a   b       c
first   1   2     NaN
second  5   10   20.0
Example-3
The following example shows how to create a data frame using a dictionary, row index, and column index list.
import pandas as pd
data = [{'a': 1, 'b': 2},{'a': 5, 'b': 10, 'c': 20}]

#With two column indices, values same as dictionary keys
##You can kill the c above by redefining the column index name
df1 = pd.DataFrame(data, index=['first', 'second'], columns=['a', 'b'])

#With two column indices with one index with other name
df2 = pd.DataFrame(data, index=['first', 'second'], columns=['a', 'b1'])
print df1
print df2

//Execute the above example code and get the following results -
#df1 output
         a  b
first    1  2
second   5  10

#df2 output
         a  b1
first    1  NaN
second   5  NaN
Note - observe that df2 creates a DataFrame using a column index other than the dictionary key; therefore, NaN is attached to the location. df1 is created using the column index, the same as the dictionary key, so NaN is attached.
Create a DataFrame from the dictionary of the series
A series of dictionaries can be passed to form a DataFrame. The resulting index is the union of all the series indexes passed.
Example
import pandas as pd

d = {'one' : pd.Series([1, 2, 3], index=['a', 'b', 'c']),
      'two' : pd.Series([1, 2, 3, 4], index=['a', 'b', 'c', 'd'])}

df = pd.DataFrame(d)
print df
`

//Execute the above example code and get the following results -
      one    two
a     1.0    1
b     2.0    2
c     3.0    3
d     NaN    4


//be careful - For the first series, no delivery label was observed'd',But in the result, for d Tag, attached NaN.
Column selection
Next, you will select a column from the data frame.
Example
import pandas as pd

d = {'one' : pd.Series([1, 2, 3], index=['a', 'b', 'c']),
      'two' : pd.Series([1, 2, 3, 4], index=['a', 'b', 'c', 'd'])}

df = pd.DataFrame(d)
print df ['one']

//Execute the above example code and get the following results -
a     1.0
b     2.0
c     3.0
d     NaN
Name: one, dtype: float64
Column add
You will understand this by adding a new column to an existing data box.
Example
i
mport pandas as pd

d = {'one' : pd.Series([1, 2, 3], index=['a', 'b', 'c']),
      'two' : pd.Series([1, 2, 3, 4], index=['a', 'b', 'c', 'd'])}

df = pd.DataFrame(d)

# Adding a new column to an existing DataFrame object with column label by passing new series

print ("Adding a new column by passing as Series:")
df['three']=pd.Series([10,20,30],index=['a','b','c'])
print df

print ("Adding a new column using the existing columns in DataFrame:")
df['four']=df['one']+df['three']

print df

//Execute the above example code and get the following results -
Adding a new column by passing as Series:
     one   two   three
a    1.0    1    10.0
b    2.0    2    20.0
c    3.0    3    30.0
d    NaN    4    NaN

Adding a new column using the existing columns in DataFrame:
      one   two   three    four
a     1.0    1    10.0     11.0
b     2.0    2    20.0     22.0
c     3.0    3    30.0     33.0
d     NaN    4     NaN     NaN
Shell
Column delete
Columns can be deleted or popped up; take a look at the example below.
example
# Using the previous DataFrame, we will delete a column
# using del function
import pandas as pd

d = {'one' : pd.Series([1, 2, 3], index=['a', 'b', 'c']),
     'two' : pd.Series([1, 2, 3, 4], index=['a', 'b', 'c', 'd']),
     'three' : pd.Series([10,20,30], index=['a','b','c'])}

df = pd.DataFrame(d)
print ("Our dataframe is:")
print df

# using del function
print ("Deleting the first column using DEL function:")
del df['one']
print df

# using pop function
print ("Deleting another column using POP function:")
df.pop('two')
print df
Python
//Execute the above example code and get the following results -
Our dataframe is:
      one   three  two
a     1.0    10.0   1
b     2.0    20.0   2
c     3.0    30.0   3
d     NaN     NaN   4

Deleting the first column using DEL function:
      three    two
a     10.0     1
b     20.0     2
c     30.0     3
d     NaN      4

Deleting another column using POP function:
   three
a  10.0
b  20.0
c  30.0
d  NaN
Shell
Row selection, adding and deleting
Now you'll learn about row selection, addition, and deletion through the following example. We start with the concept of choice.
Label selection
You can select a row by passing the row label to the loc() function. Refer to the following example code-
import pandas as pd

d = {'one' : pd.Series([1, 2, 3], index=['a', 'b', 'c']),
     'two' : pd.Series([1, 2, 3, 4], index=['a', 'b', 'c', 'd'])}

df = pd.DataFrame(d)
print df.loc['b']
Python
 Execute the above example code and get the following results-
one 2.0
two 2.0
Name: b, dtype: float64
Shell
 The result is a series of labels as column names for the DataFrame. Also, the name of the series is the retrieved label.
Select by integer position
 You can select rows by passing the integer position to the iloc() function. Refer to the following example code-
import pandas as pd

d = {'one' : pd.Series([1, 2, 3], index=['a', 'b', 'c']),
     'two' : pd.Series([1, 2, 3, 4], index=['a', 'b', 'c', 'd'])}

df = pd.DataFrame(d)
print df.iloc[2]
Python
 Execute the above example code and get the following results-
one   3.0
two   3.0
Name: c, dtype: float64
Shell
Row slice
You can use the: operator to select multiple lines. Refer to the following example code-
import pandas as pd

d = {'one' : pd.Series([1, 2, 3], index=['a', 'b', 'c']),
    'two' : pd.Series([1, 2, 3, 4], index=['a', 'b', 'c', 'd'])}

df = pd.DataFrame(d)
print df[2:4]
Python
//Execute the above example code and get the following results -
      one    two
c     3.0     3
d     NaN     4
Shell
Additional lines
Use the append() function to add a new row to the DataFrame. This feature will append the end of the row.
import pandas as pd

df = pd.DataFrame([[1, 2], [3, 4]], columns = ['a','b'])
df2 = pd.DataFrame([[5, 6], [7, 8]], columns = ['a','b'])

df = df.append(df2)
print df
Python
//Execute the above example code and get the following results -
   a  b
0  1  2
1  3  4
0  5  6
1  7  8
Shell
Delete row
Use index labels to delete or delete rows from a DataFrame. If the label is duplicated, multiple lines are deleted.
If noted, in the above example, there are labels that are repeated. Put another label here to see how many lines have been deleted.
import pandas as pd

df = pd.DataFrame([[1, 2], [3, 4]], columns = ['a','b'])
df2 = pd.DataFrame([[5, 6], [7, 8]], columns = ['a','b'])

df = df.append(df2)

# Drop rows with label 0
df = df.drop(0)

print df
Python
//Execute the above example code and get the following results -
  a b
1 3 4
1 7 8
Shell
//In the above example, a total of two lines were deleted because they contain the same label0.
pandas case
Extraction of Douban information from mongodb
from pymongo import MongoClient
import pandas as pd

##Connect to mongo
client = MongoClient()
##tv1 set of double library linked to mongo
collection = client["douban"]["tv1"]
data = collection.find()##Take out one document, the document here is a large json string!!
data_list = []
for i in data:
    temp = {}
    temp["info"]= i["info"]
    ##The following statement i [] [] means to take the value corresponding to rating in the json string, and then take the value corresponding to count from the value!!
    temp["rating_count"] = i["rating"]["count"]
    temp["rating_value"] = i["rating"]["value"]
    temp["title"] = i["title"]
    temp["country"] = i["tv_category"]
    temp["directors"] = i["directors"]
    temp["actors"] = i['actors']
    data_list.append(temp)
# t1 = data[0]
# t1 = pd.Series(t1)
# print(t1)

df = pd.DataFrame(data_list)
# print(df)

#Display the first few lines
print(df.head(1))
# print("*"*100)
# print(df.tail(2))

#Show df at a glance
# print(df.info())
# print(df.describe())
print(df["info"].str.split("/").tolist())
Sort the number of times the dog's name appears
import pandas as pd

df = pd.read_csv("./dogNames2.csv")
# print(df.head())
# print(df.info())

#Sorting method in dataFrame
df = df.sort_values(by="Count_AnimalName",ascending=False)
# print(df.head(5))

#Attention points of pandas fetching rows or columns
# -Square brackets write array to indicate row fetching and operation on row
# -Write string, de column index of representation, operate on column
print(df[:20])
print(df["Row_Labels"])
print(type(df["Row_Labels"]))