Author: Huan Hao
Source: Hang Seng LIGHT cloud community
Pandas is a Python software library, which provides a large number of functions and methods that enable us to process data quickly and easily. This paper will mainly introduce the practical data processing operation of pandas.
Series of articles:
[Pandas learning notes 01] powerful tool set for analyzing structured data
[Pandas learning notes 02] - practical operation of data processing
summary
Pandas is a library based on NumPy. In terms of data processing, it can be understood as an enhanced version of NumPy. At the same time, pandas is also an open source project. It is used for data mining and data analysis, and also provides data cleaning function.
This paper mainly introduces the high-order usage of Pandas in data processing, including data merging, grouping and splitting. If you have learned the SQL syntax of the database, this article will understand very quickly.
Data merging
Data preparation
First, define a DataFrame dataset:
import pandas as pd

df_a = pd.DataFrame(columns=['name', 'rank'], data=[['C', 1], ['java', 2], ['python', 3], ['golang', 4]])
df_b = pd.DataFrame(columns=['name', 'year'], data=[['java', 2020], ['python', 2021], ['golang', 2022]])
The DataFrame dataset can be merged through the merge() method, through internal connection, external connection, left connection, right connection, etc., as shown in the following example:
The merge method takes the intersection of inner connections by default. Specify the connection type by how and the connection field by on
# Connect by specifying the name in columns
df_tmp = pd.merge(df_a, df_b, on='name', how='outer')
print(df_tmp)

# ========Print========
     name  rank  year
0    java     2  2020
1  python     3  2021
2  golang     4  2022
# Left join by specifying name in columns
df_tmp = pd.merge(df_a, df_b, on='name', how='left')
print(df_tmp)
# ========Print========
name rank year
0 C 1 NaN
1 java 2 2020.0
2 python 3 2021.0
3 golang 4 2022.0# Connect right by specifying name in columns
df_tmp = pd.merge(df_a, df_b, on='name', how='right')
print(df_tmp)
# ========Print========
name rank year
0 java 2 2020
1 python 3 2021
2 golang 4 2022# If merging two dataframes does not contain public columns, you can directly specify the matching fields df_c = pd.DataFrame(columns=['name1', 'year'], data=[['java', 2020], ['python1', 2021], ['golang1', 2022]]) df_tmp = pd.merge(df_a, df_c, left_on='name', right_on='name1') print(df_tmp) # ========Print======== name rank name1 year 0 java 2 java 2020
Data grouping
Data preparation
First, define a DataFrame dataset:
import pandas as pd

df_a = pd.DataFrame(columns=['name', 'nums'], data=[['python', 1], ['java', 2], ['python', 3], ['java', 4]])
The DataFrame dataset can be grouped through the group() method. After grouping, it can also be summed and averaged, as shown in the following example:
# Gets the number of each data in the grouped dataset
df_tmp = df_a.groupby('name').size()
print(df_tmp)

# ========Print========
name
java      2
python    2
dtype: int64
# Sum the grouped data sets according to the nums field
df_tmp = df_a.groupby('name')['nums'].sum()
print(df_tmp)
# ========Print========
name
java 6
python 4
Name: nums, dtype: int64# Gets the size of the grouped dataset
df_tmp = df_a.groupby('name').size()
print(df_tmp)
# ========Print========
name
java 3
python 2
Name: nums, dtype: int64Data splitting
Data preparation
First, define a DataFrame dataset:
import pandas as pd

df_a = pd.DataFrame(columns=['name', 'rank'], data=[['C_no1', 1], ['java_no2', 2], ['python_no3', 3], ['golang', 4]])
The split() method can be used to split a column of data in the DataFrame dataset, as shown in the following example:
# Data splitting: split the data of a column in columns by matching a symbol. expand: if True, you can directly convert the sorted results into DataFrame
df_tmp = df_a['name'].str.split('_', 1, expand=True)
print(df_tmp)

# ========Print========
        0     1
0       C   no1
1    java   no2
2  python   no3
3  golang  None
# Data splitting: merge the split data with the original data again
df_tmp = pd.merge(df_a, df_a['name'].str.split('_', 1, expand=True), how='left', left_index=True, right_index=True)
print(df_tmp)
# ========Print========
name rank 0 1
0 C_no1 1 C no1
1 java_no2 2 java no2
2 python_no3 3 python no3
3 golang 4 golang NoneData visualization
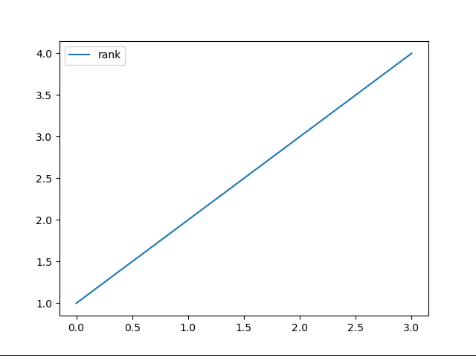
In the process of using Pandas to process data, in order to more intuitively show the linear relationship of data, we can introduce matplotlib library to turn our data into relevant graphics
# The plot() method generates the corresponding linear graph
df_a = pd.DataFrame(columns=['name', 'rank'], data=[['C_no1', 1], ['java_no2', 2], ['python_no3', 3], ['golang', 4]])
df_a.plot()
summary
This paper mainly introduces the high-level operation of Pandas tool set. The operation principle is similar to SQL in the database, which can help us solve the daily data analysis and processing.