
preface
The text and pictures of this article are from the Internet, only for learning and communication, not for any commercial purpose. The copyright belongs to the original author. If you have any questions, please contact us in time for handling.
Add Penguin Group 695185429 and you can get it for free. All the information is in the group file. Materials can be obtained, including but not limited to Python practice, PDF electronic documents, interview brochures, learning materials, etc
In this issue, the author crawls the recent National Concert data of barley net through python. Through analysis, we find that barley net belongs to the "medium" difficulty website in Python's crawler strategy, and the concert data is encapsulated in json file. Therefore, we can simply crawl out the data through requests and json, and then filter and save the data to Excel file through panda.
1. Target website analysis

Check to see if there is any data we need in xhr.
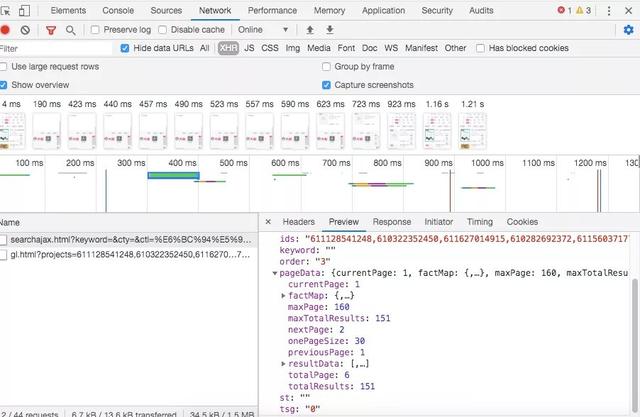
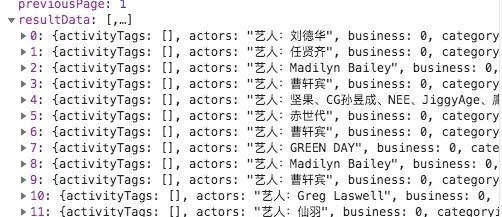
Good, just encapsulate the data with json in xhr.
2. Construct the corresponding Request URL
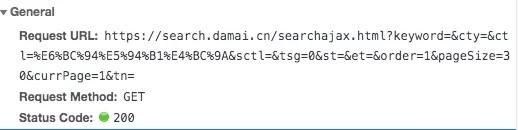
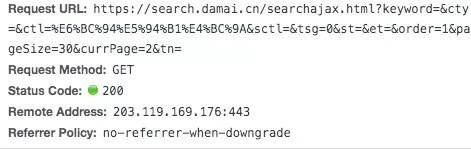
There is only one parameter change in the request url, that is, "Page =" this option has changed, simple 😄 , a total of 6 pages, directly constructed by loop.

for i in range(1,7):
    url=f'https://search.damai.cn/searchajax.html?keyword=&cty=&ctl=%E6%BC%94%E5%94%B1%E4%BC%9A&sctl=&tsg=0&st=&et=&order=1&pageSize=30&currPage={i}&tn='
#  print(url)
3.requests crawler up
Direct code:
def crawl(url):
    headers={
        'cookie': 'cna=J7K2Fok5AXECARu7QWn6+cxu; isg=BCcnDiP-NfKV5bF-OctWuXuatl3xrPuOyBVJJfmQLrZn6ESqAX0y3jrhCuj2ANMG; l=eBSmWoPRQeT6Zn3iBO5whurza77O1CAf1sPzaNbMiIncC6BR1AvOCJxQLtyCvptRR8XcGLLB4nU7C5eTae7_7CDmndLHuI50MbkyCef..',
        'user-agent': 'Mozilla/5.0 (Macintosh; Intel Mac OS X 10_13_6) AppleWebKit/537.36 (KHTML, like Gecko) Chrome/81.0.4044.138 Safari/537.36'
    }
    response=requests.get(url,headers=headers)
    json_text=json.loads(response.text)
    # print(json_text.keys())
    rdata=json_text['pageData']['resultData']
    # print(rdata)
    return(rdata)
Add a header, and make a simple anti climbing.
4. Save to excel file
The basic idea is to save each page of data into the data frame structure of pandas, and then splice it, and then save it to Excel file after splicing.
inidata=pd.DataFrame(columns=('name','actors','cityname','showtime','price_str','venue','venuecity','verticalPic'))
for i in range(1,7):
    url=f'https://search.damai.cn/searchajax.html?keyword=&cty=&ctl=%E6%BC%94%E5%94%B1%E4%BC%9A&sctl=&tsg=0&st=&et=&order=1&pageSize=30&currPage={i}&tn='
   # print(url)
   # print(crawl(url))
    data=pd.DataFrame(crawl(url))
    data1=data[['name','actors','cityname','showtime','price_str','venue','venuecity','verticalPic']]
    inidata=inidata.append(data1)
# print(inidata)
inidata.to_excel('Barley net concert.xlsx',index=0)
5. See the effect
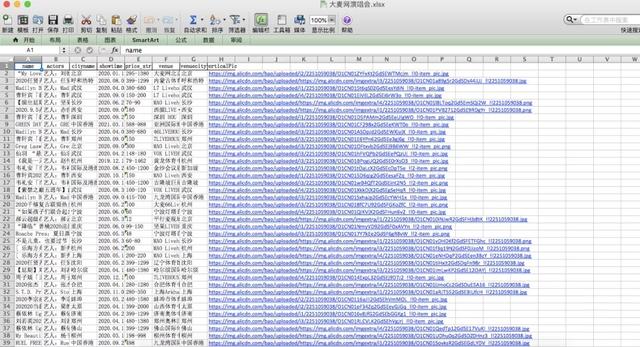
Perfect finish!