Reprinted to: https://mp.weixin.qq.com/s/ixfvJG46ZB0QKdyI6BKfpA
cpu usage is too high
If the cpu usage is too high, it should be discussed according to the situation. Whether it is a business activity, a large number of traffic suddenly comes in, and the cpu occupancy rate decreases after the activity. If this is the case, you can not care too much, because the more requests, the more threads to process, which is a normal phenomenon. In other words, if your server configuration is poor and your cpu has only one core, in this case, a little more traffic can really exhaust your cpu resources. At this time, you should consider improving the configuration first.
In the second case, the cpu utilization rate is too high for a long time. In this case, your program may have code with super many cycles, or even dead cycles. The troubleshooting steps are as follows:
(1) Use the top command to check the cpu usage
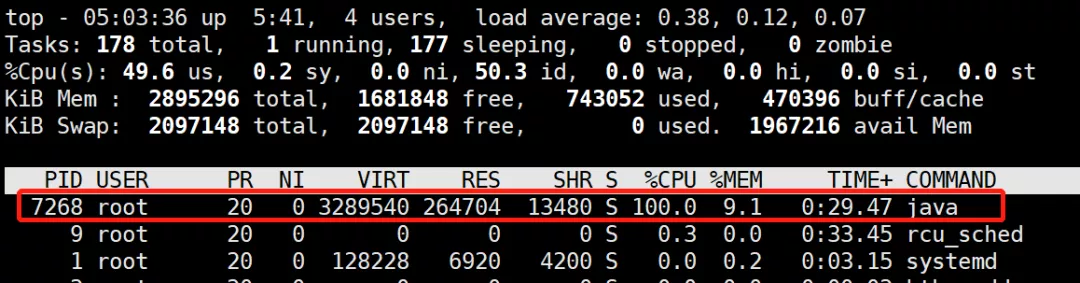
In this way, you can locate the process with high cpu. Under linux, the process number obtained by the top command is the same as the vmid obtained by the jps tool:

(2) Use the top -Hp command to view the thread
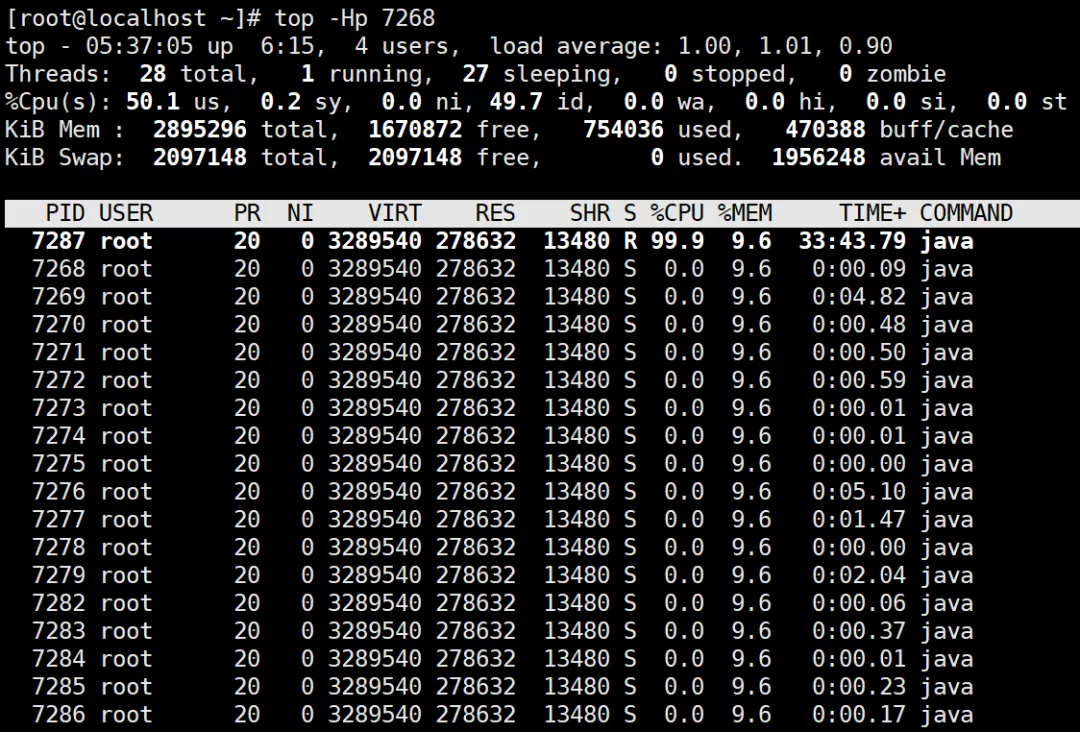
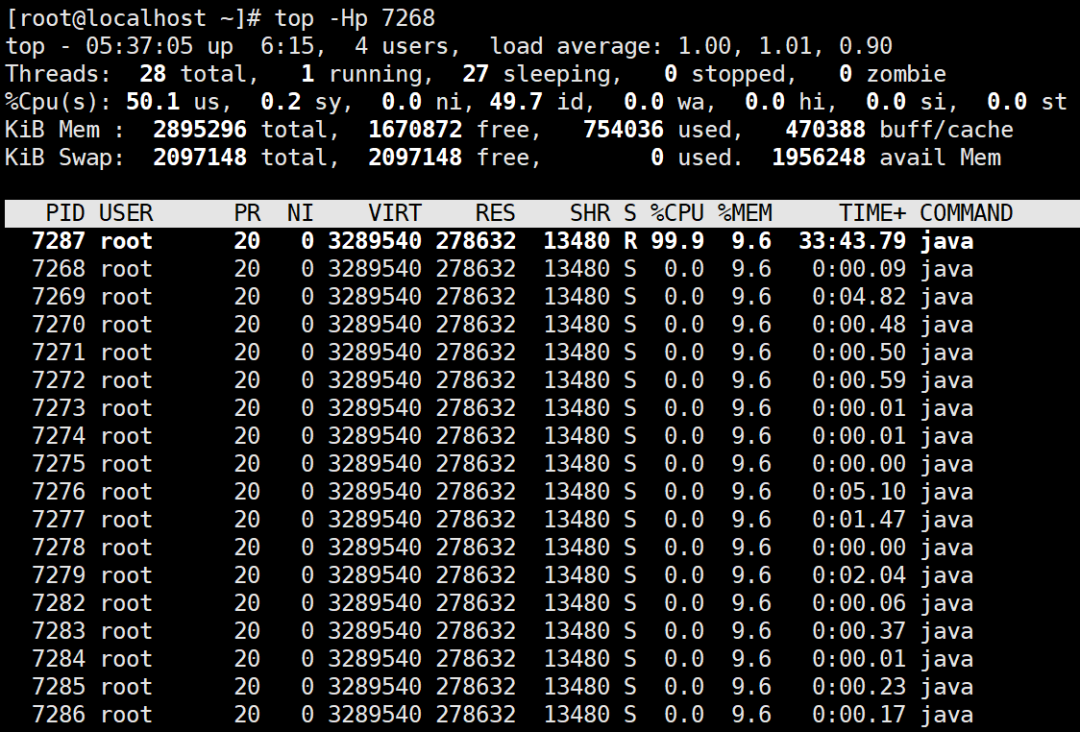
You can see that the thread id is 7287, and the thread has been occupying cpu
(3) Convert thread number to hexadecimal
[root@localhost ~]# printf "%x" 7287
1c77
Write down this hexadecimal number. We'll use it next
(4) Check the thread stack with jstack tool
[root@localhost ~]# jstack 7268 | grep 1c77 -A 10
"http-nio-8080-exec-2" #16 daemon prio=5 os_prio=0 tid=0x00007fb66ce81000 nid=0x1c77 runnable [0x00007fb639ab9000]
   java.lang.Thread.State: RUNNABLE
 at com.spareyaya.jvm.service.EndlessLoopService.service(EndlessLoopService.java:19)
 at com.spareyaya.jvm.controller.JVMController.endlessLoop(JVMController.java:30)
 at sun.reflect.NativeMethodAccessorImpl.invoke0(Native Method)
 at sun.reflect.NativeMethodAccessorImpl.invoke(NativeMethodAccessorImpl.java:62)
 at sun.reflect.DelegatingMethodAccessorImpl.invoke(DelegatingMethodAccessorImpl.java:43)
 at java.lang.reflect.Method.invoke(Method.java:498)
 at org.springframework.web.method.support.InvocableHandlerMethod.doInvoke(InvocableHandlerMethod.java:190)
 at org.springframework.web.method.support.InvocableHandlerMethod.invokeForRequest(InvocableHandlerMethod.java:138)
 at org.springframework.web.servlet.mvc.method.annotation.ServletInvocableHandlerMethod.invokeAndHandle(ServletInvocableHandlerMethod.java:105)
Output the current thread stack through the jstack tool, and then locate the running status of this thread through the grep command combined with the hexadecimal id of the thread obtained in the previous step. 7268 after jstack is the process number located in step (1), and the thread number located in steps (2) and (3) after grep.
From the output result, you can see that this thread is running and executing com spareyaya. jvm. service. EndlessLoopService. For the service method, the code line number is 19 lines, so you can go to line 19 of the code and find the code block where it is located to see if it is in a loop, so as to locate the problem.
deadlock
Deadlock is not as obvious as the first scenario. web applications must be multi-threaded programs that serve multiple requests. After a deadlock occurs, the deadlock thread is in the WAITING state (WAITING or TIMED_WAITING). The WAITING thread does not occupy cpu and consumes limited memory. In the performance, it may be that the request cannot be made and finally times out. When there are few deadlocks, this situation is not easy to find.
You can use the jstack tool to view
(1) jps view java process
[root@localhost ~]# jps -l
8737 sun.tools.jps.Jps
8682 jvm-0.0.1-SNAPSHOT.jar
(2) jstack view deadlock issues
Because web applications often have many working threads, especially in the case of high concurrency, the output content of this command will be very large. The biggest advantage of jstack is that it will output the deadlock information (including what thread generated it) to the end, so we only need to see the final content
Java stack information for the threads listed above:
===================================================
"Thread-4":
 at com.spareyaya.jvm.service.DeadLockService.service2(DeadLockService.java:35)
 - waiting to lock <0x00000000f5035ae0> (a java.lang.Object)
 - locked <0x00000000f5035af0> (a java.lang.Object)
 at com.spareyaya.jvm.controller.JVMController.lambda$deadLock$1(JVMController.java:41)
 at com.spareyaya.jvm.controller.JVMController$$Lambda$457/1776922136.run(Unknown Source)
 at java.lang.Thread.run(Thread.java:748)
"Thread-3":
 at com.spareyaya.jvm.service.DeadLockService.service1(DeadLockService.java:27)
 - waiting to lock <0x00000000f5035af0> (a java.lang.Object)
 - locked <0x00000000f5035ae0> (a java.lang.Object)
 at com.spareyaya.jvm.controller.JVMController.lambda$deadLock$0(JVMController.java:37)
 at com.spareyaya.jvm.controller.JVMController$$Lambda$456/474286897.run(Unknown Source)
 at java.lang.Thread.run(Thread.java:748)

Found 1 deadlock.
A deadlock is found and the reason is clear at a glance.
Memory leak
As we all know, the biggest difference between java and c + + is that the former automatically reclaims memory that is no longer used, while the latter requires programmers to release it manually. In c + +, memory leaks occur if we forget to free memory. However, don't think that if the jvm helps us reclaim memory, there will be no memory leakage.
After a memory leak occurs in the program, the available memory of the process will slowly decrease, and the final result is to throw an OOM error. After an OOM error occurs, you may think that the memory is not large enough, so increase the - Xmx parameter and restart the application. As a result, OOM will still appear after a period of time. Finally, the maximum heap memory can no longer be adjusted. As a result, the application can only be restarted at regular intervals.
Another possible manifestation of a memory leak is that the response time of the request becomes longer. This is because frequent GC pauses all other threads (Stop The World).
In order to simulate this scenario, the following program is used
import java.util.concurrent.ExecutorService;
import java.util.concurrent.Executors;
public class Main {
    public static void main(String[] args) {
        Main main = new Main();
        while (true) {
            try {
                Thread.sleep(1);
            } catch (InterruptedException e) {
                e.printStackTrace();
            }
            main.run();
        }
    }

    private void run() {
        ExecutorService executorService = Executors.newCachedThreadPool();
        for (int i = 0; i < 10; i++) {
            executorService.execute(() -> {
                // do something...
            });
        }
    }
}
Operating parameters are-Xms20m -Xmx20m -XX:+PrintGC,Turn down the available memory, and when it happens gc The operation results are as follows
...
[GC (Allocation Failure)  12776K->10840K(18432K), 0.0309510 secs]
[GC (Allocation Failure)  13400K->11520K(18432K), 0.0333385 secs]
[GC (Allocation Failure)  14080K->12168K(18432K), 0.0332409 secs]
[GC (Allocation Failure)  14728K->12832K(18432K), 0.0370435 secs]
[Full GC (Ergonomics)  12832K->12363K(18432K), 0.1942141 secs]
[Full GC (Ergonomics)  14923K->12951K(18432K), 0.1607221 secs]
[Full GC (Ergonomics)  15511K->13542K(18432K), 0.1956311 secs]
...
[Full GC (Ergonomics)  16382K->16381K(18432K), 0.1734902 secs]
[Full GC (Ergonomics)  16383K->16383K(18432K), 0.1922607 secs]
[Full GC (Ergonomics)  16383K->16383K(18432K), 0.1824278 secs]
[Full GC (Allocation Failure)  16383K->16383K(18432K), 0.1710382 secs]
[Full GC (Ergonomics)  16383K->16382K(18432K), 0.1829138 secs]
[Full GC (Ergonomics) Exception in thread "main"  16383K->16382K(18432K), 0.1406222 secs]
[Full GC (Allocation Failure)  16382K->16382K(18432K), 0.1392928 secs]
[Full GC (Ergonomics)  16383K->16382K(18432K), 0.1546243 secs]
[Full GC (Ergonomics)  16383K->16382K(18432K), 0.1755271 secs]
[Full GC (Ergonomics)  16383K->16382K(18432K), 0.1699080 secs]
[Full GC (Allocation Failure)  16382K->16382K(18432K), 0.1697982 secs]
[Full GC (Ergonomics)  16383K->16382K(18432K), 0.1851136 secs]
[Full GC (Allocation Failure)  16382K->16382K(18432K), 0.1655088 secs]
java.lang.OutOfMemoryError: Java heap space
It can be seen that although it has been gc, it occupies more and more memory, indicating that some objects of the program cannot be recycled. However, the above program objects are defined in the method and belong to local variables. After the method operation results, the referenced objects of the local variables should be recycled in gc, but obviously not here.
In order to find out which objects can not be recycled, we add the running parameter - XX: + heapdumponoutofmemoryerror - XX: heapdumppath = heap Bin means dump the heap memory information when OOM occurs. Run the program until it is abnormal, and get heap Dump file, and then we analyze it with the help of the MAT plug-in of eclipse. If it is not installed, it needs to be installed first.
Then file - > Open heap dump, Then select the file just dumped, and select Leak Suspects
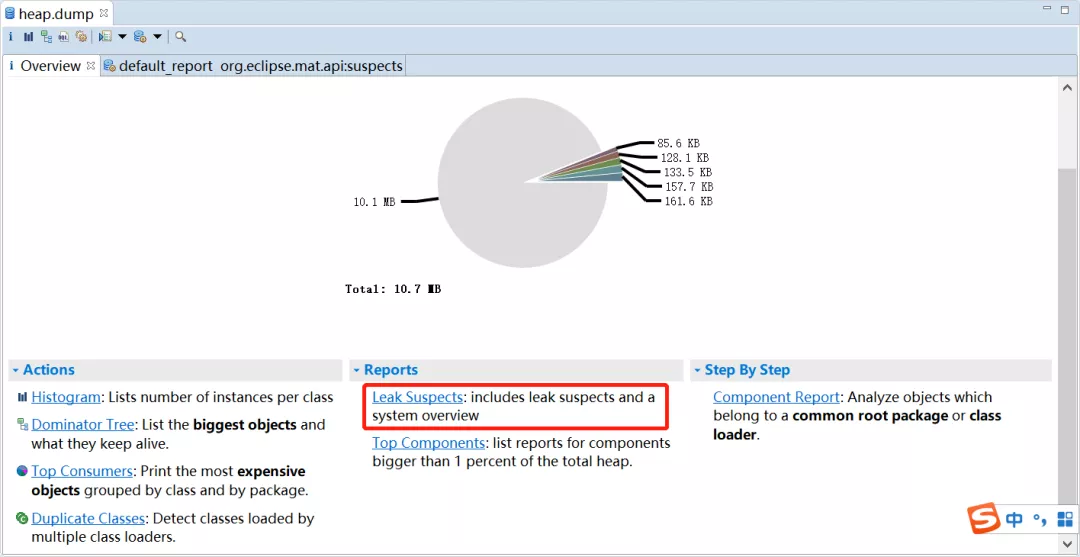
MAT lists all objects that may have memory leaks
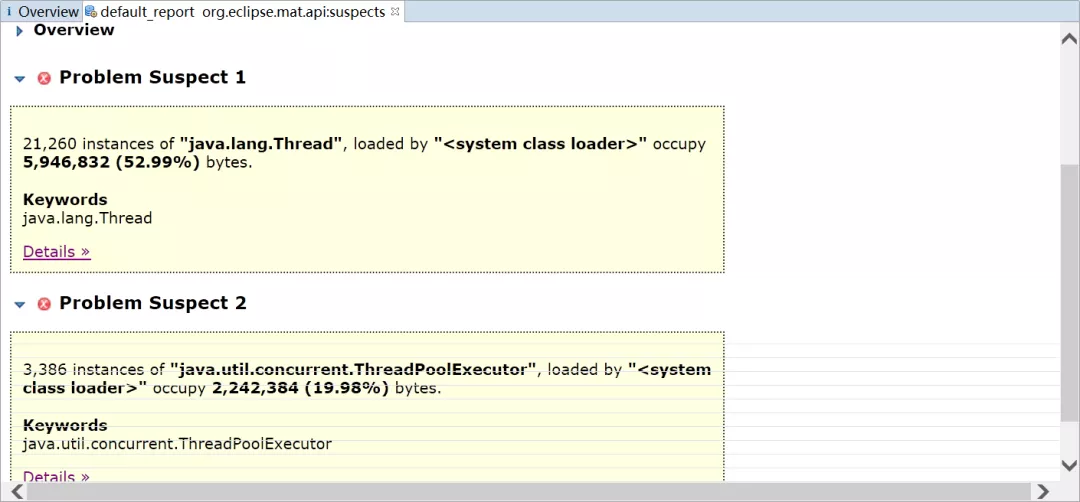
You can see that there are 21260 Thread objects and 3386 ThreadPoolExecutor objects. If you look at Java util. concurrent. According to the source code of ThreadPoolExecutor, it can be found that in order to reuse threads, the thread pool will continue to wait for new tasks, and the threads will not be recycled. You need to call its shutdown() method to stop the thread pool after executing tasks.
In fact, the thread pool is defined as a local variable. A good practice is to set it as a singleton.
The above is just one of them
For online applications, the memory is often set to be very large. In this way, the file dump from the memory snapshot during OOM will be very large, which may be too large to be analyzed on the local computer (because the memory is not enough to open the dump file). Here is another solution:
(1) Locate the process number with jps
C:\Users\spareyaya\IdeaProjects\maven-project\target\classes\org\example\net>jps -l
24836 org.example.net.Main
62520 org.jetbrains.jps.cmdline.Launcher
129980 sun.tools.jps.Jps
136028 org.jetbrains.jps.cmdline.Launcher
Because you already know which application has OOM, you can directly use jps to find the process number 135988
(2) Analyzing gc activity with jstat
Jstat is a tool for statistics of java process memory usage and gc activity. There can be many parameters. You can view all parameters and their meanings through jstat -help
C:\Users\spareyaya\IdeaProjects\maven-project\target\classes\org\example\net>jstat -gcutil -t -h8 24836 1000
Timestamp         S0     S1     E      O      M     CCS    YGC     YGCT    FGC    FGCT     GCT
           29.1  32.81   0.00  23.48  85.92  92.84  84.13     14    0.339     0    0.000    0.339
           30.1  32.81   0.00  78.12  85.92  92.84  84.13     14    0.339     0    0.000    0.339
           31.1   0.00   0.00  22.70  91.74  92.72  83.71     15    0.389     1    0.233    0.622
The above command means the output of gc, the output time, a line header information is output every 8 lines, the statistical process number is 24836, and the information is output every 1000 milliseconds.
The output information is that Timestamp is the time from the start of jvm, S0, S1 and E are the two survivors and Eden of the new generation, O is the old generation area, M is the Metaspace, CCS uses the compression ratio, YGC and YGCT are the times and time of the new generation gc, FGC and FGCT are the times and time of the old generation gc, and GCT is the total time of gc. Although gc has occurred, the memory occupancy rate of the older generation has not decreased at all, indicating that some objects cannot be recycled (of course, it does not rule out that these objects are really useful).
(3) dump memory snapshot with jmap tool
jmap can dump the memory snapshot of the specified java process. The effect is the same as the first processing method. The difference is that it can do it without waiting for OOM, and the dump snapshot will be much smaller.
jmap -dump:live,format=b,file=heap.bin 24836
You will get heap Bin memory snapshot file, and then you can analyze it with eclipse.