Detailed information about the memory occupied by innodb_buffer_pool can be counted according to the dimensions of the library table
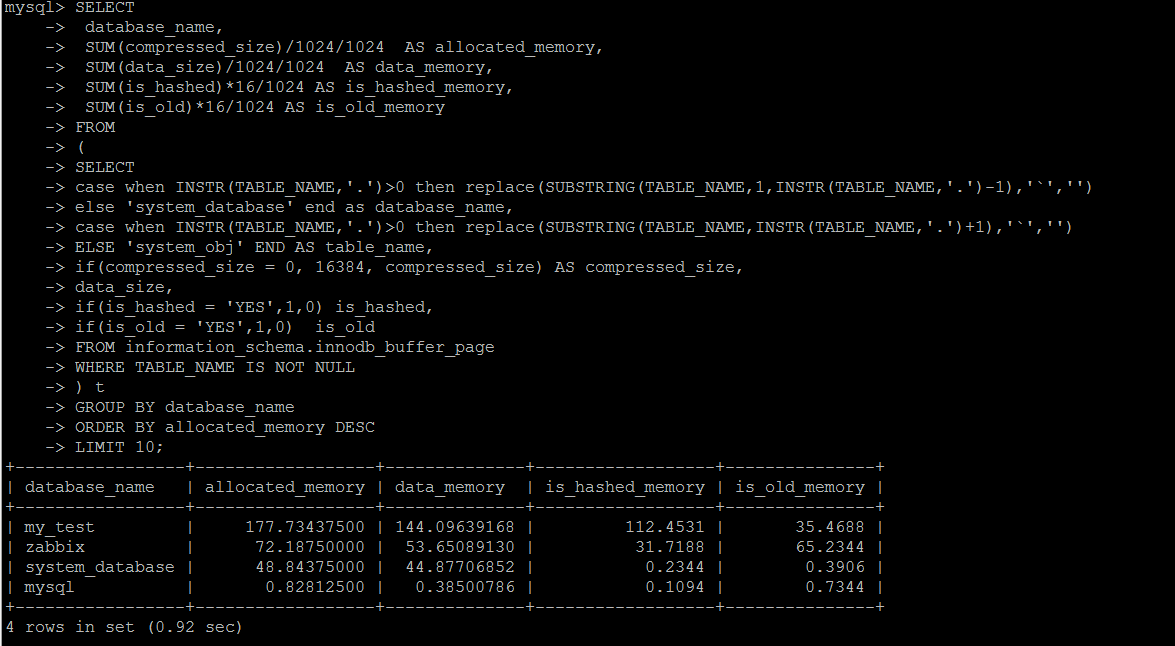
SET SESSION TRANSACTION ISOLATION LEVEL READ UNCOMMITTED ;

SELECT
     database_name,
     SUM(compressed_size)/1024/1024  AS allocated_memory,
     SUM(data_size)/1024/1024  AS data_memory,
     SUM(is_hashed)*16/1024 AS is_hashed_memory,
     SUM(is_old)*16/1024 AS is_old_memory
FROM
(
    SELECT
        case when INSTR(TABLE_NAME,'.')>0 then replace(SUBSTRING(TABLE_NAME,1,INSTR(TABLE_NAME,'.')-1),'`','')
        else     'system_database' end as database_name,
        case when INSTR(TABLE_NAME,'.')>0 then replace(SUBSTRING(TABLE_NAME,INSTR(TABLE_NAME,'.')+1),'`','')
        ELSE 'system_obj' END AS table_name,
        if(compressed_size = 0, 16384, compressed_size) AS compressed_size,
        data_size,
        if(is_hashed = 'YES',1,0) is_hashed,
        if(is_old = 'YES',1,0)  is_old
    FROM information_schema.innodb_buffer_page
    WHERE TABLE_NAME IS NOT NULL
) t
GROUP BY database_name
ORDER BY allocated_memory DESC
LIMIT 10;
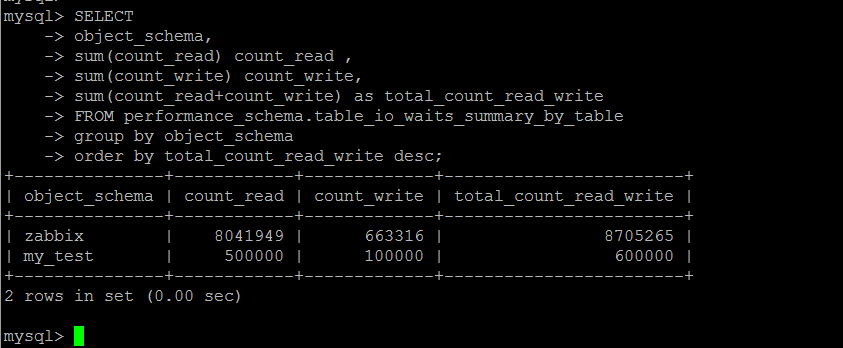
Based on the statistics of the number of rows read and written by the table, this is a cumulative value. Simply looking at the value itself, the individual feels that it is of little significance. It is necessary to collect and calculate the difference regularly in order to have reference significance.
The following is the reading and writing of statistical tables at the library level.
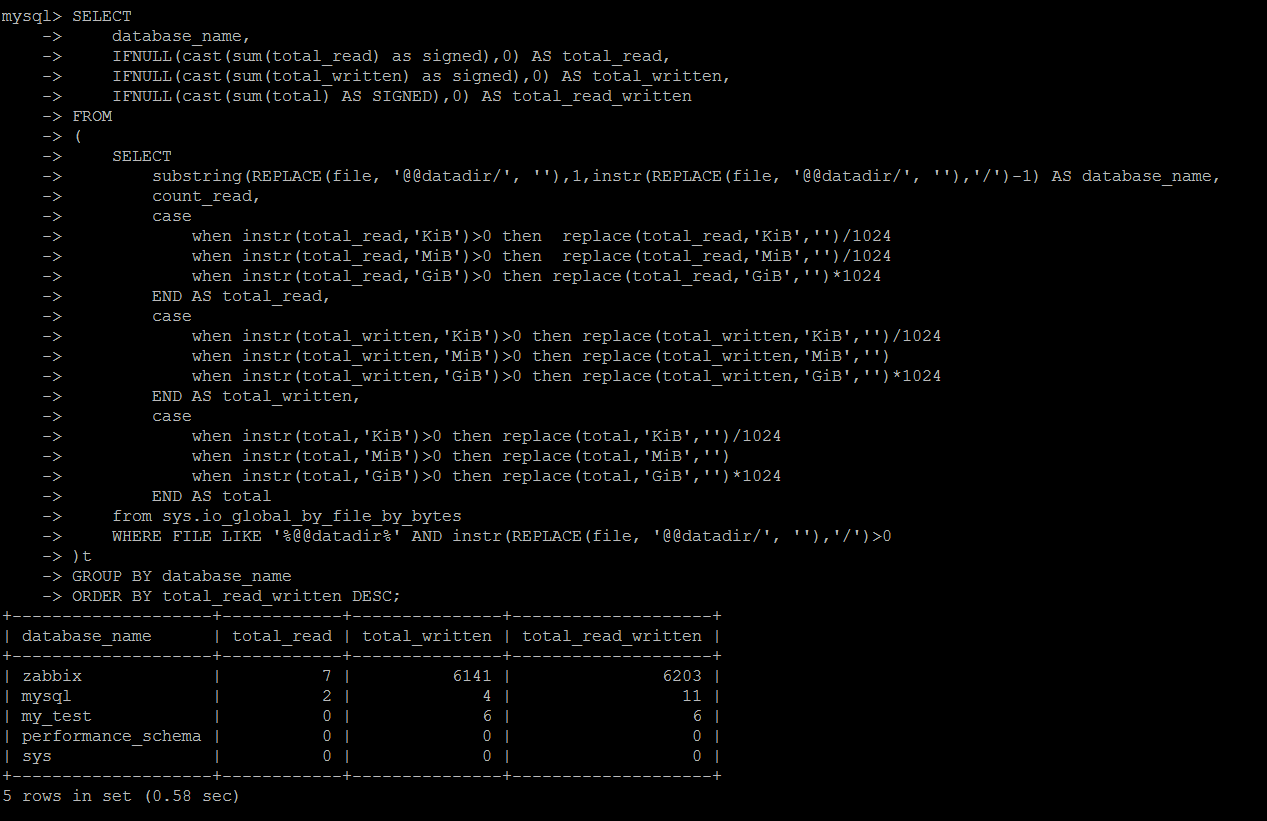
SET SESSION TRANSACTION ISOLATION LEVEL READ UNCOMMITTED ;


SELECT
    database_name,
    IFNULL(cast(sum(total_read) as signed),0) AS total_read,
    IFNULL(cast(sum(total_written) as signed),0) AS total_written,
    IFNULL(cast(sum(total) AS SIGNED),0) AS total_read_written
FROM
(
    SELECT
        substring(REPLACE(file, '@@datadir/', ''),1,instr(REPLACE(file, '@@datadir/', ''),'/')-1) AS database_name,
        count_read,
        case
            when instr(total_read,'KiB')>0 then  replace(total_read,'KiB','')/1024
            when instr(total_read,'MiB')>0 then  replace(total_read,'MiB','')/1024
            when instr(total_read,'GiB')>0 then replace(total_read,'GiB','')*1024
        END AS total_read,
        case
            when instr(total_written,'KiB')>0 then replace(total_written,'KiB','')/1024
            when instr(total_written,'MiB')>0 then replace(total_written,'MiB','')
            when instr(total_written,'GiB')>0 then replace(total_written,'GiB','')*1024
        END AS total_written,
        case
            when instr(total,'KiB')>0 then replace(total,'KiB','')/1024
            when instr(total,'MiB')>0 then replace(total,'MiB','')
            when instr(total,'GiB')>0 then replace(total,'GiB','')*1024
        END AS total
    from sys.io_global_by_file_by_bytes
    WHERE FILE LIKE '%@@datadir%' AND instr(REPLACE(file, '@@datadir/', ''),'/')>0
)t
GROUP BY database_name
ORDER BY total_read_written DESC;
TOP SQL Statistics
Topsql can be counted in terms of execution time, blocking time, number of rows returned, etc.
In addition, last_seen can be filtered according to the time, and top sql can be counted in a recent period of time.
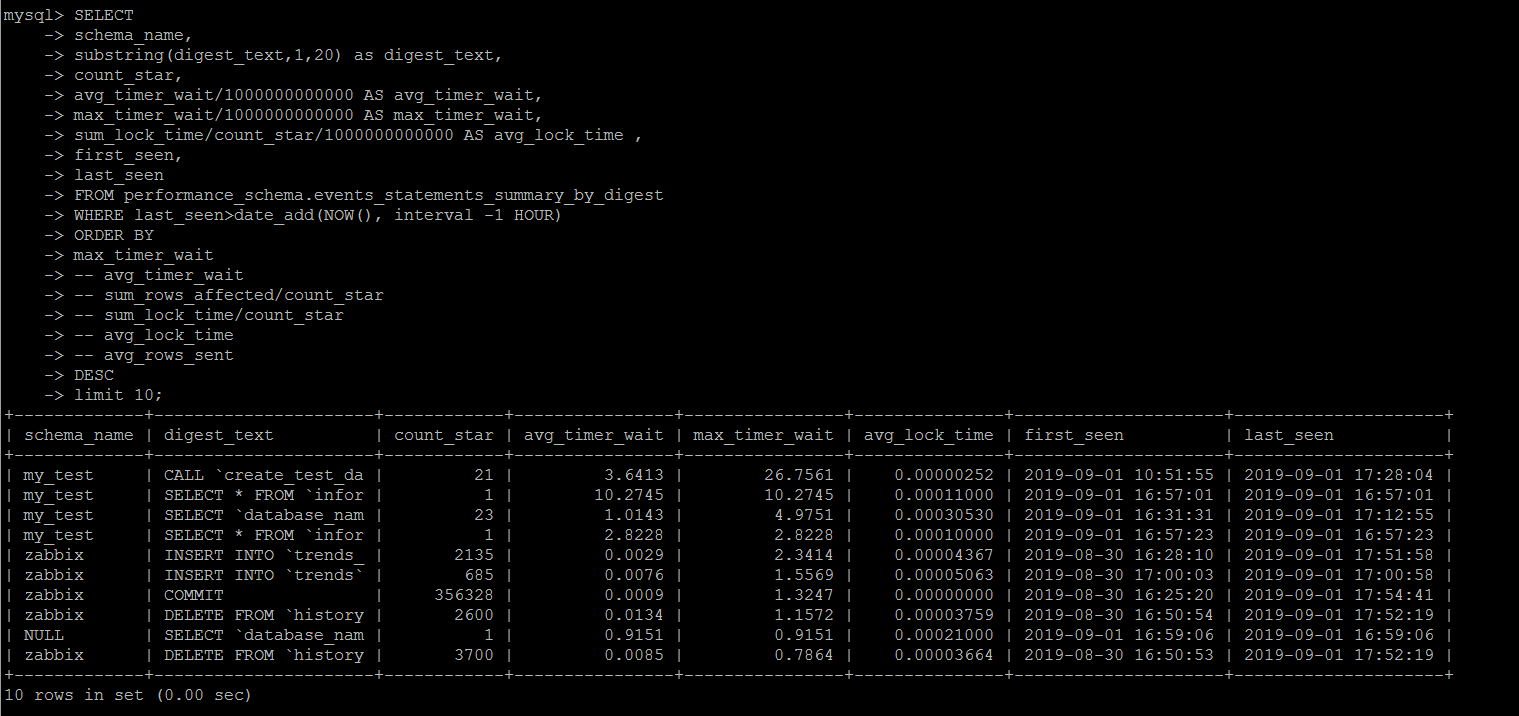
SET SESSION TRANSACTION ISOLATION LEVEL READ UNCOMMITTED ;

SELECT
    schema_name,
    digest_text,
    count_star,
    avg_timer_wait/1000000000000 AS avg_timer_wait,
    max_timer_wait/1000000000000 AS max_timer_wait,
    sum_lock_time/count_star/1000000000000 AS avg_lock_time ,
    sum_rows_affected/count_star AS avg_rows_affected,
    sum_rows_sent/count_star AS avg_rows_sent ,
    sum_rows_examined/count_star AS avg_rows_examined,
    sum_created_tmp_disk_tables/count_star AS avg_create_tmp_disk_tables,
    sum_created_tmp_tables/count_star AS avg_create_tmp_tables,
    sum_select_full_join/count_star AS avg_select_full_join,
    sum_select_full_range_join/count_star AS avg_select_full_range_join,
    sum_select_range/count_star AS avg_select_range,
    sum_select_range_check/count_star AS avg_select_range,
    first_seen,
    last_seen
FROM performance_schema.events_statements_summary_by_digest
WHERE last_seen>date_add(NOW(), interval -1 HOUR)
ORDER BY
max_timer_wait
-- avg_timer_wait
-- sum_rows_affected/count_star
-- sum_lock_time/count_star
-- avg_lock_time
-- avg_rows_sent
DESC
limit 10;
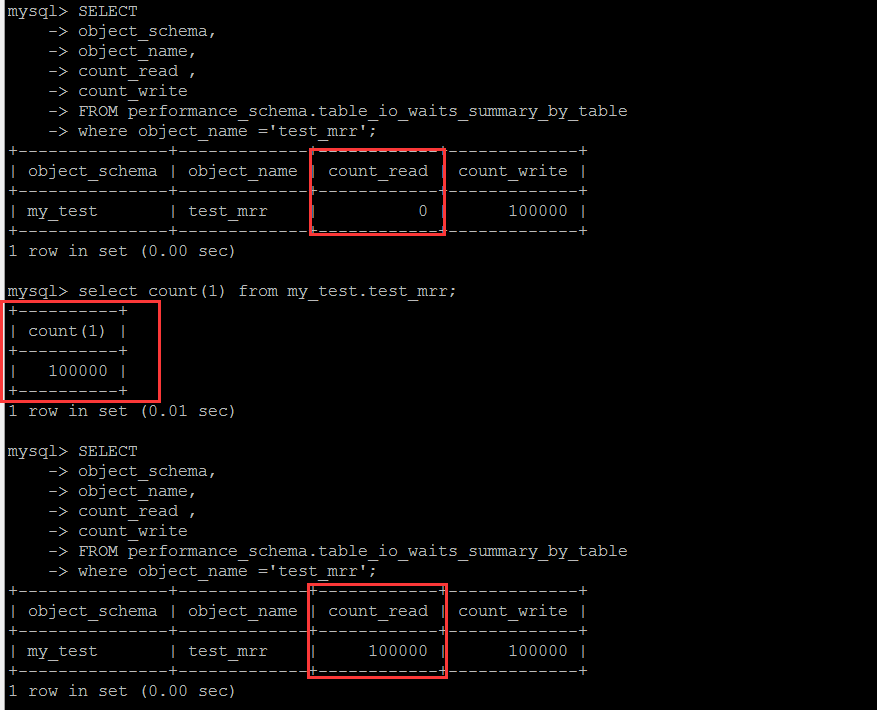
It should be noted that this statistic is based on the resources consumed by MySQL to execute a transaction, rather than a statement. The author was confused for a while at first, to give a simple example.
Reference to the following, here is a stored procedure that writes data in a loop. The calling method is call create_test_data(N), which writes N test data.
For example, call create_test_data(1000000) is to write 100W test data. This execution process takes several minutes. According to the author's test example, the dimension of avg_timer_wait is absolutely a TOP SQL.
However, during the query, it was never found that the call of this stored procedure was listed as TOP SQL. Later, we tried to add something inside the stored procedure, and then we collected the whole TOP SQL smoothly.
So the statistics in performance_schema.events_statements_summary_by_digest are based on transactions, not on the execution time of a batch.
CREATE DEFINER=`root`@`%` PROCEDURE `create_test_data`(
    IN `loopcnt` INT
)
LANGUAGE SQL
NOT DETERMINISTIC
CONTAINS SQL
SQL SECURITY DEFINER
COMMENT ''
BEGIN
    -- START TRANSACTION;
        while loopcnt>0 do
            insert into test_mrr(rand_id,create_date) values (RAND()*100000000,now(6));
            set loopcnt=loopcnt-1;
        end while;
    -- commit;
END
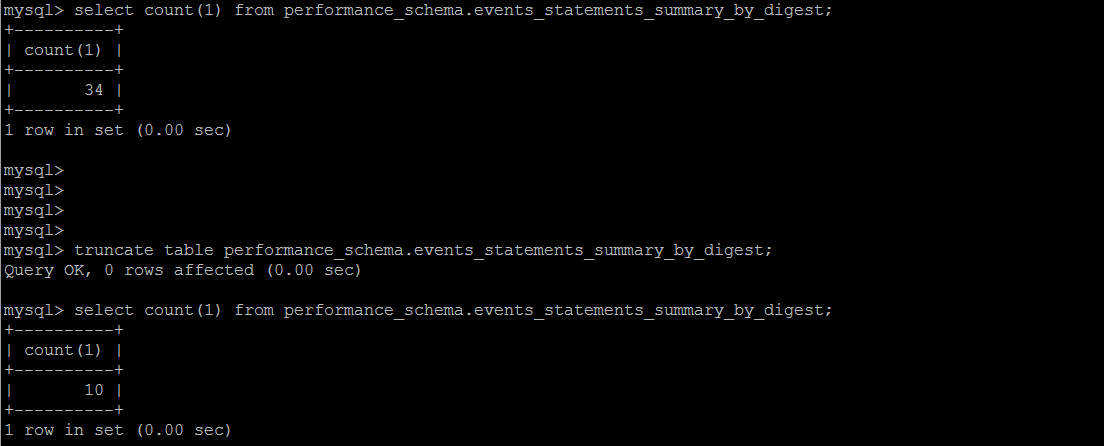
Another interesting point is that this system table is one of the few truncate-enabled tables, but it is also a process of continuous collection internally.
Index usage statistics
Based on the system table performance_schema.table_io_waits_summary_by_index_usage, the dimension of statistics is also "the statistics of rows returned by an index query".
Statistics can be made according to which indexes are used most or least.
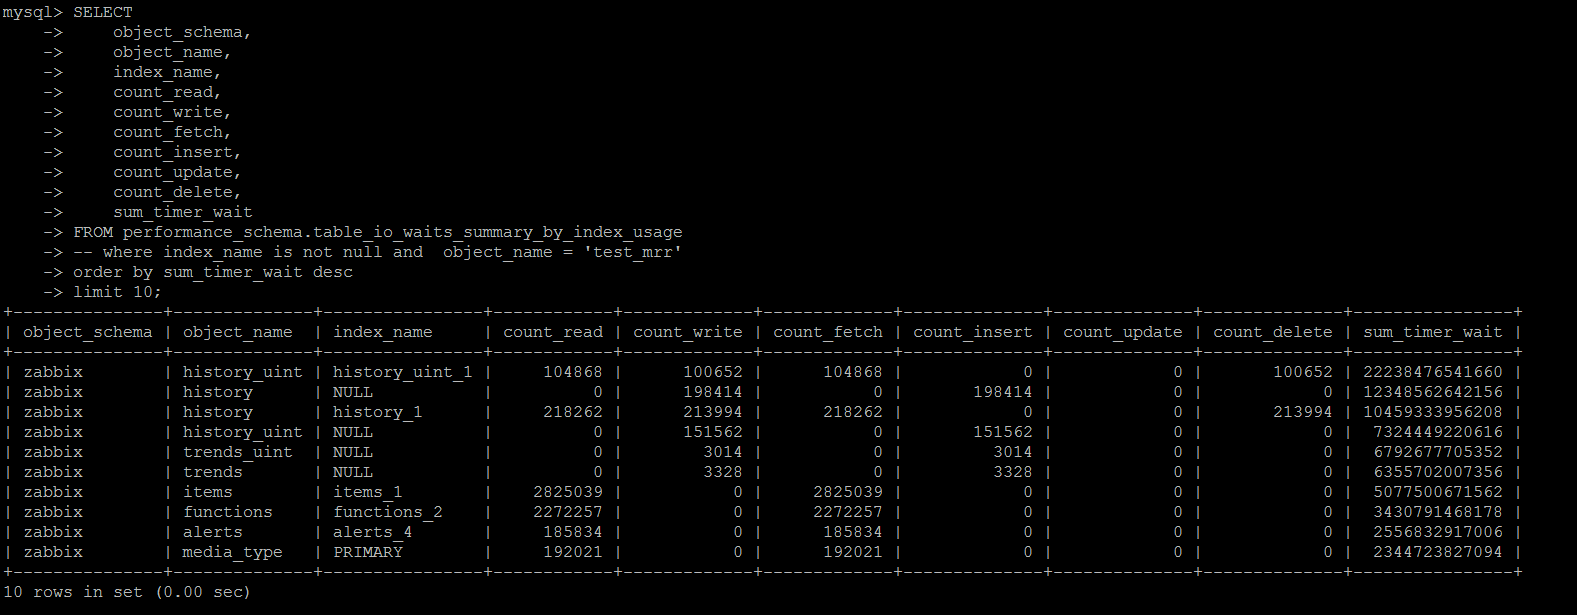
However, there is a potential misunderstanding in this statistics:
count_read,count_write,count_fetch,count_insert,count_update,count_delete count the number of rows affected when an index is used on the index. sum_timer_wait is the accumulated waiting time on the index.
If the index is used, but no data is affected (i.e., no DML statement condition, no hit data), count *** will not be counted, but sum_timer_wait will be counted.
There is a misleading place. This index has not hit many times, but it produces a lot of timer_wait. When the index sees similar information, it can not delete the index rashly.
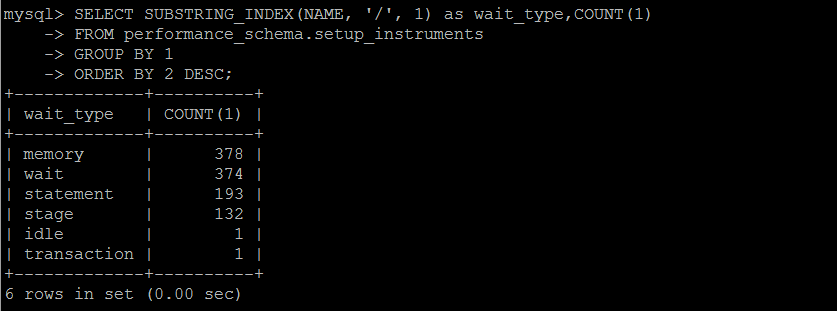
Waiting event statistics
Every action in MySQL database needs to wait (a certain amount of time to complete). There are more than 1000 waiting events, which belong to unknown categories. Each version is different, and not all waiting events are enabled by default.
Personally, I think that the waiting event is only for reference and does not have diagnostic value. Even if the database is re-optimized or low-load, for a period of time, some events will still accumulate a large number of waiting events.
The waiting events of these events are not necessarily negative, such as the lock waiting of things, which will inevitably be generated in the process of concurrent execution. The statistical results of the waiting events are also cumulative. Simply looking at a direct value does not have any reference significance.
Unless it is collected regularly and calculated differentially, it will be of referential significance according to the actual situation.
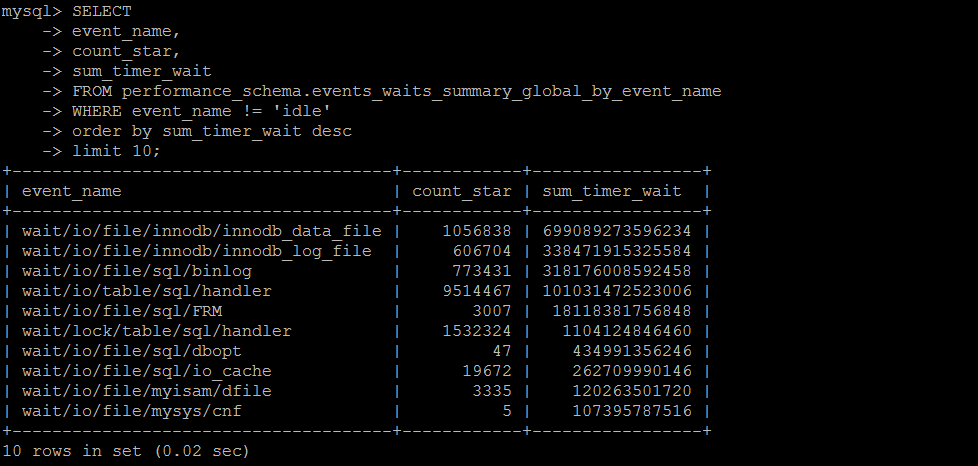
SET SESSION TRANSACTION ISOLATION LEVEL READ UNCOMMITTED ;

SELECT SUBSTRING_INDEX(NAME, '/', 1) as wait_type,COUNT(1)
FROM performance_schema.setup_instruments
GROUP BY 1
ORDER BY 2 DESC;


SELECT
event_name,
count_star,
sum_timer_wait
FROM performance_schema.events_waits_summary_global_by_event_name
WHERE event_name != 'idle'
order by sum_timer_wait desc
limit 100;
Finally, it should be noted that:
1. The data provided by MySQL in many system tables (views) simply look at the value itself, because it is a cumulative value, which is of little significance to individuals, especially avg ***. It needs to be used for reference in combination with various comprehensive factors.
2. Any query of system tables may have some impact on the system performance itself. Do not collect data statistically when the system may have a greater negative impact.
Reference resources: