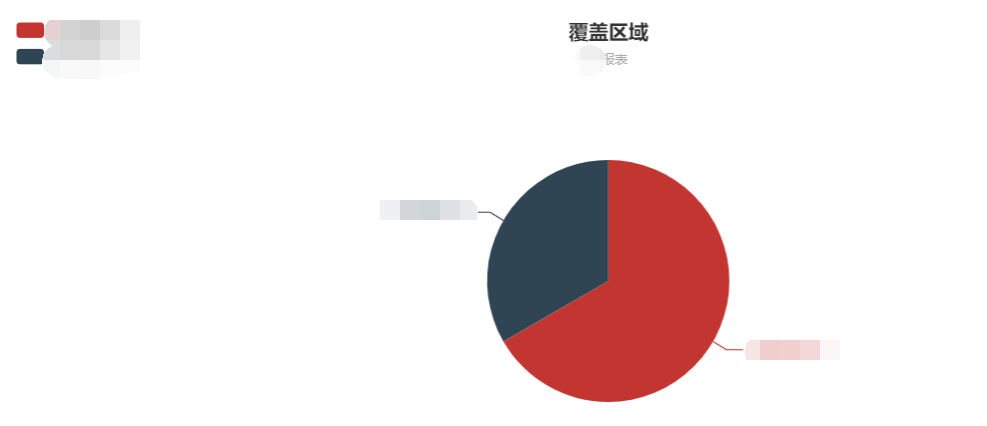
First, introduce the echarts file:
<script src="/resource/js/echarts.js"></script>
Use html to set the width and height:
                    <div class="main_statistics main_statistics1">
                        <! -- prepare a DOM with size (width and height) for ECharts -- >
                        <div id="main1" style="width:100%;height:400px;"></div>
                    </div>
1. Pie chart:

The following can directly copy the code snippet of the pie chart graph, and pass in the data at the corresponding location:
//Daily pie chart
    function sunPie() {
        // Initialize the echarts instance based on the prepared dom
        var myChart = echarts.init(document.getElementById('main1'));
        var option = {
            title: {
                text: 'Coverage area',
                subtext: 'Daily report',
                x: 'center'
            },
            tooltip: {
                trigger: 'item',
                formatter: "{a} <br/>{b} : {c} ({d}%)"
            },
            legend: {
                orient: 'vertical',
                left: 'left',
                data: global_sun_names
            },
            series: [
                {
                    name: 'Access source',
                    type: 'pie',
                    radius: '55%',
                    center: ['50%', '60%'],
                    data: global_sun_pie,
                    itemStyle: {
                        emphasis: {
                            shadowBlur: 10,
                            shadowOffsetX: 0,
                            shadowColor: 'rgba(0, 0, 0, 0.5)'
                        }
                    }
                }
            ]
        };
        // Use the configuration items and data you just specified to display the chart.
        myChart.setOption(option);
    }
Here are the figures and parameters of the line chart:

First of all, the width and height of the file to be referenced above are the same.
magicType: {type: ['line', 'bar']},This code controls line chart switching histogram.
Graphics and parameters:
  //Broken line diagram
    function lineChart() {
        // Initialize the echarts instance based on the prepared dom
        var myChart = echarts.init(document.getElementById('main'));
        // Specify configuration items and data for the chart
        var option = {
            title: {
                text: 'User growth'
            },
            tooltip: {
                trigger: 'axis'
            },
            toolbox: {
                show: true,
                feature: {
                    magicType: {type: ['line', 'bar']},
                    restore: {},
                    saveAsImage: {}
                }
            },
            legend: {
                data:['New registered user','Submitted for review']
            },
            grid: {
                left: '3%',
                right: '4%',
                bottom: '3%',
                containLabel: true
            },
            xAxis: {
                type: 'category',
                boundaryGap: false,
                data: global_line_date
            },
            yAxis: {
                type: 'value'
            },
            series: [
                {
                    name:'New registered user',
                    type:'line',
                    data:global_line_num
                },
                {
                    name:'Submitted for review',
                    type:'line',
                    data:global_line_submit
                }
            ]
        };
        // Use the configuration items and data you just specified to display the chart.
        myChart.setOption(option);
    }
When transferring parameters, different lines are used to express meanings according to different status:
var global_line_date=[];
    var global_line_num=[];
    //Line chart transfer parameters
    function chart() {
        $.ajax({
            async: false,
            type: "GET",
            url: "/count",
            data: {},
            dataType: "JSON",
            success: function (res) {
                // console.log(res);
                var data=res.data;
                data.map(function (v){
                console.log(v)
                global_line_date.push(v.date);
                global_line_num.push(v.count);
                })
                chart2();
            },
            error: function (res) {
                alert(res.message);
            }
        });
    }
    //When status==1, it is a polyline of another meaning
    var global_line_submit=[];
    function chart2() {
        $.ajax({
            async: false,
            type: "GET",
            url: "/count",
            data: {status:1},
            dataType: "JSON",
            success: function (res) {
                console.log(res);
                var data=res.data;
                data.map(function (v){
                    console.log(v)
                    global_line_submit.push(v.count);
                })

                //Broken line diagram
                lineChart();
            },
            error: function (res) {
                alert(res.message);
            }
        });
    }