The recently released Elasticsearch 6.3 contains the long-awaited SQL feature. Today, I'll introduce you to the specific usage.
First, look at the interface support
At present, the supported SQL can only query and read-only data, and cannot modify data. Therefore, our data insertion still needs to go through the previous conventional index interface.
At present, Elasticsearch supports only the following SQL commands:
| command | explain |
|---|---|
| DESC table | Field properties used to describe the index |
| SHOW COLUMNS | The function is the same as above, only alias |
| SHOW FUNCTIONS | Lists the supported functions and supports wildcard filtering |
| SHOW TABLES | Return index list |
| SELECT .. FROM table_name WHERE .. GROUP BY .. HAVING .. ORDER BY .. LIMIT .. | Commands used to execute queries |
Let's take a look at how to use them and what effect they have. We can also try them ourselves and have a look.
First, we create a piece of data:
POST twitter/doc/
{
  "name":"medcl",
  "twitter":"sql is awesome",
  "date":"2018-07-27",
  "id":123
}
RESTful calling SQL
There are three ways to execute SQL statements in ES: the first is RESTful, the second is SQL-CLI command line tool, and the third is to connect ES through JDBC. In fact, the executed SQL statements are the same. Let's explain the usage in RESTful first.
The syntax of RESTful is as follows:
POST /_xpack/sql?format=txt
{
    "query": "SELECT * FROM twitter"
}
Because the SQL feature is a free function of xpack, it is in _ xpack Under this path, we only need to pass the SQL statement to the query field. Note that the last side should not be added ; At the end, be careful not to!
When we execute the above statement, the query results are as follows:
          date          |      id       |     name      |    twitter
------------------------+---------------+---------------+---------------
2018-07-27T00:00:00.000Z|123            |medcl          |sql is awesome
ES seems to have become an SQL database. Let's see how to get all the index lists:
POST /_xpack/sql?format=txt
{
    "query": "SHOW tables"
}
Return as follows:
              name               |     type
---------------------------------+---------------
.kibana                          |BASE TABLE
.monitoring-alerts-6             |BASE TABLE
.monitoring-es-6-2018.06.21      |BASE TABLE
.monitoring-es-6-2018.06.26      |BASE TABLE
.monitoring-es-6-2018.06.27      |BASE TABLE
.monitoring-kibana-6-2018.06.21  |BASE TABLE
.monitoring-kibana-6-2018.06.26  |BASE TABLE
.monitoring-kibana-6-2018.06.27  |BASE TABLE
.monitoring-logstash-6-2018.06.20|BASE TABLE
.reporting-2018.06.24            |BASE TABLE
.triggered_watches               |BASE TABLE
.watcher-history-7-2018.06.20    |BASE TABLE
.watcher-history-7-2018.06.21    |BASE TABLE
.watcher-history-7-2018.06.26    |BASE TABLE
.watcher-history-7-2018.06.27    |BASE TABLE
.watches                         |BASE TABLE
apache_elastic_example           |BASE TABLE
forum-mysql                      |BASE TABLE
twitter
A little more. We can filter by name, such as the index beginning with Twitter. Note that wildcards are only supported % and _, Represent multiple and single characters respectively (what, I don't remember, go back to the book in the database!)
POST /_xpack/sql?format=txt
{
    "query": "SHOW TABLES 'twit%'"
}

POST /_xpack/sql?format=txt
{
    "query": "SHOW TABLES 'twitte_'"
}
The results returned above are:
     name      |     type
---------------+---------------
twitter        |BASE TABLE
If you want to view the fields and metadata of the index, see the following:
POST /_xpack/sql?format=txt
{
    "query": "DESC twitter"
}
return:
    column     |     type
---------------+---------------
date           |TIMESTAMP
id             |BIGINT
name           |VARCHAR
name.keyword   |VARCHAR
twitter        |VARCHAR
twitter.keyword|VARCHAR
Are dynamically generated fields, including the. keyword field. You can also use the following commands to view, mainly compatible with SQL syntax.
POST /_xpack/sql?format=txt
{
    "query": "SHOW COLUMNS IN twitter"
}
In addition, if you don't remember which functions ES supports, just execute the following command to get a complete list:
SHOW FUNCTIONS
The returned results are as follows, that is, all functions supported by the current version 6.3, as follows:
      name      |     type
----------------+---------------
AVG             |AGGREGATE
COUNT           |AGGREGATE
MAX             |AGGREGATE
MIN             |AGGREGATE
SUM             |AGGREGATE
STDDEV_POP      |AGGREGATE
VAR_POP         |AGGREGATE
PERCENTILE      |AGGREGATE
PERCENTILE_RANK |AGGREGATE
SUM_OF_SQUARES  |AGGREGATE
SKEWNESS        |AGGREGATE
KURTOSIS        |AGGREGATE
DAY_OF_MONTH    |SCALAR
DAY             |SCALAR
DOM             |SCALAR
DAY_OF_WEEK     |SCALAR
DOW             |SCALAR
DAY_OF_YEAR     |SCALAR
DOY             |SCALAR
HOUR_OF_DAY     |SCALAR
HOUR            |SCALAR
MINUTE_OF_DAY   |SCALAR
MINUTE_OF_HOUR  |SCALAR
MINUTE          |SCALAR
SECOND_OF_MINUTE|SCALAR
SECOND          |SCALAR
MONTH_OF_YEAR   |SCALAR
MONTH           |SCALAR
YEAR            |SCALAR
WEEK_OF_YEAR    |SCALAR
WEEK            |SCALAR
ABS             |SCALAR
ACOS            |SCALAR
ASIN            |SCALAR
ATAN            |SCALAR
ATAN2           |SCALAR
CBRT            |SCALAR
CEIL            |SCALAR
CEILING         |SCALAR
COS             |SCALAR
COSH            |SCALAR
COT             |SCALAR
DEGREES         |SCALAR
E               |SCALAR
EXP             |SCALAR
EXPM1           |SCALAR
FLOOR           |SCALAR
LOG             |SCALAR
LOG10           |SCALAR
MOD             |SCALAR
PI              |SCALAR
POWER           |SCALAR
RADIANS         |SCALAR
RANDOM          |SCALAR
RAND            |SCALAR
ROUND           |SCALAR
SIGN            |SCALAR
SIGNUM          |SCALAR
SIN             |SCALAR
SINH            |SCALAR
SQRT            |SCALAR
TAN             |SCALAR
SCORE           |SCORE
Wildcard filtering is also supported:
POST /_xpack/sql?format=txt
{
    "query": "SHOW FUNCTIONS 'S__'"
}
result:
     name      |     type
---------------+---------------
SUM            |AGGREGATE
SIN            |SCALAR
What about fuzzy search? We all know that Elasticsearch has strong search ability! In SQL, you can use the match keyword to write, as follows:
POST /_xpack/sql?format=txt
{
    "query": "SELECT SCORE(), * FROM twitter WHERE match(twitter, 'sql is') ORDER BY id DESC"
}
Finally, you can also try some other operations in SELECT, such as filtering and alias, as follows:
POST /_xpack/sql?format=txt
{
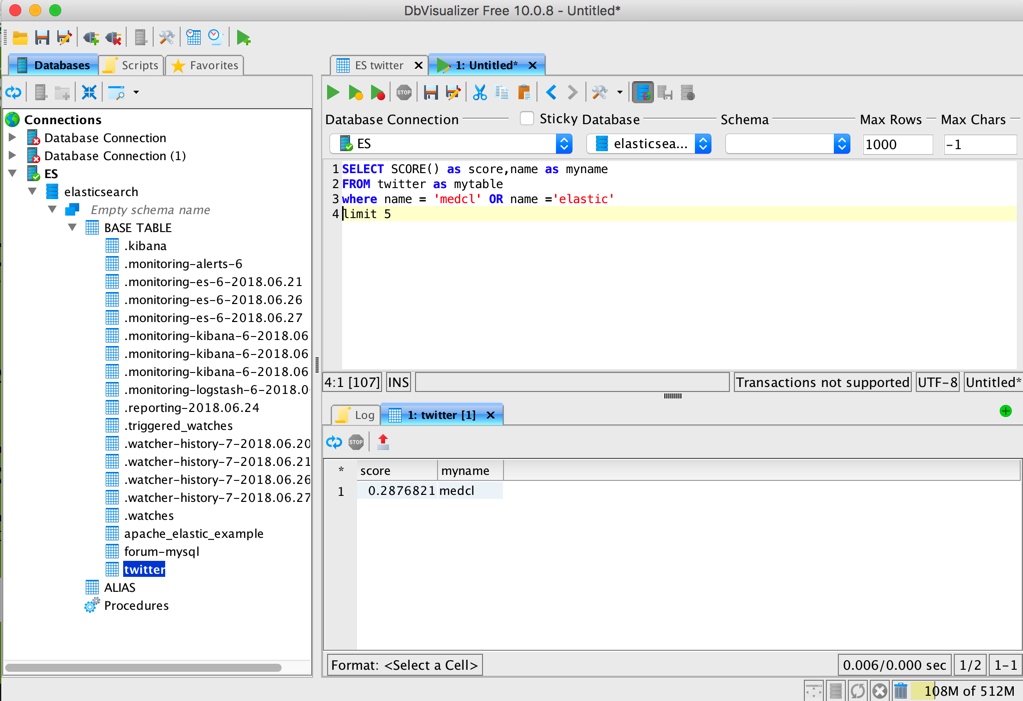
"query": "SELECT SCORE() as score,name as myname FROM twitter as mytable where name = 'medcl' OR name ='elastic' limit 5"
}The results are as follows:
     score     |    myname
---------------+---------------
0.2876821      |medcl
Or grouping and function calculation:
POST /_xpack/sql?format=txt
{
    "query": "SELECT name,max(id) as max_id FROM twitter as mytable group by name limit 5"
}
The results are as follows:
     name      |    max_id
---------------+---------------
medcl          |123.0
Use under SQL cli
The above example basically introduces the basic commands of SQL. In many cases, RESTful may not be very convenient, so you can try the CLI command-line tool to execute SQL statements and have a proper SQL operation experience.
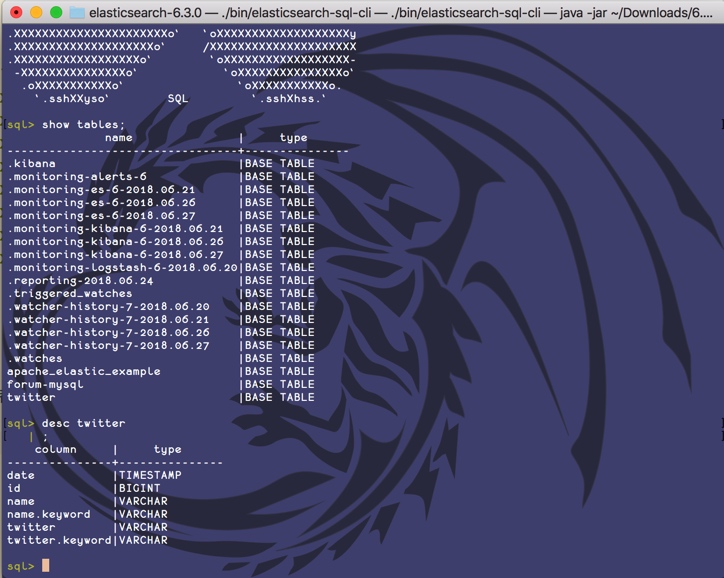
Switch to the command line and start the cli program to enter the command line interactive prompt interface, as follows:
➜  elasticsearch-6.3.0 ./bin/elasticsearch-sql-cli

     .sssssss.`                     .sssssss.
  .:sXXXXXXXXXXo`                `ohXXXXXXXXXho.
 .yXXXXXXXXXXXXXXo`            `oXXXXXXXXXXXXXXX-
.XXXXXXXXXXXXXXXXXXo`        `oXXXXXXXXXXXXXXXXXX.
.XXXXXXXXXXXXXXXXXXXXo.    .oXXXXXXXXXXXXXXXXXXXXh
.XXXXXXXXXXXXXXXXXXXXXXo``oXXXXXXXXXXXXXXXXXXXXXXy
`yXXXXXXXXXXXXXXXXXXXXXXXXXXXXXXXXXXXXXXXXXXXXXXX.
 `oXXXXXXXXXXXXXXXXXXXXXXXXXXXXXXXXXXXXXXXXXXXXo`
   `oXXXXXXXXXXXXXXXXXXXXXXXXXXXXXXXXXXXXXXXXo`
     `oXXXXXXXXXXXXXXXXXXXXXXXXXXXXXXXXXXXXo`
       `oXXXXXXXXXXXXXXXXXXXXXXXXXXXXXXXXo`
         `oXXXXXXXXXXXXXXXXXXXXXXXXXXXXo`
           .XXXXXXXXXXXXXXXXXXXXXXXXXo`
         .oXXXXXXXXXXXXXXXXXXXXXXXXo`
       `oXXXXXXXXXXXXXXXXXXXXXXXXo`   `odo`
     `oXXXXXXXXXXXXXXXXXXXXXXXXo`   `oXXXXXo`
   `oXXXXXXXXXXXXXXXXXXXXXXXXo`   `oXXXXXXXXXo`
 `oXXXXXXXXXXXXXXXXXXXXXXXXo`   `oXXXXXXXXXXXXXo`
`yXXXXXXXXXXXXXXXXXXXXXXXo`    oXXXXXXXXXXXXXXXXX.
.XXXXXXXXXXXXXXXXXXXXXXo`   `oXXXXXXXXXXXXXXXXXXXy
.XXXXXXXXXXXXXXXXXXXXo`     /XXXXXXXXXXXXXXXXXXXXX
.XXXXXXXXXXXXXXXXXXo`        `oXXXXXXXXXXXXXXXXXX-
 -XXXXXXXXXXXXXXXo`            `oXXXXXXXXXXXXXXXo`
  .oXXXXXXXXXXXo`                `oXXXXXXXXXXXo.
    `.sshXXyso`        SQL         `.sshXhss.`

sql>
When you see a huge band aid, it indicates that the SQL command line is ready. Check the index list. No, the list of data tables:
Various operations are proper. The commands tested above will not be repeated here, but the experience is different.
If you want to connect to a remote ES server, you only need to specify the server address when starting the command line tool. If encryption is available, specify the keystone file. The complete help is as follows:
➜  elasticsearch-6.3.0 ./bin/elasticsearch-sql-cli --help
Elasticsearch SQL CLI

Non-option arguments:
uri

Option                   Description
------                   -----------
-c, --check <Boolean>    Enable initial connection check on startup (default:
                           true)
-d, --debug              Enable debug logging
-h, --help               show help
-k, --keystore_location  Location of a keystore to use when setting up SSL. If
                           specified then the CLI will prompt for a keystore
                           password. If specified when the uri isn't https then
                           an error is thrown.
-s, --silent             show minimal output
-v, --verbose            show verbose output
JDBC docking
JDBC's docking capability allows us to connect with various SQL ecosystems and use many ready-made tools based on SQL to use Elasticsearch. Let's take a tool as an example.
Like other databases, to use JDBC, to download the jdbc driver of the database, we open:
Download JDBC Client | Elastic
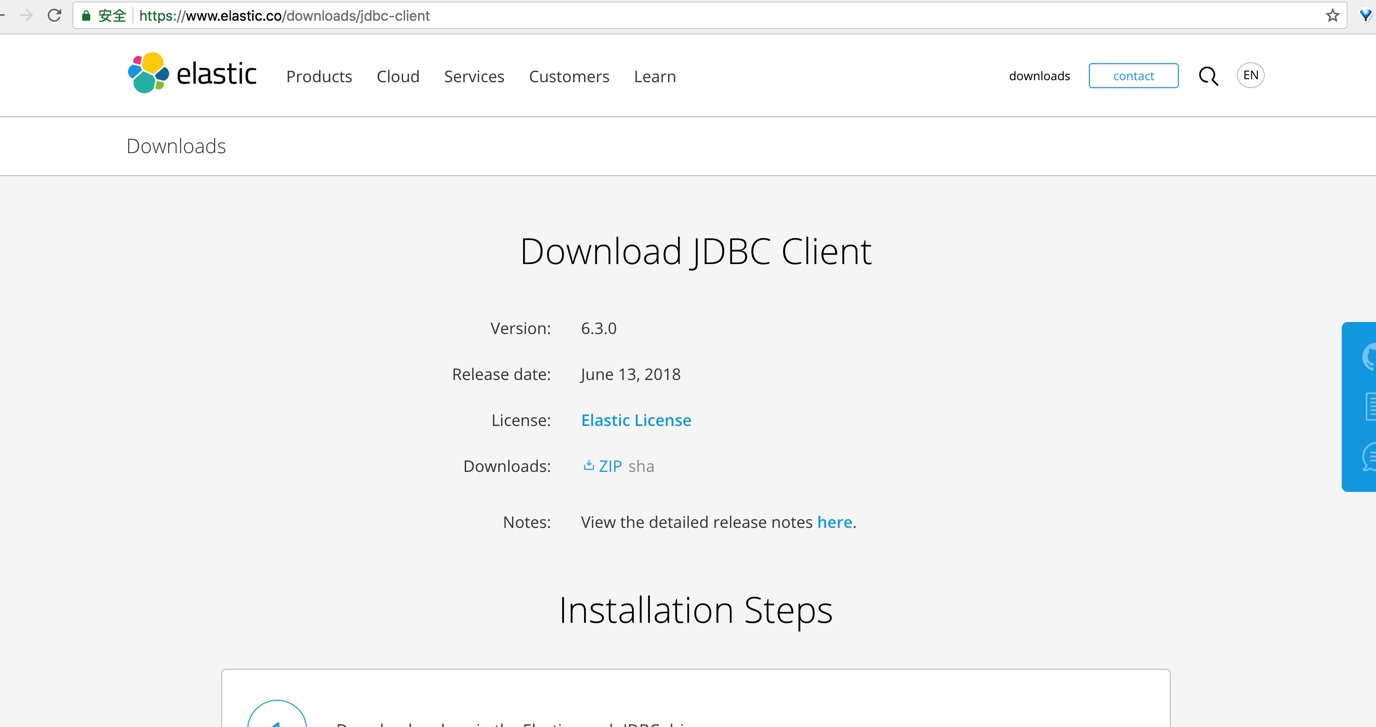
There is only one zip package download link, you can download it.
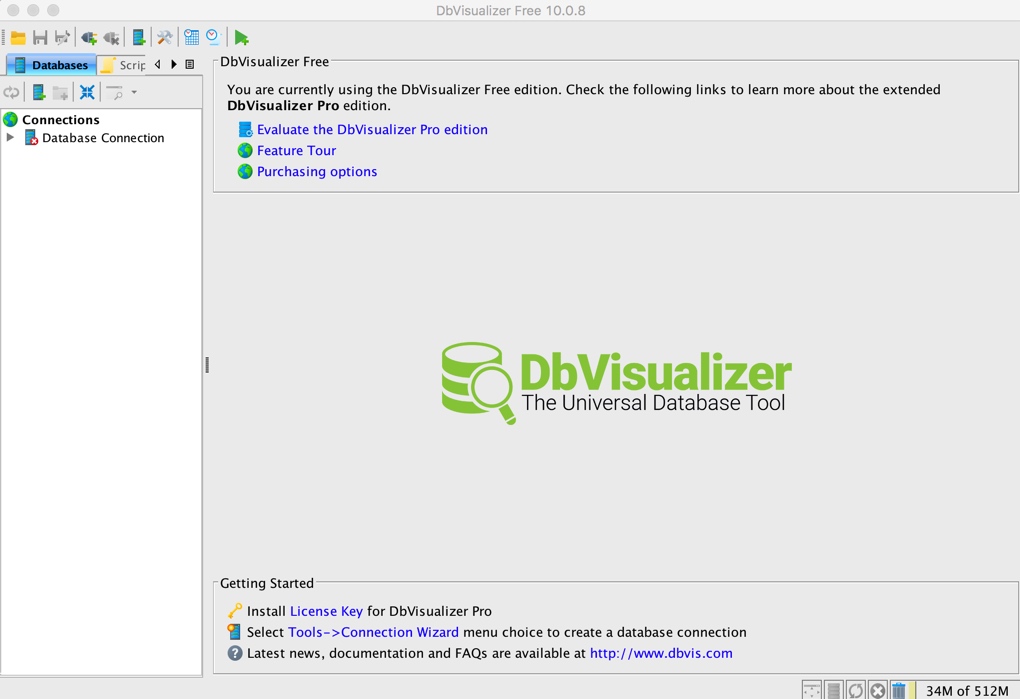
Then, we use DbVisualizer to connect to ES for operation. This is a database operation and analysis tool. The download address of DbVisualizer is: DbVisualizer - The Universal Database Tool.
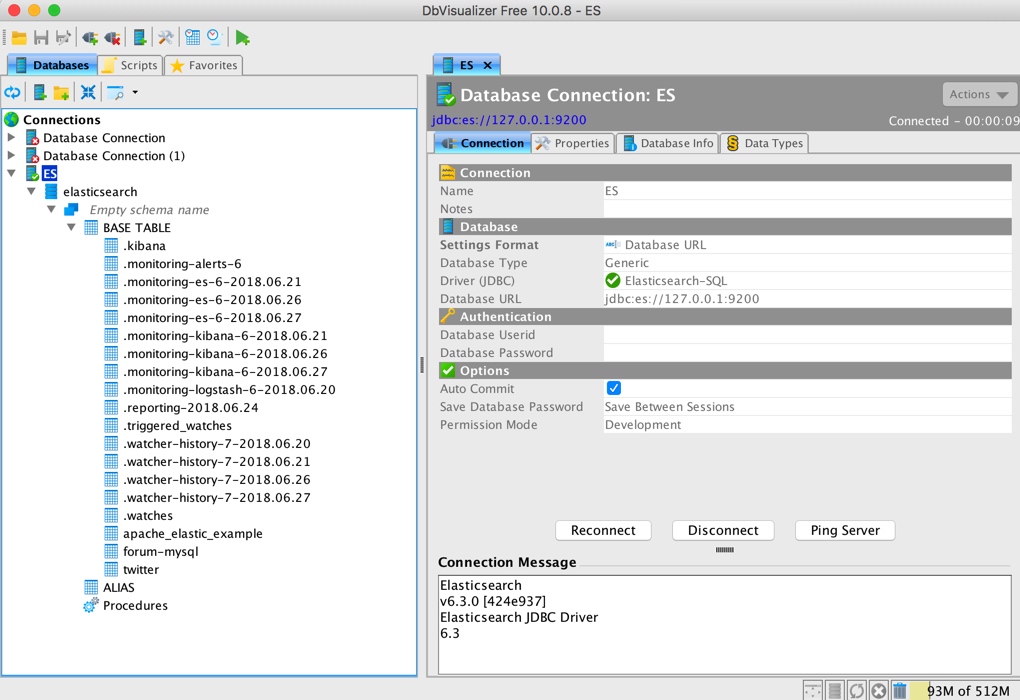
The main interface of the program after downloading, installing and starting is as follows:
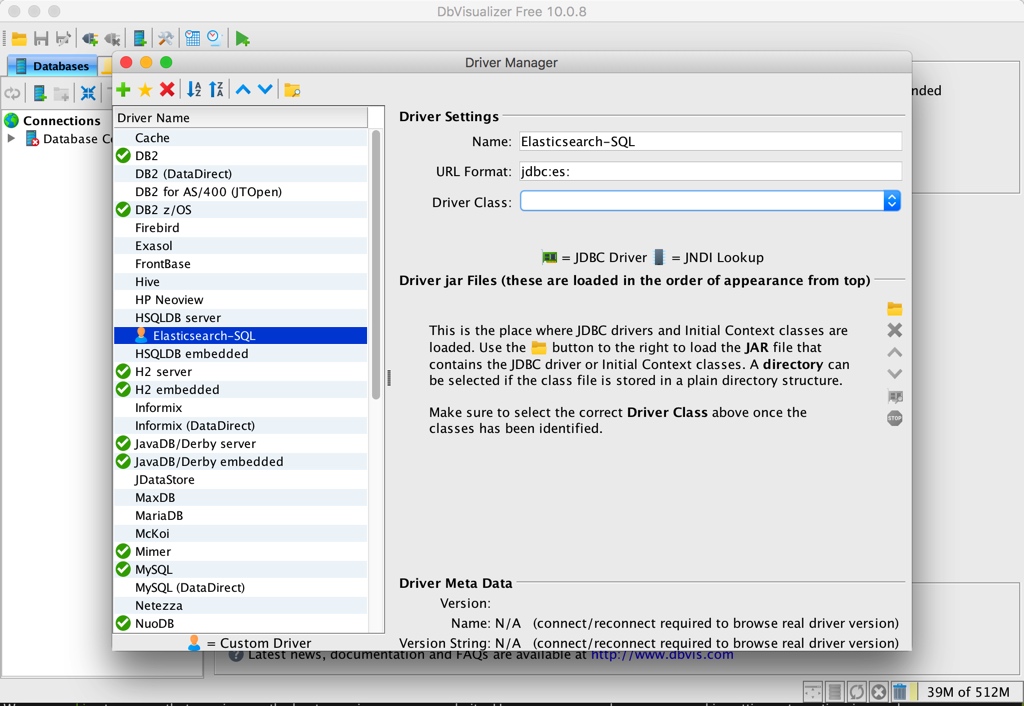
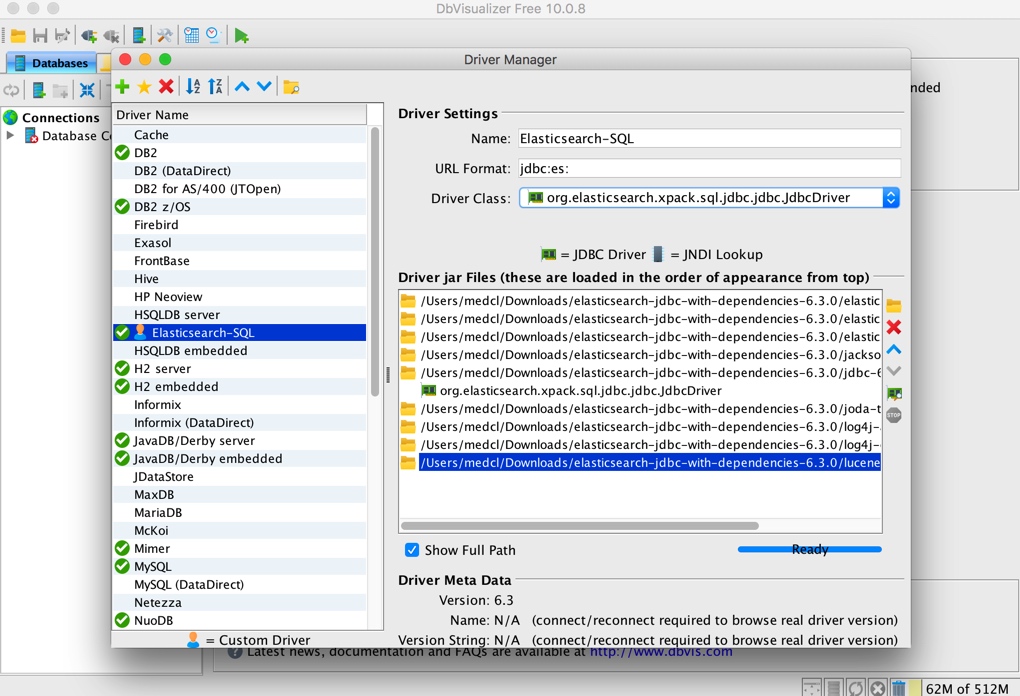
If we want to use es as the data source, the first thing we need to do is add the JDBC driver of ES to the known driver of DbVisualizer. Open the DbVisualizer menu [Tools] - [Driver Manager] to open the following setting window:

Click the green plus button to add a new one named Elasticsearch-SQL The url format is set to jdbc:es:, as shown below:
Then click the yellow folder button in the figure above to add all the jar files we just downloaded and unzipped, as follows:

After adding, see the following figure:
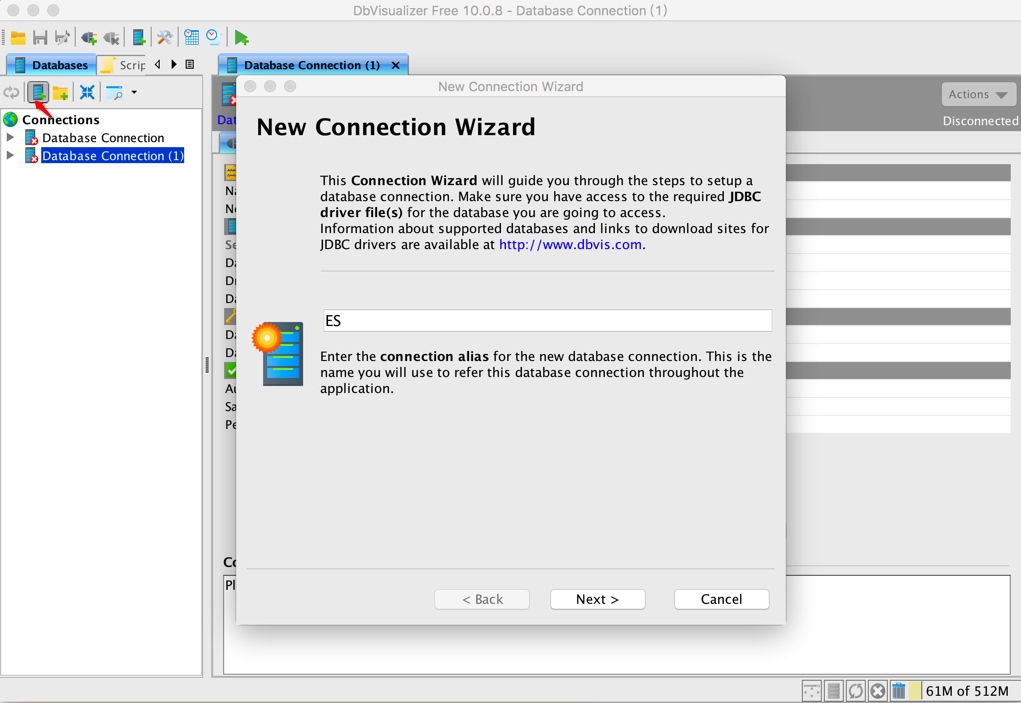
You can close the JDBC driven management window. Let's connect to the ES database.
Select the new connection icon on the left side of the main program to open the wizard, as follows:
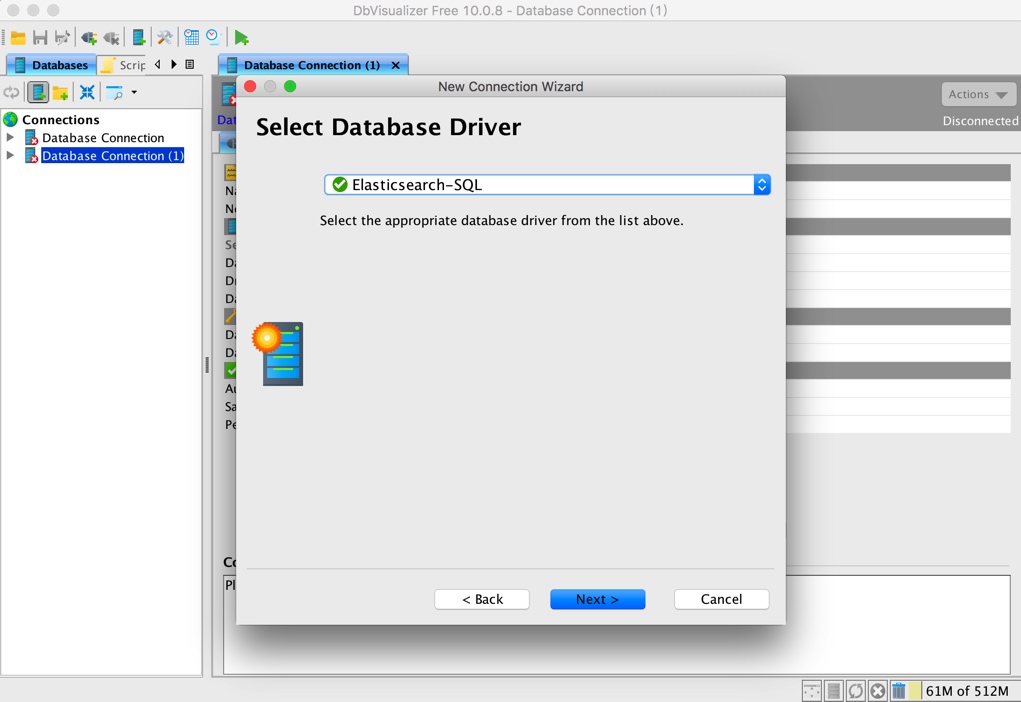
Select the elasticsearch SQL driver you just joined:
Set the connection string. There is no login information here. If there is, you can fill in the corresponding:
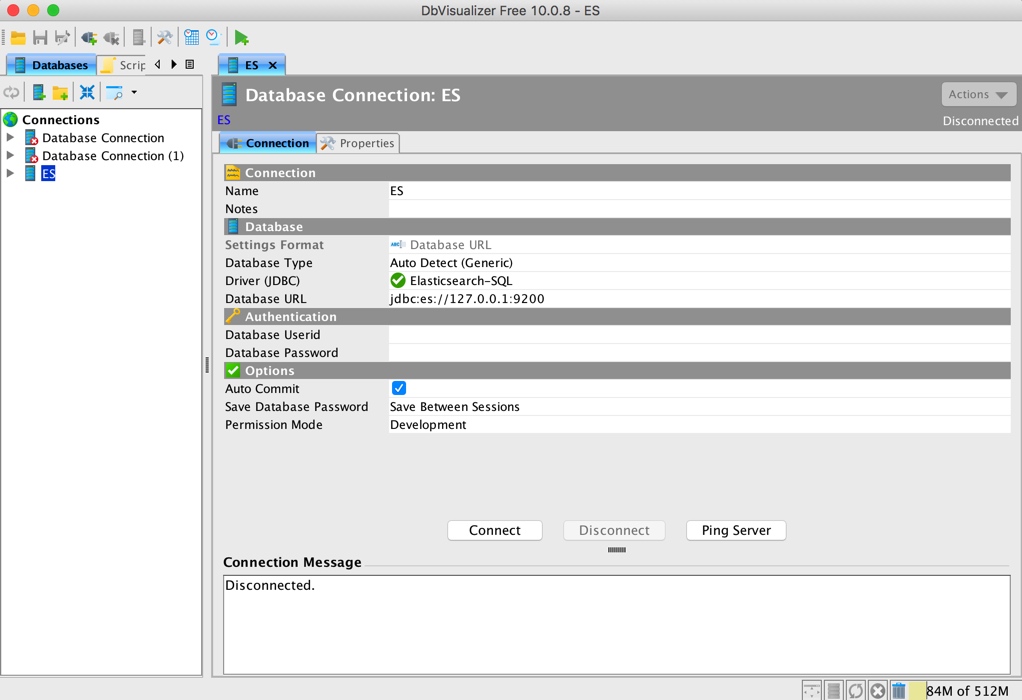
click Connect, you can connect to ES, and the left navigation can expand to see the corresponding ES index information:
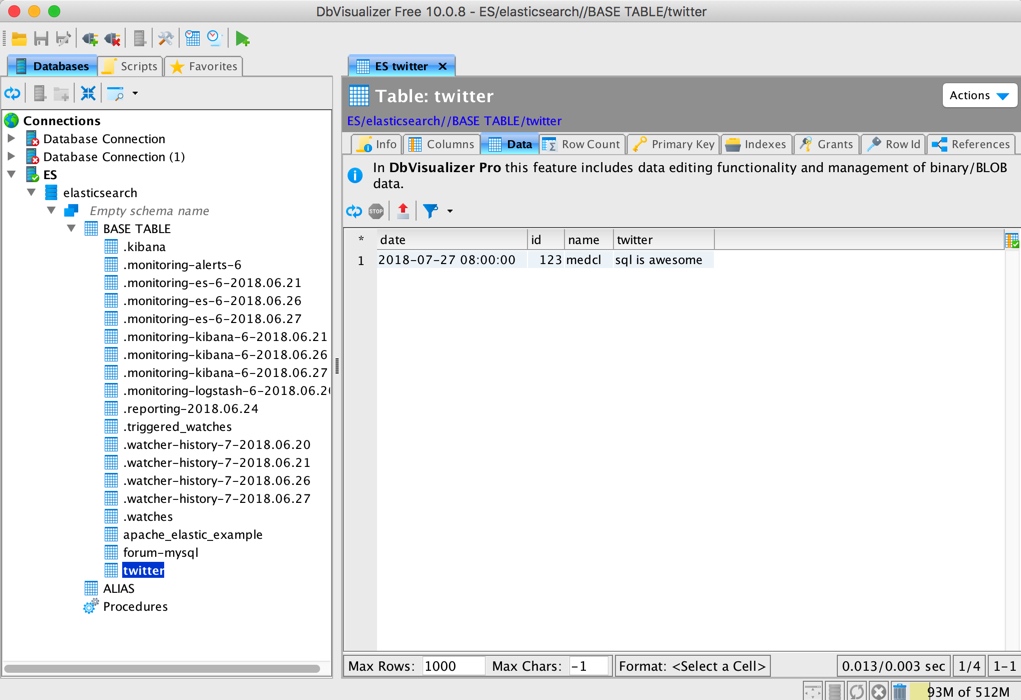
You can also view the corresponding library table results and specific data:
It's also easy to execute SQL with his own tools:
Similarly, various ETL tools and SQL based BI and visual analysis tools can connect Elasticsearch as an SQL database to obtain data.
As a final tip, if your index name contains a horizontal line, such as logstash-201811, you only need to include it in double quotation marks and escape the double quotation marks, as follows:
POST /_xpack/sql?format=txt
{
"query":"SELECT COUNT(*) FROM \"logstash-*\""
}
Here are the documents about SQL operations:
SQL JDBC | Elasticsearch Guide [7.14] | Elastic
Enjoy!