Style of markers and lines
import plotly.io as pio
import plotly.express as px
import plotly.graph_objects as go
from plotly.subplots import make_subplots
import pandas as pd
import numpy as np

# Set plot default theme
pio.templates.default = 'plotly_white'

# Set pandas to display all columns when printing
pd.set_option('display.max_columns', None)
Style summary
Official example: https://plotly.com/python/marker-style/
Parameter Description: https://plotly.com/python/reference/scatter/
go.Scatter,fig.update_traces(marker=dict(...), selector=dict(type='scatter')),fig.update_shapes
- Line: line style settings. Dictionary type, with the following attributes:
- Color: the color of the line
- dash: style of line
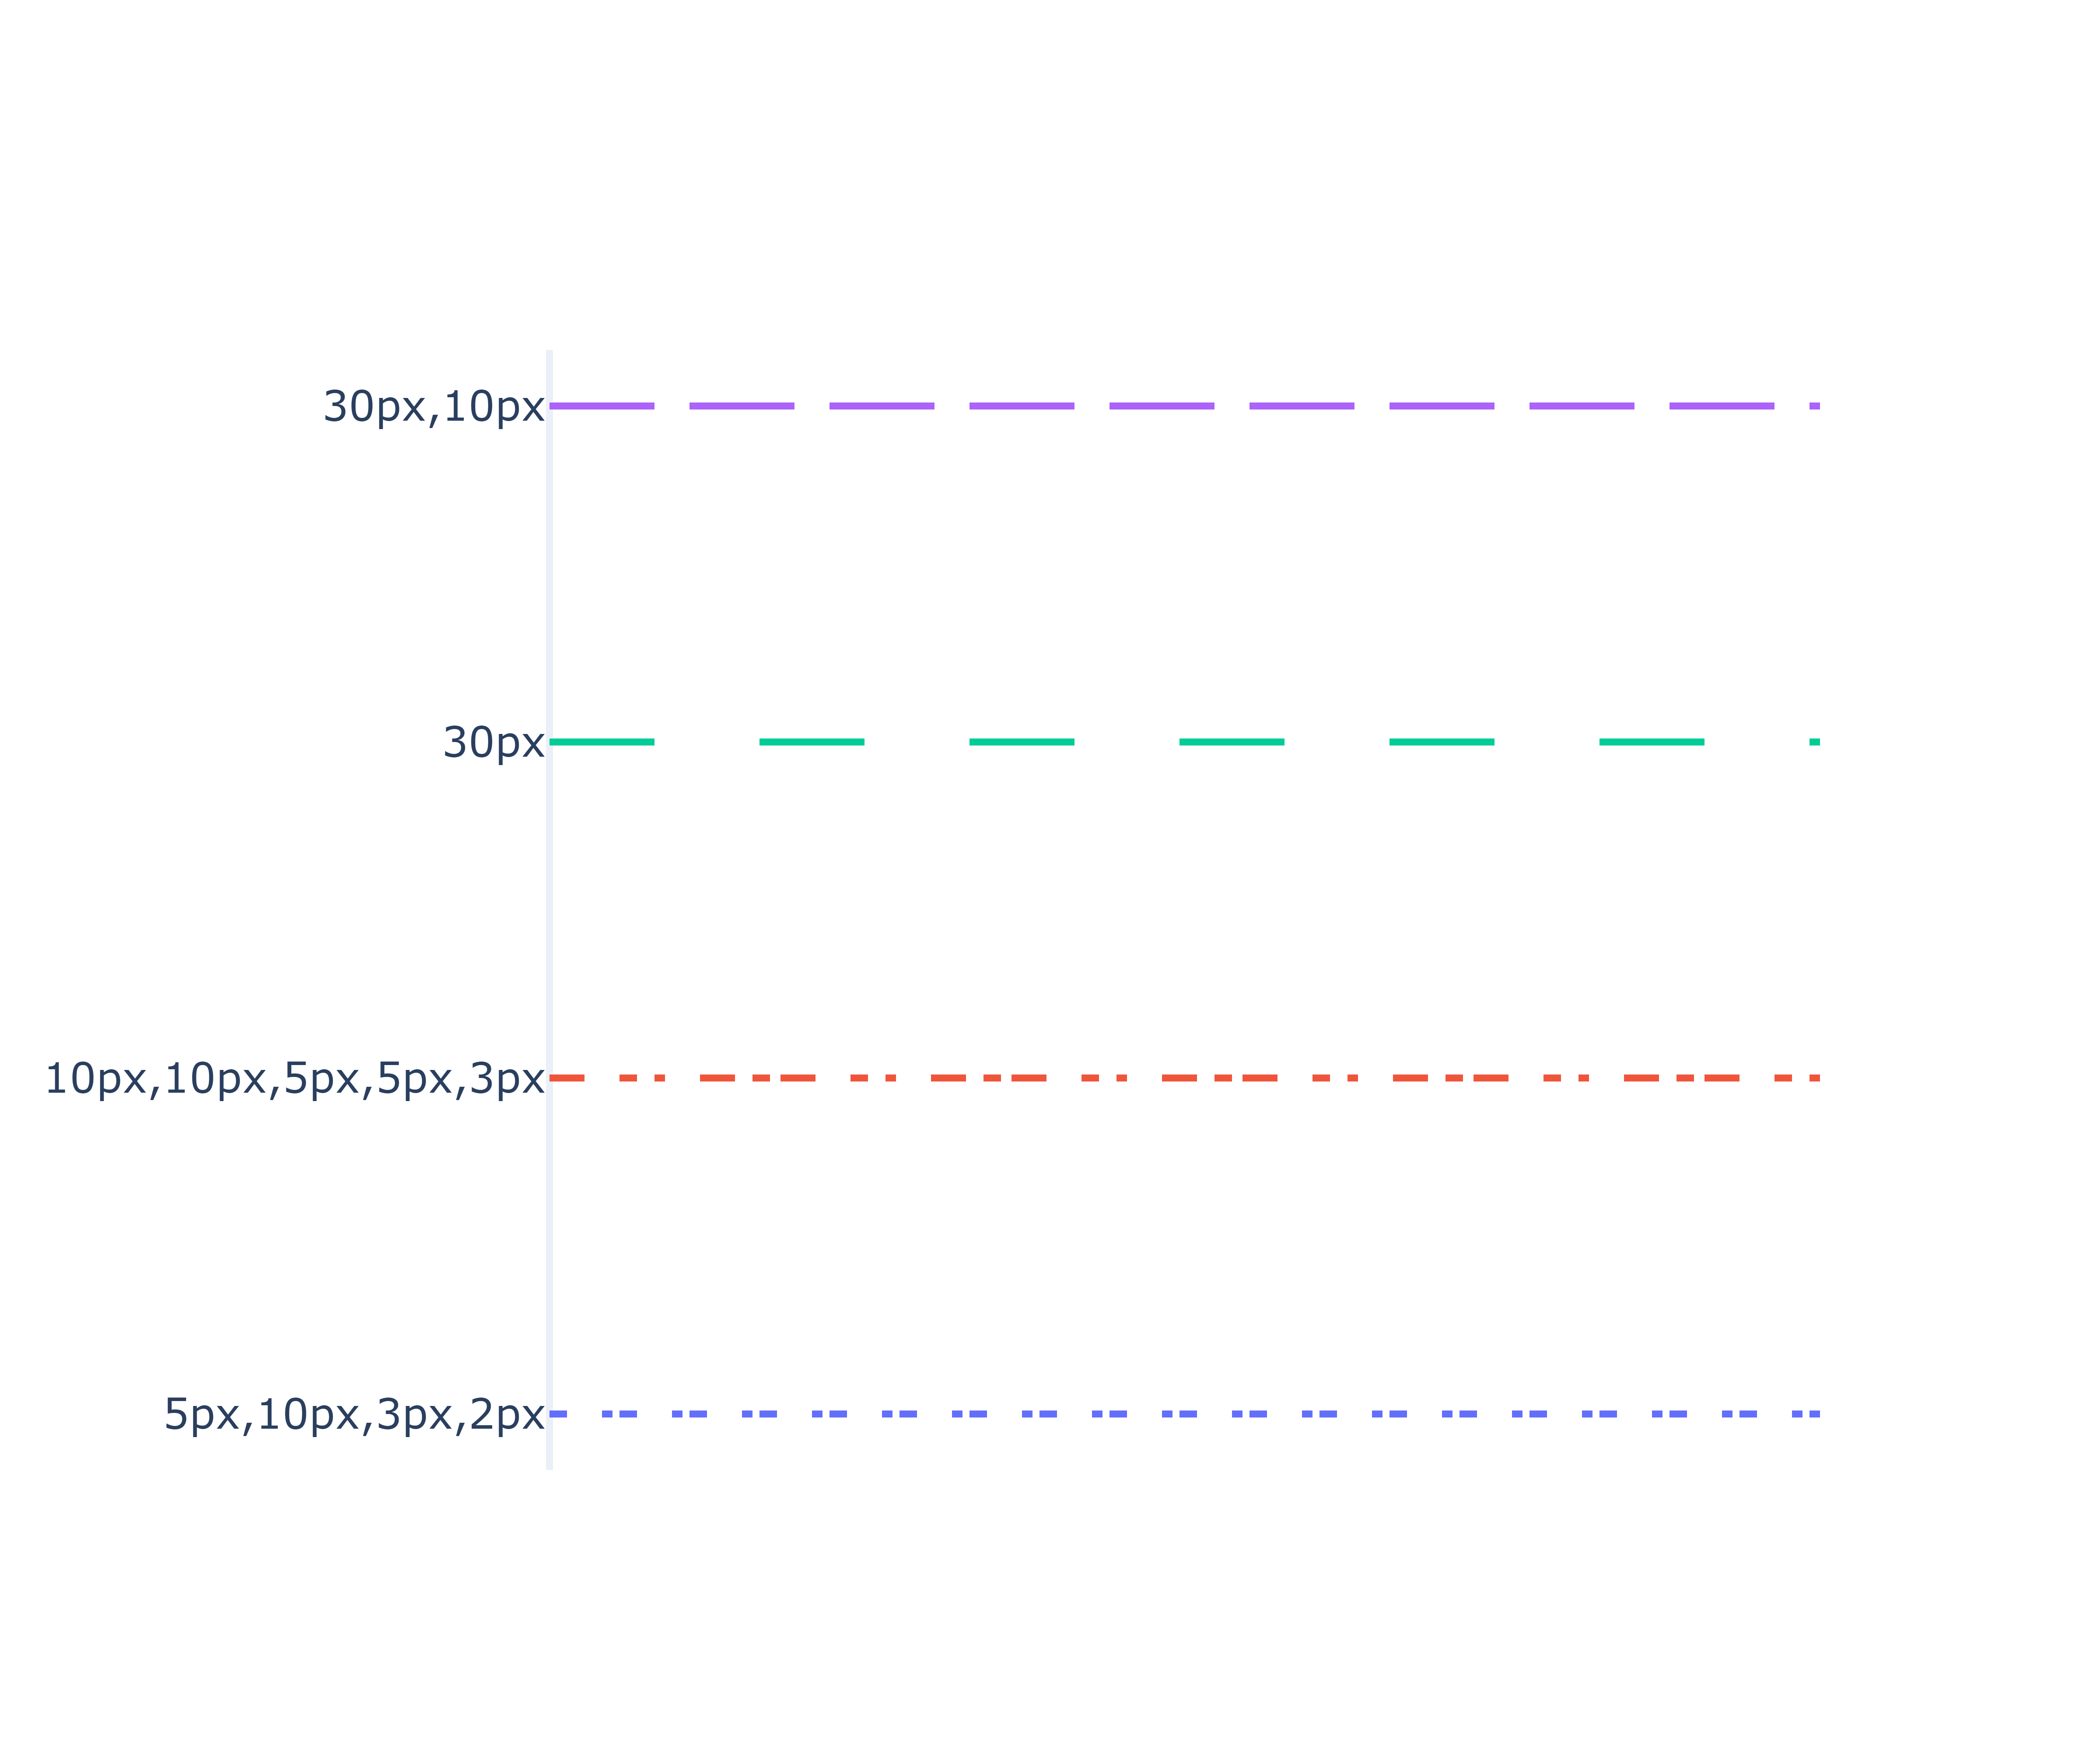
- Take the style string 'solid' (default), 'dot', 'dash', 'longdash', 'dashdot', 'longdash dot' or a string length list, for example: "5px,10px,2px,2px", that is: draw 5px short line, empty 10px, draw 2px short line and empty 2px
- Shape: determines the shape of the line. When 'spline' is taken, the straight line is drawn by spline interpolation, and other values correspond to segmented linetype
- Take 'linear' (default), 'spline', 'hv', 'vh', 'hvh' and 'vhv'
- Simplify: whether to simplify lines by removing adjacent approximate points. When transitioning lines, you may need to disable this function so that the number of points on the resulting SVG path will not be affected
- Smoothing: only valid when shape='spline ', set the degree of smoothing. 0 means no smoothing (equivalent to shape='linear ')
- Floating point number between [0, 1.3]. The default value is 1
- Width: sets the line width
- An integer greater than or equal to 0. The default value is 2
fig = go.Figure()

line_dash = ['solid', 'dot', 'dash', 'longdash', 'dashdot', 'longdashdot']
for i, d in enumerate(line_dash):
    fig.add_trace(
        go.Scatter(
            x=[0, 10], y=[i, i], mode='lines',
            line=dict(dash=d, width=3,),
            showlegend=False
    ))


fig.update_layout(
    width=600, height=500,
    yaxis=dict(
        type='category',
        tickvals=list(range(len(line_dash))),
        ticktext=line_dash,
        showgrid=False
    ),
    xaxis_showticklabels=False,
    xaxis_showgrid=False,
)

fig.write_image('../pic/lines_1.png', scale=10)
fig.show()
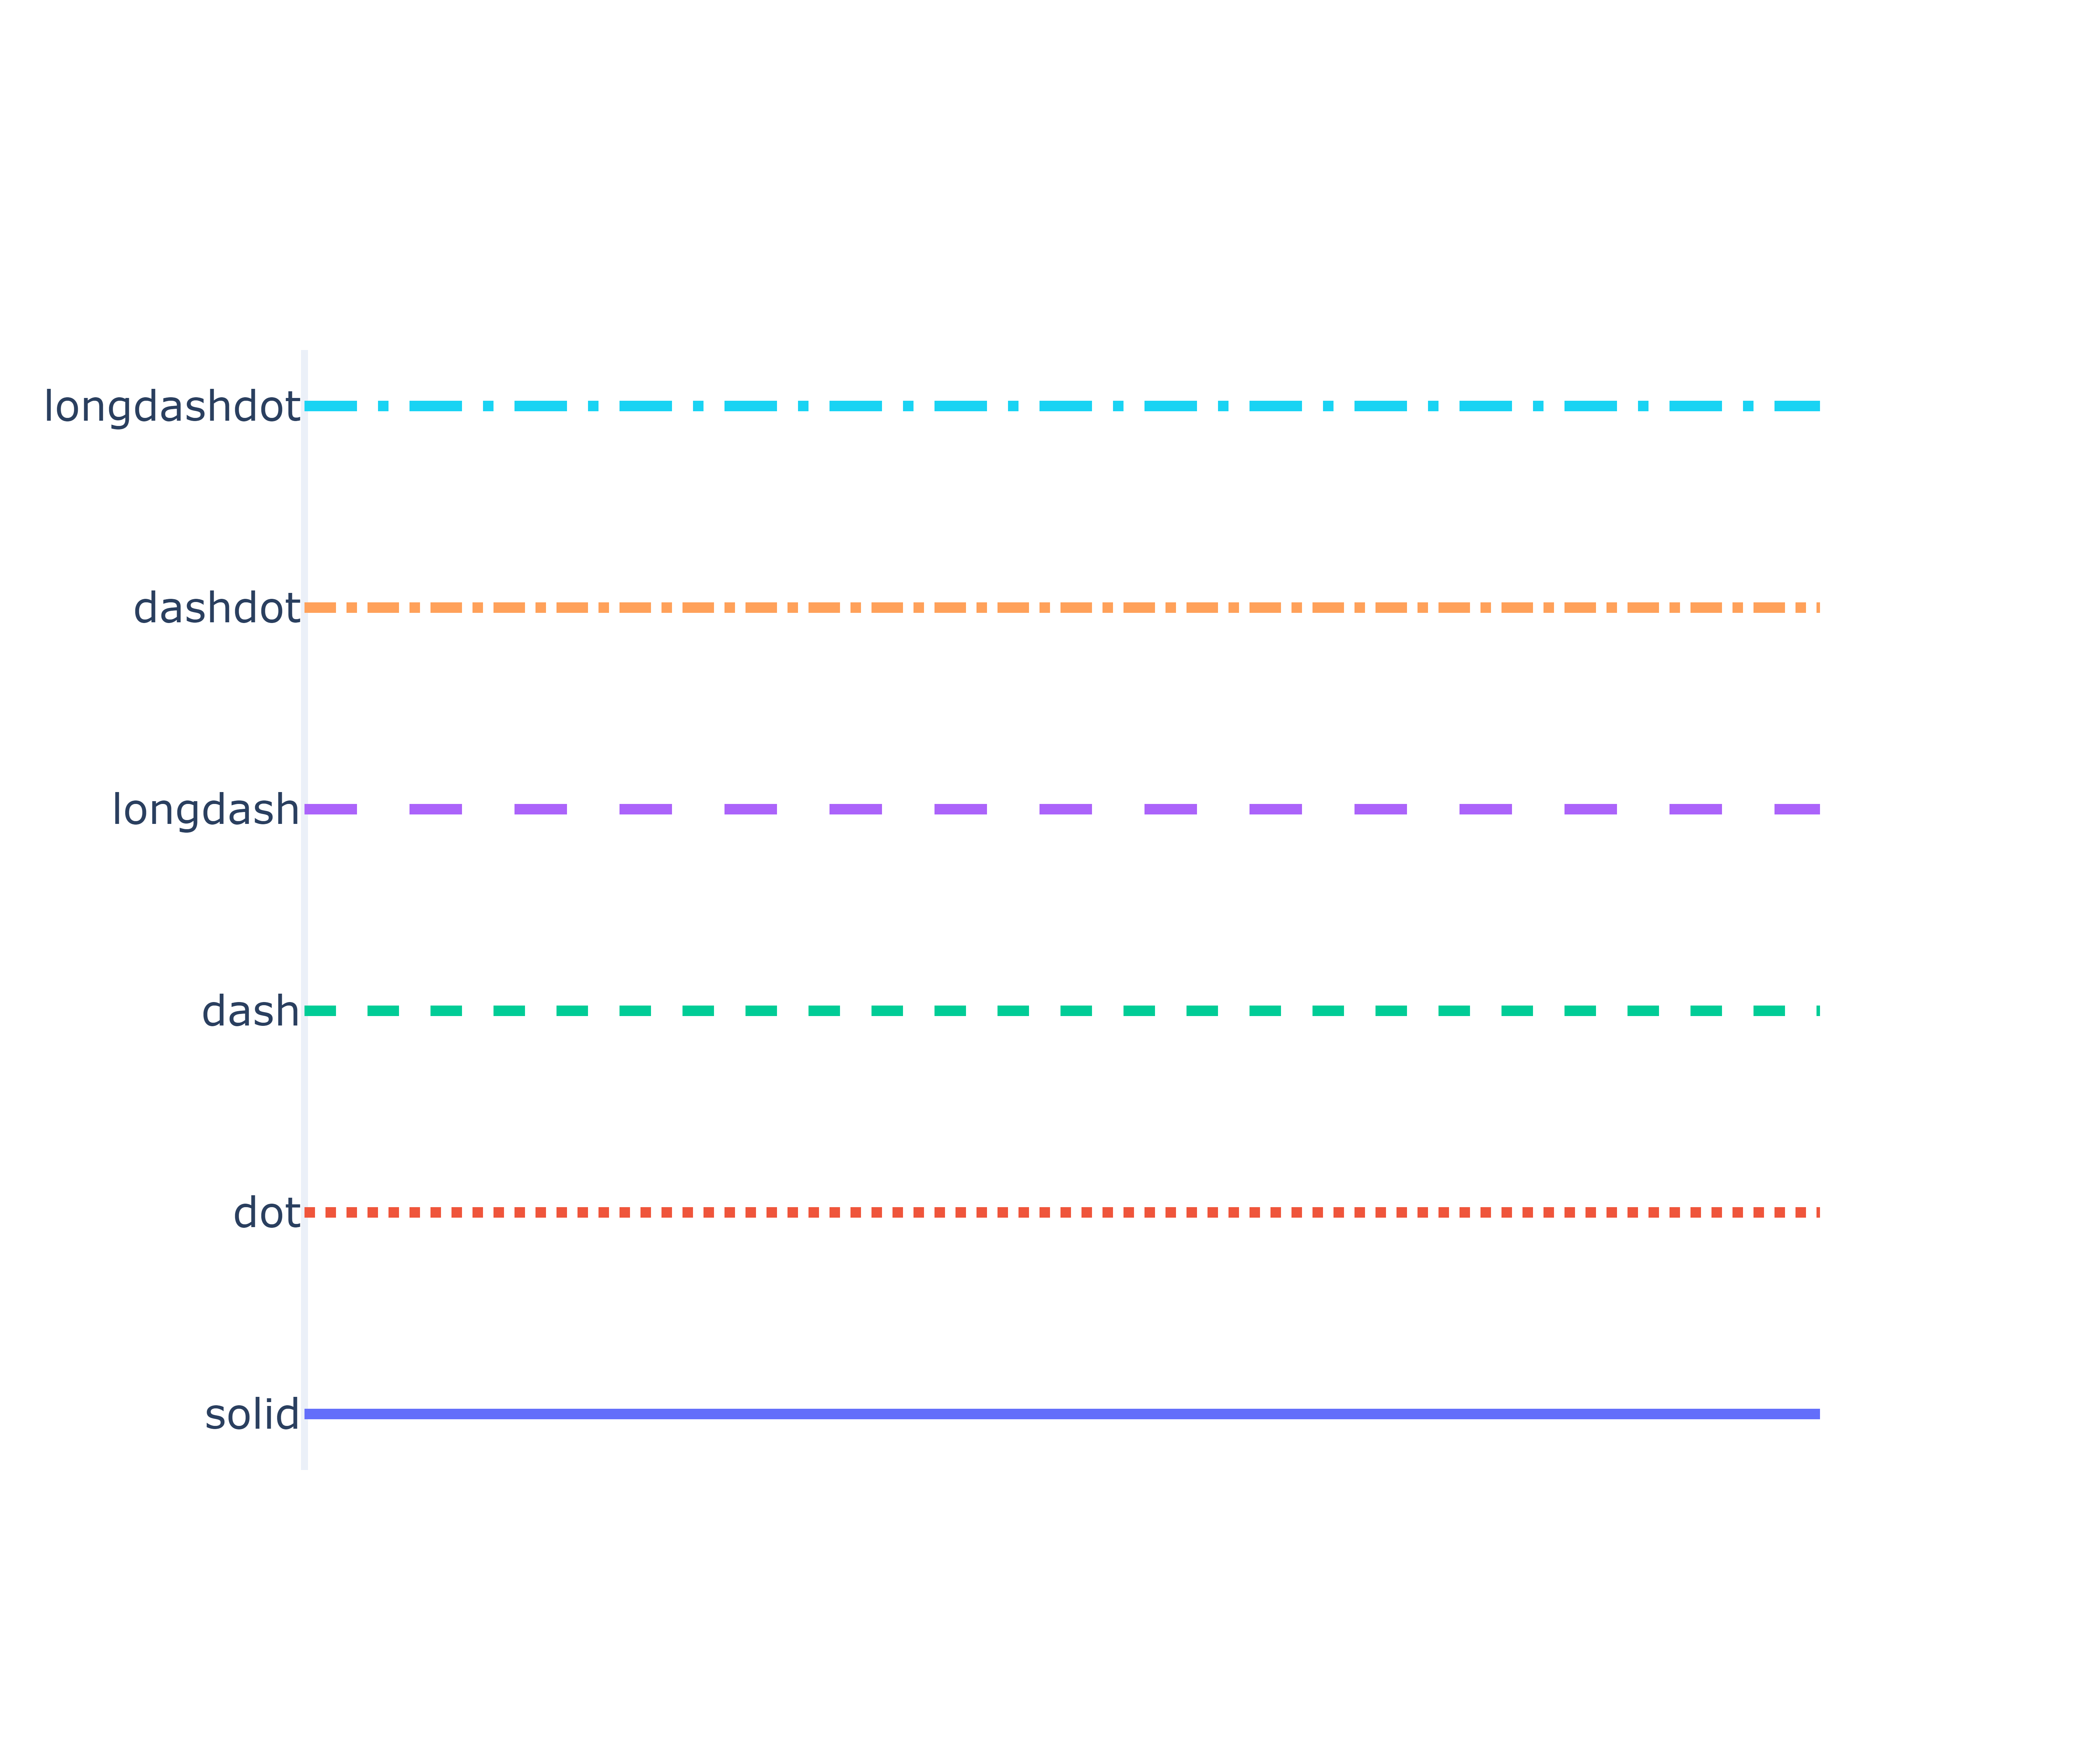
fig = go.Figure()

line_dash = ['5px,10px,3px,2px',
             '10px,10px,5px,5px,3px',
             '30px',
             '30px,10px']
for i, d in enumerate(line_dash):
    fig.add_trace(
        go.Scatter(
            x=[0, 10], y=[i, i], mode='lines',
            line_dash=d,
            showlegend=False
    ))


fig.update_layout(
    width=600, height=500,
    yaxis=dict(
        type='category',
        tickvals=list(range(len(line_dash))),
        ticktext=line_dash,
        showgrid=False
    ),
    xaxis_showticklabels=False,
    xaxis_showgrid=False,
)

fig.write_image('../pic/lines_2.png', scale=10)
fig.show()
- marker:
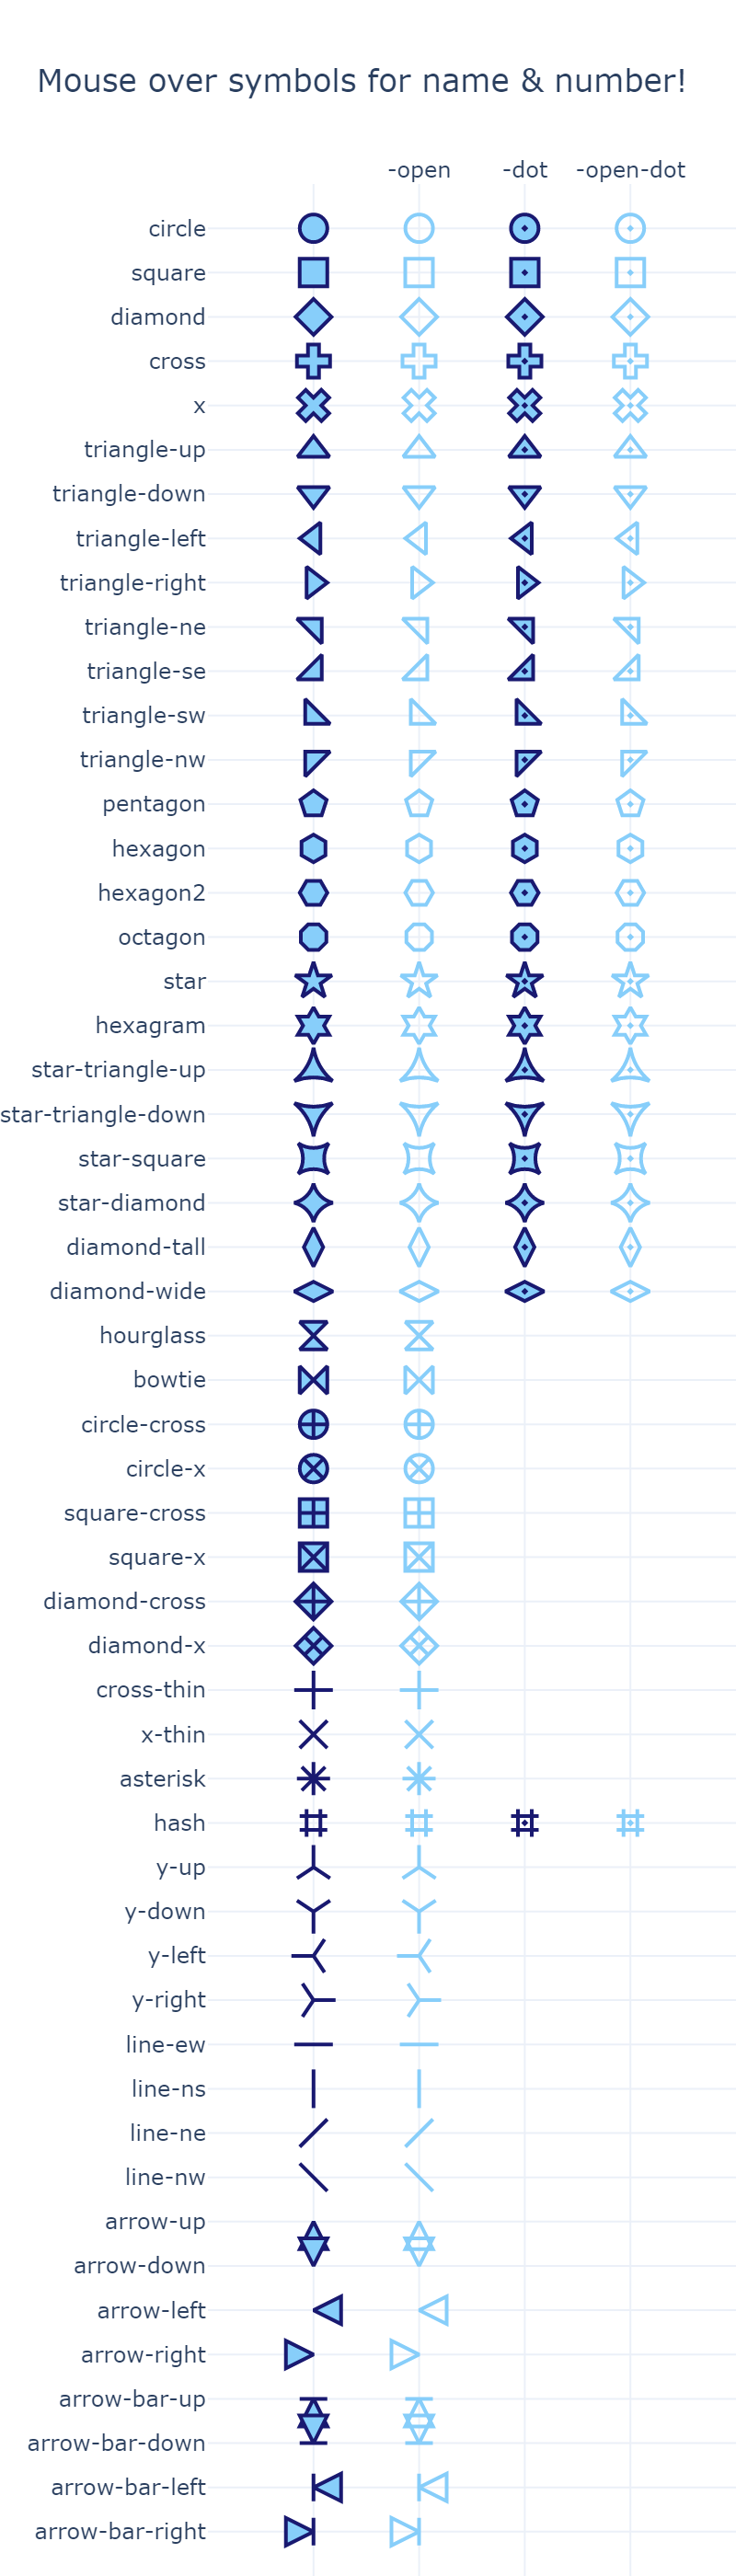
- symbol: sets the type of tag. Appending 100 at the end is equivalent to appending "- Open", 200 is equivalent to appending "- dot", and 300 is equivalent to appending "- Open dot" or "dot open". See the following example for detailed values
- Size: sets the tag size. It is an integer greater than or equal to 0. The default value is 6
- Opacity: sets the opacity of the tag and the floating-point number between [0, 1]
- Color: sets the color of the marker. Accept a specific color or an array of numbers, and the numbers in the array will be mapped to the color scale according to the maximum and minimum values in the array, or to the color scale according to cmin and cmax (if set).
- Note: if a list is passed in, the length of the list must be equal to the length of the data passed in. The list can be not only numbers, but also colors. If it is a number, it must be used with the color column colorscale. If it is a color, it does not need the color column. Generally, the color of bar bar bar is imported to set the color of each column.
- cauto: whether to automatically calculate cmin and cmax according to the digital data entered into the color list. Only when color is passed into the numerical list can it be effective. The default value is True. If cmin and cmax are specified, the property is automatically set to False
- cmin: sets the lower bound of the color scale. It is valid only when color is passed into the numeric list. If this attribute is specified, cmax must also be specified
- cmid: set the midpoint of the color scale by scaling cmin and cmax. Only the numeric list passed in by color is valid. Invalid when cauto is False.
- cmax: sets the upper bound of the color scale. It is valid only when color is passed into the numeric list. If this attribute is specified, cmin must also be specified
- reversescale: whether to reverse color mapping. It is only valid when color is a numeric list. If True, cmin will represent the last color in the array and cmax will represent the first color in the array
- Colorscale: sets the color scale, which is valid only when color is set as a numeric array. Colorscale must be an array containing the normalized number mapped to rgb, rgba, hex, hsl, hsv or named color string. At least 0 and 1 are required, for example: [[0, 'rgb (0,0255)'], [1, 'rgb (255,0,0)]]. You can use cmin and cmax to control the boundary of the color scale. In addition, colorscale can also be the following strings: 'Blackbody', 'Bluered', 'Blues',' Cividis', 'Earth', 'Electric', 'Greens',' Greys', 'Hot', 'Jet', 'Picnic', 'Portland', 'Rainbow', 'RdBu', 'Reds',' Viridis', 'YlGnBu', 'YlOrRd'
- showscale: whether to display the color column. It is valid only when color is set to a numeric array.
- colorbar: color column related settings
- Gradient: gradient, dictionary type, with the following attributes:
- Color: set the final gradient, 'radial' as the center color, 'horizontal' as the right side and 'vertical' as the bottom. String or color array
- Type: sets the type of gradient fill mark
- String enumeration type, or list of string enumeration types. Take 'radial', 'horizontal', 'vertical' and 'none' (default value)
- Line: line setting of marked points, dictionary type, and the desirable attributes are as follows:
- Color: the same as the color of the marker
- cauto: the same as that of marker
- cmin: cmin of the same marker
- Cmid: the same as the cmid of the marker
- cmax: the same as the cmax of marker
- Colorscale: the same as the colorscale of marker
- Reverse scale: the reverse scale of the same marker
- Width: sets the width of the line, an integer greater than or equal to 0.
import plotly.graph_objects as go
from plotly.validators.scatter.marker import SymbolValidator

raw_symbols = SymbolValidator().values
namestems = []
namevariants = []
symbols = []
for i in range(0,len(raw_symbols),3):
    name = raw_symbols[i+2]
    symbols.append(raw_symbols[i])
    namestems.append(name.replace("-open", "").replace("-dot", ""))
    namevariants.append(name[len(namestems[-1]):])

fig = go.Figure(go.Scatter(mode="markers", x=namevariants, y=namestems, marker_symbol=symbols,
                           marker_line_color="midnightblue", marker_color="lightskyblue",
                           marker_line_width=2, marker_size=15,
                           hovertemplate="name: %{y}%{x}<br>number: %{marker.symbol}<extra></extra>"))
fig.update_layout(title="Mouse over symbols for name & number!",
                  xaxis_range=[-1,4], yaxis_range=[len(set(namestems)),-1],
                  margin=dict(b=0,r=0), xaxis_side="top", height=1400, width=400)
fig.show()
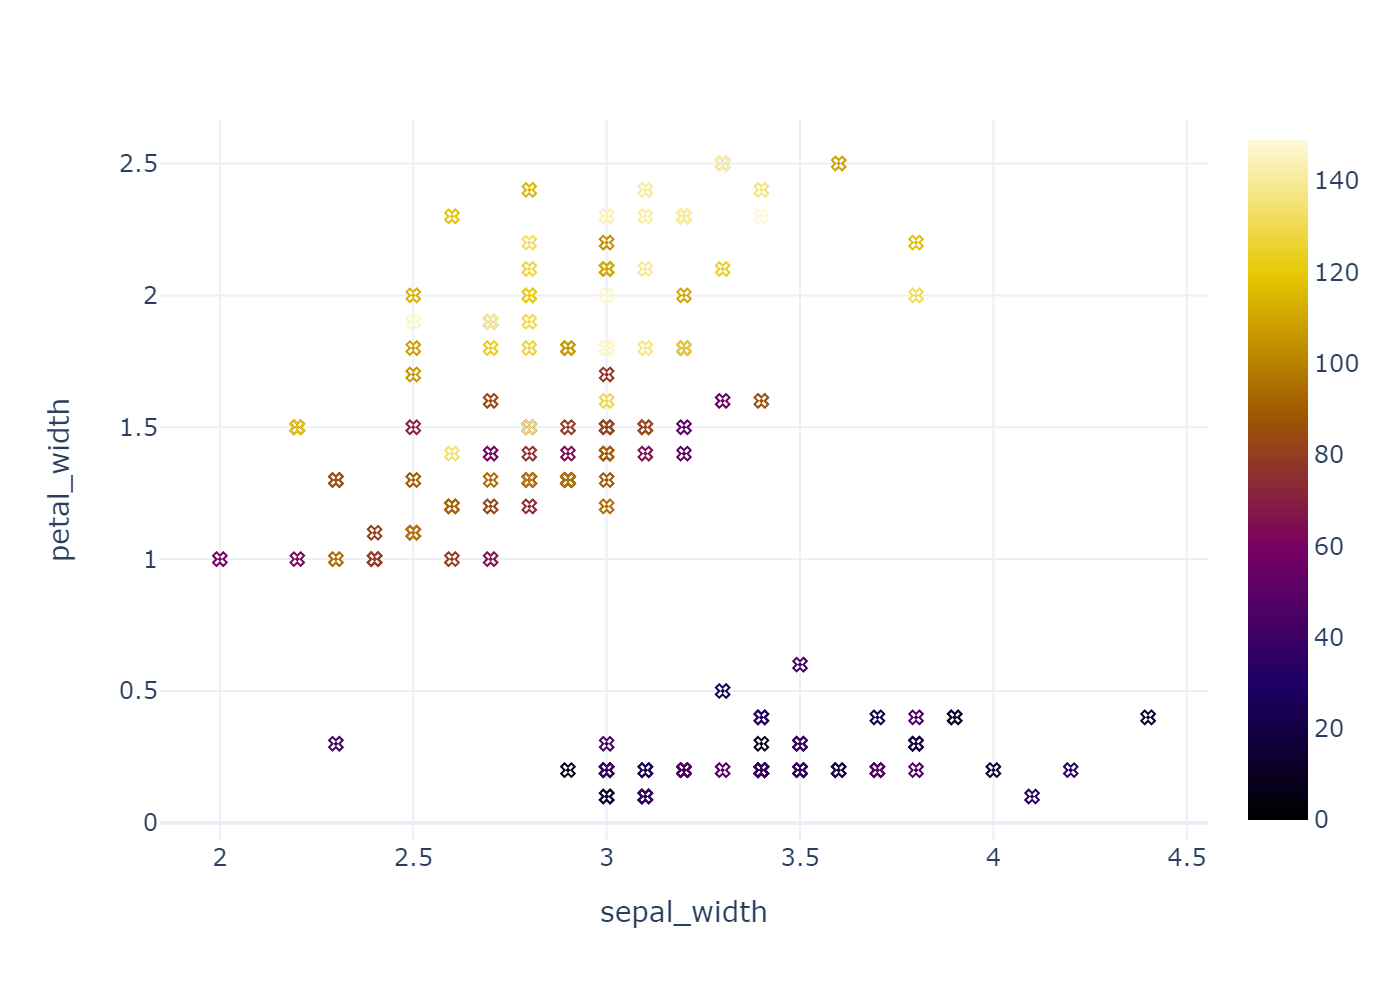
df = px.data.iris()
print(df.head(3))

fig = px.scatter(df, x='sepal_width', y='petal_width')

fig.update_traces(
    marker=dict(
        color=[i for i in range(150)],
        colorscale='Electric',
        showscale=True,
        symbol='x-open-dot',
    )
)

fig.write_image('../pic/markers_2.png', scale=2)
fig.show()
df = px.data.iris()
print(df.head(3))

fig = px.scatter(df, x='sepal_width', y='petal_width')

fig.update_traces(
    marker=dict(
        color=[i for i in range(150)],
        cmin=50, cmax=100,
        colorscale=[[0, '#0d47a1'], [0.5, '#e3f2fd'], [1, '#d50000']],
        showscale=True,
        symbol='x-open-dot',
    )
)

fig.write_image('../pic/markers_3.png', scale=2)
fig.show()
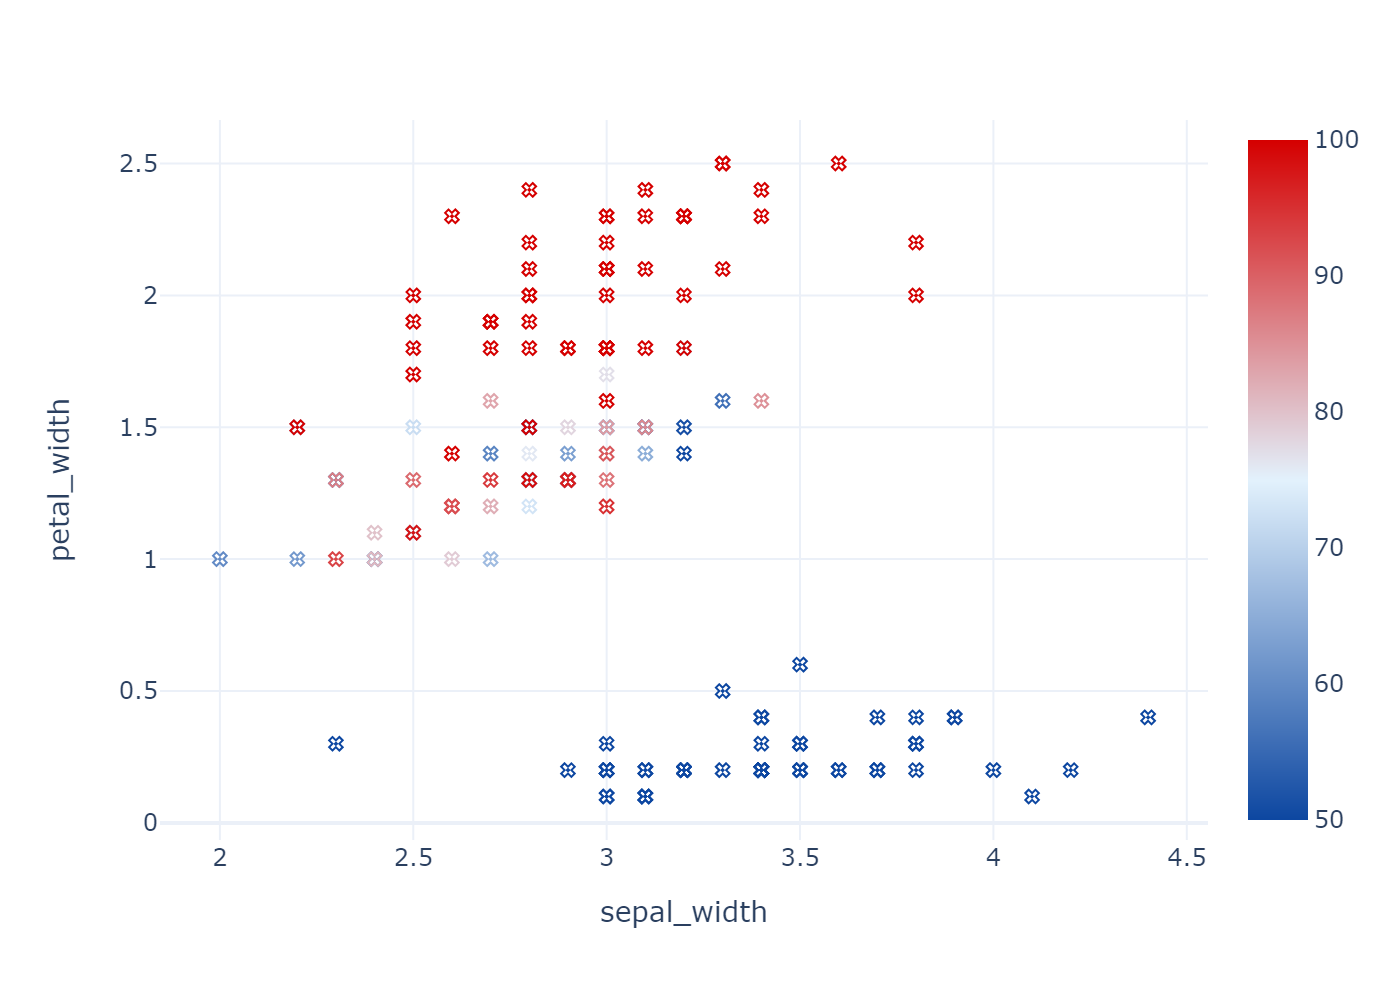
fig = px.bar(x=['a', 'b', 'c', 'd'], y=[6, 4 ,8, 3])

fig.update_traces(
    marker=dict(
        color=['#e57373', '#9575cd', '#4fc3f7', '#81c784']
    )
)

fig.update_layout(
    width=600, height=400
)

fig.write_image('../pic/markers_4.png', scale=2)
fig.show()
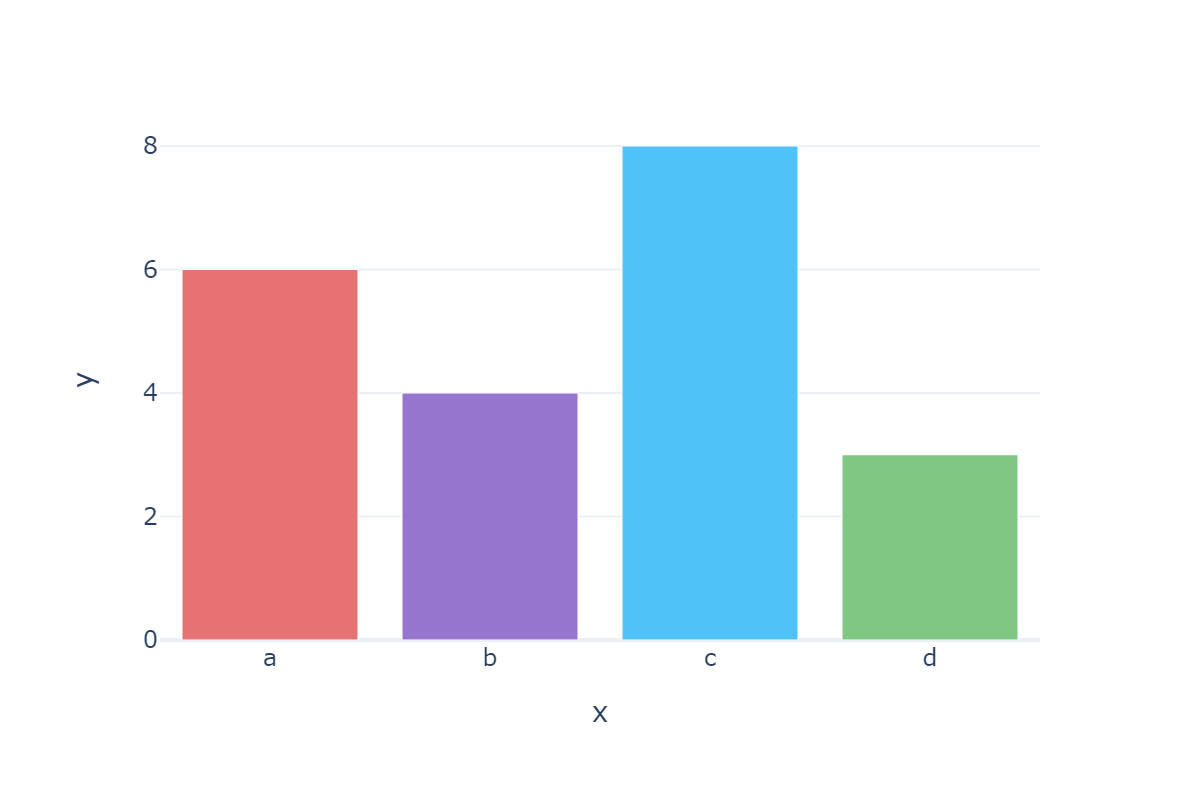
fig = px.bar(x=['a', 'b', 'c', 'd'], y=[6, 4 ,8, 3])

fig.update_traces(
    marker=dict(
        color=['#e57373', '#9575cd', '#4fc3f7', '#81c784'],
        line=dict(width=2, color='black')
    )
)

fig.update_layout(
    width=600, height=400
)

fig.write_image('../pic/markers_5.png', scale=2)
fig.show()
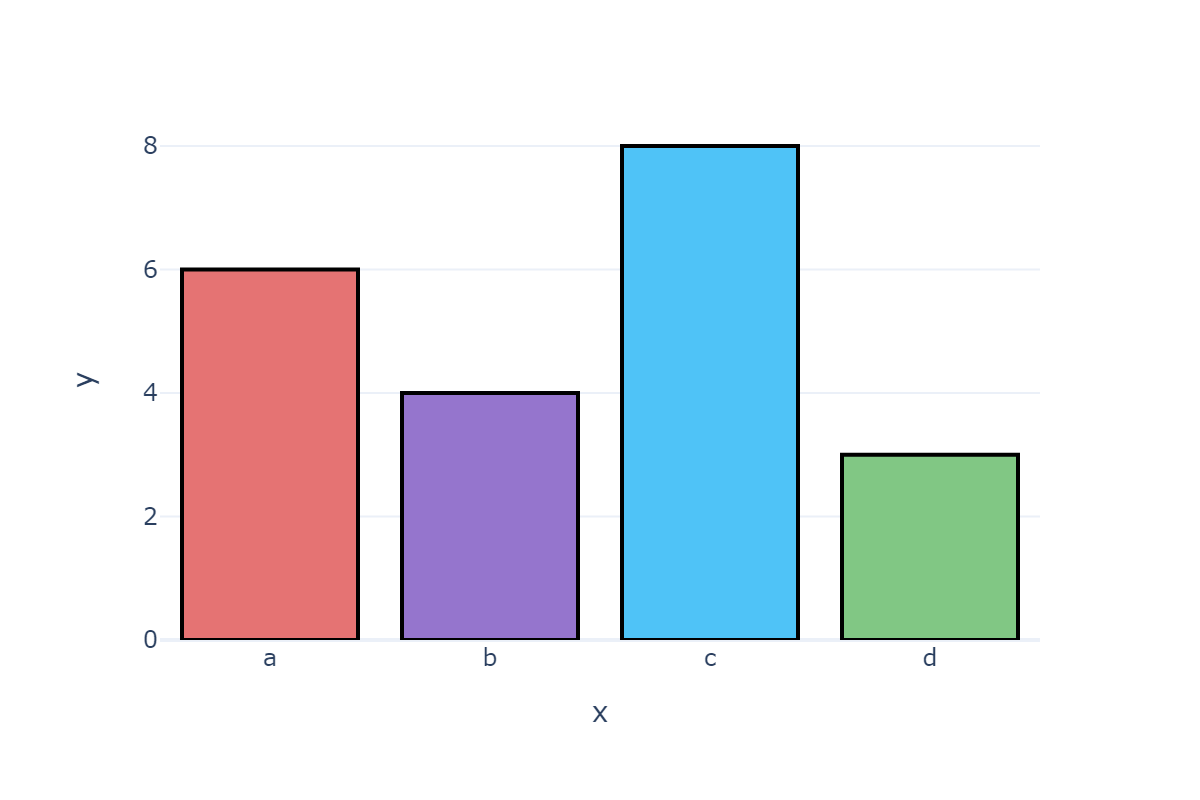
fig = go.Figure()

fig.add_trace(
    go.Scatter(
        x=list(range(10)), y=[2 for _ in range(10)], mode='markers',
        marker=dict(
            size=30,
            gradient={'color': '#f0acf7', 'type': 'horizontal'},
            line_width=0,
        )
    )
)

fig.add_trace(
    go.Scatter(
        x=list(range(10)), y=[3 for _ in range(10)], mode='markers',
        marker=dict(
            size=30,
            color='rgba(0, 0, 0, 0)',  # Use the a attribute to set the fill color to transparent
            line=dict(
                width=2,
                color=list(range(10)),
                colorscale=[[0, '#f7f0ac'], [0.5, '#acf7f0'], [1, '#f0acf7']],
            )
        )
    )
)

fig.write_image('../pic/markers_6.png', scale=2)
fig.show()
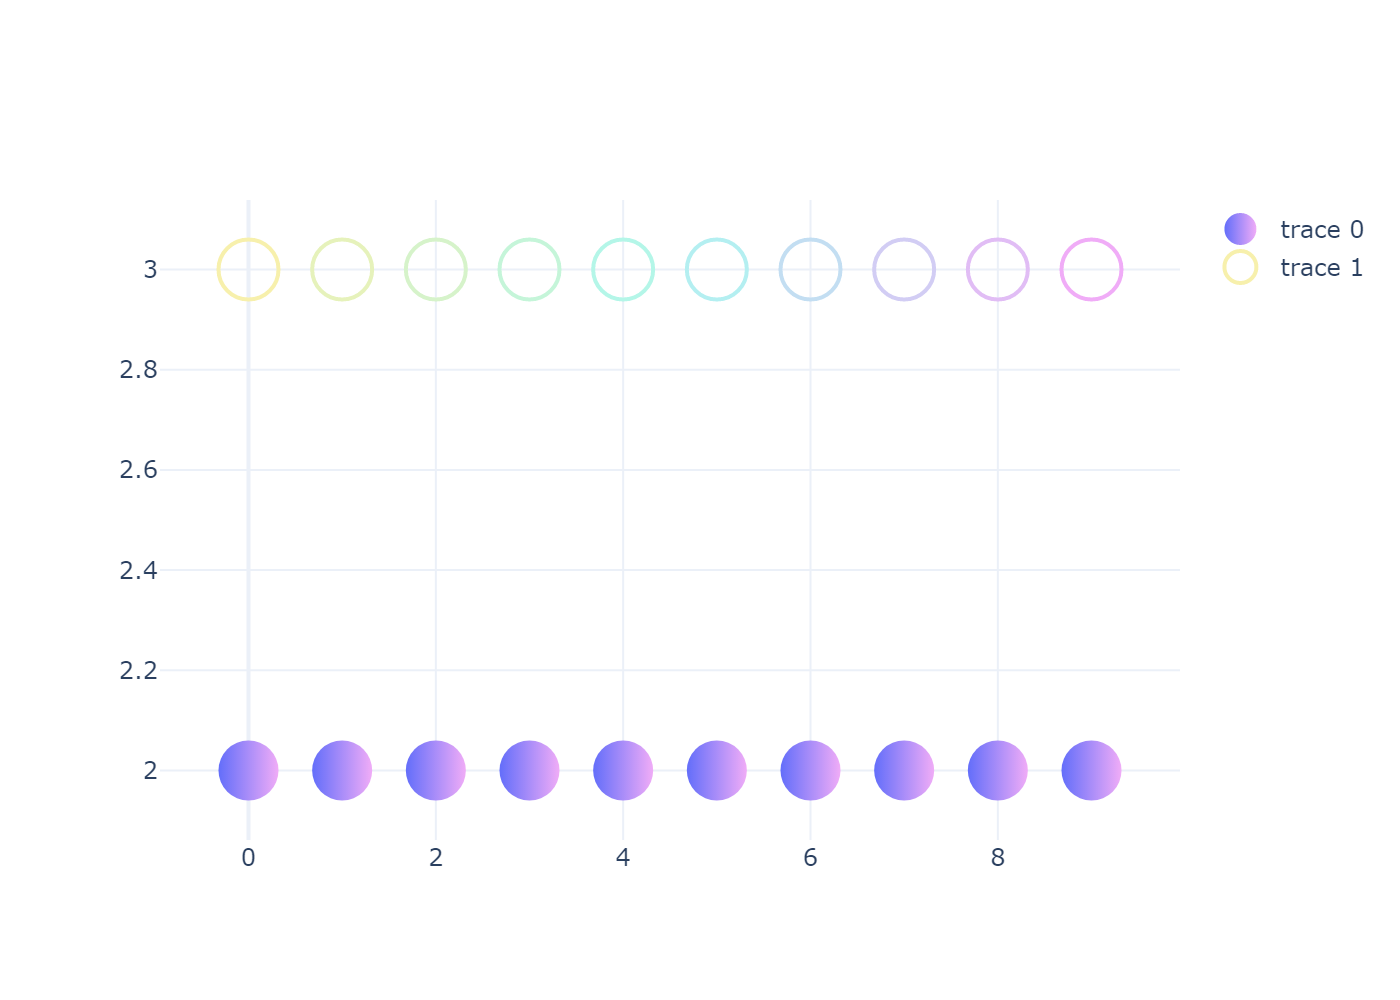
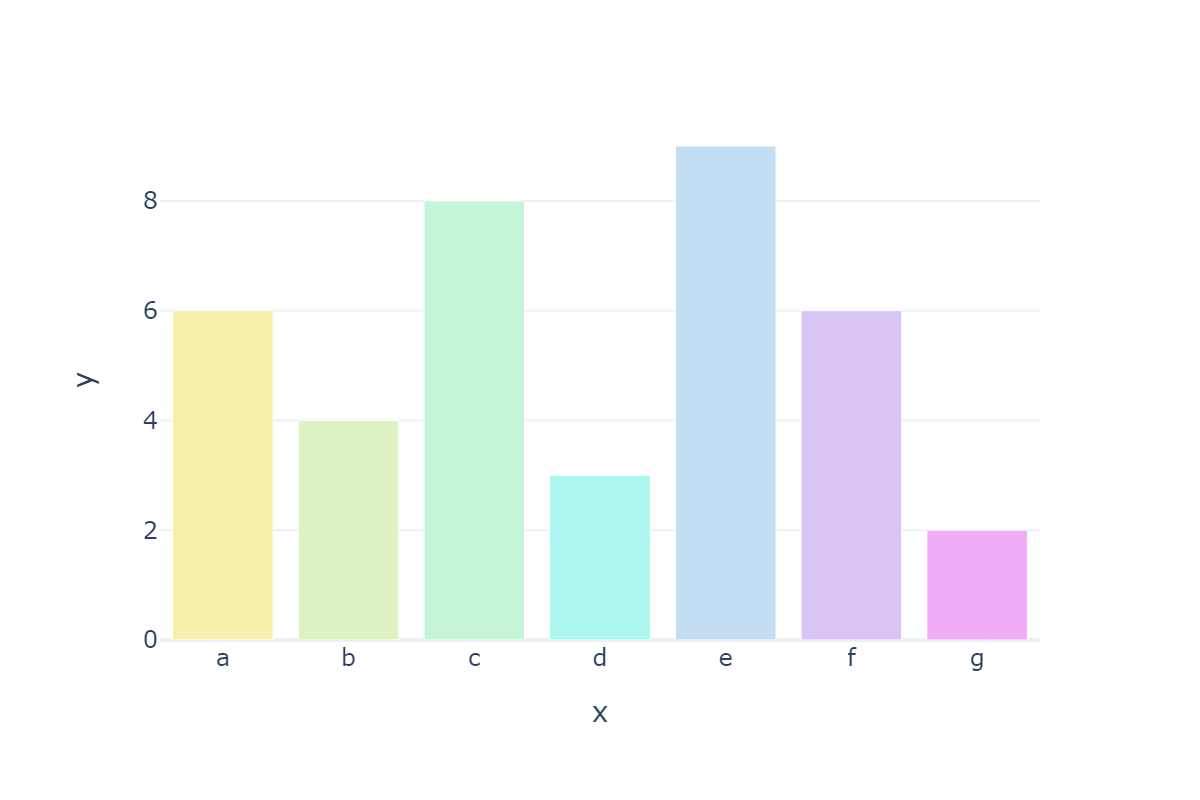
fig = px.bar(x=['a', 'b', 'c', 'd', 'e', 'f', 'g'], y=[6, 4 ,8, 3, 9, 6, 2])

# Use color=list(range(...)) With colorscale, you can achieve the effect of gradient
fig.update_traces(
    marker=dict(
        color=list(range(7)),
        colorscale=[[0, '#f7f0ac'], [0.5, '#acf7f0'], [1, '#f0acf7']],
    )
)

fig.update_layout(
    width=600, height=400
)

# fig.write_image('../pic/markers_7.png', scale=2)
fig.show()