We've asked three classic questions before. They are:
- Two-Category Questions (Tendency Judgment of Movie Comments)
- Multi-Category Questions (Categorize News by Subject)
- Regression problem (estimating real estate prices based on real estate data)
We solved the first two problems, and today we solved the third, the regression problem.
Whether it is a two-class problem or a multi-class problem, it all boils down to a classification problem. The regression problem is different. It is a regression problem. The training results of the regression problem are not discrete, but continuous, such as predicting tomorrow's temperature, annual precipitation and so on.
Here we continue to introduce real-world problems and datasets built into Keras: predicting house prices in Boston.For different houses in Boston, we give 13 data indicators for each house, including the number of rooms, crime rates, highway accessibility, and so on. They have inconsistent ranges of values, ranging from 0-1, 1-12 or 1-100. The goal of the training is a continuous value - the price of the house.The specific steps are as follows:
-
We are already familiar with reading data from datasets, but when we look at the data, we can see that the range of values of these data is too different, which can lead to distortions in the network training process, so it is better to preprocess the data first by (raw data-mean) / standard deviation, which is equivalent to standardizing the data, standard deviationThe normalized data has a mean of 0 and a standard deviation of 1.The mean and std methods are average and standard deviation, respectively.
-
Because we only have more than 500 data this time, we use a smaller network with two hidden layers.One thing we need to pay attention to here is the small amount of data, training is easy to produce a fit, small networks are more suitable.
-
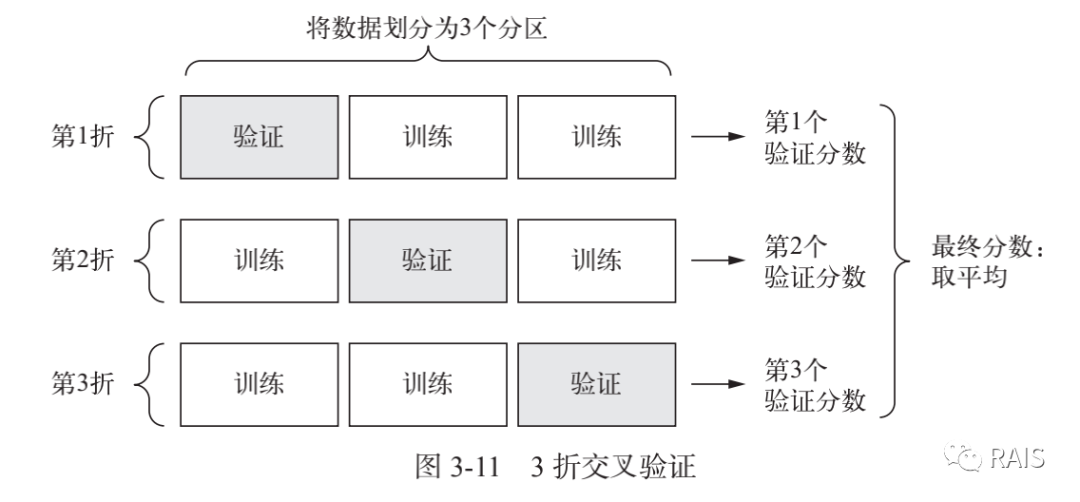
We can still use the previous method to partition the training set from the feedback set, but the problem is that the amount of data is too small, so how to partition the feedback set is too random, which will have a great impact on the final results, so we use the K-fold cross-validation method.The meaning of K-fold cross-validation is that we divide the data set into K copies, select one of them as the validation set each time, do K independent training, and finally take the average of K training times.Detailed as follows:

-
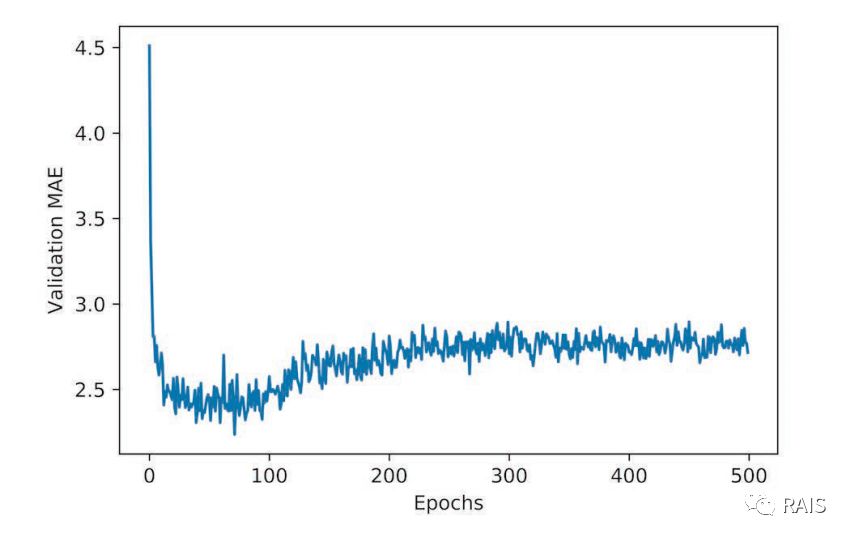
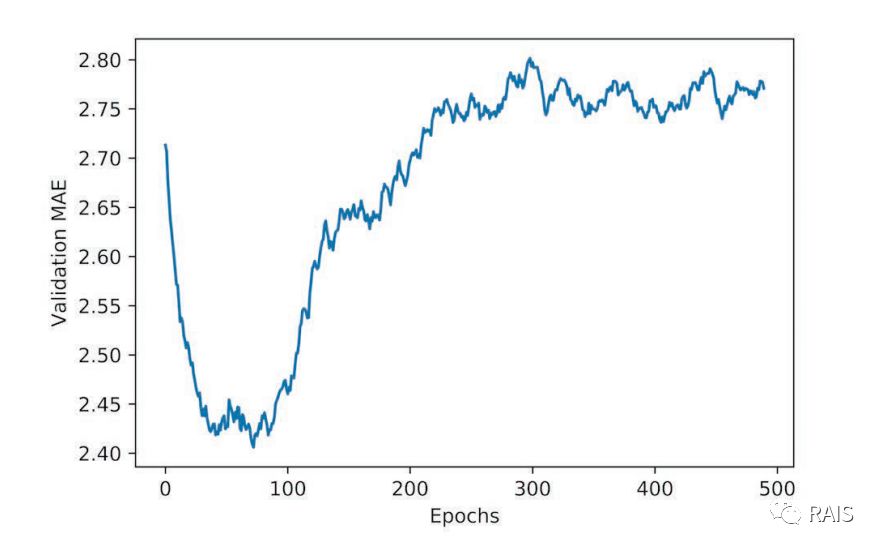
We drew a chart of 500 rounds of training, and you can see that some of the initial data was not good. Let's remove them and draw a chart again, as shown below, not only the result of two rounds, but also the problem that happened before--it's overmatched, so we adjusted the number of loops to 80 times.


-
The modified training network is an acceptable network, and we verify it on the test set, which basically meets the requirements.
So far, we have separately discussed the three issues mentioned at the beginning of the article (including the first two articles), the two-classification problem, the multi-classification problem and the regression problem. Among them, we have also encountered and solved some problems, which are summarized below:
-
Most of the processing of data by neural networks needs to be converted to the processing of numbers, so text and other content need to be preprocessed.
-
Considering the size of the data network, the number of layers, the standardization of the data and the number of iterations of training, the size of the data set, the number of features and the difference between the feature values often require drawing to observe and judge. Finally, a more appropriate network model is obtained according to the adjusted parameters.
-
Insufficient number of training iterations and over-fitting are common problems encountered, they are not good enough training networks. In the actual problems, both situations need to be evaluated and adjusted.
-
When choosing loss function and feedback function, we need to consider the practical problems and make the selection according to the requirements of the data.
In the following articles, more systematic analysis and research will be conducted on these issues mentioned above.
#!/usr/bin/env python3

import time

import numpy as np
from keras import layers
from keras import models
from keras.datasets import boston_housing


def housing():
    global train_data

    (train_data, train_targets), (test_data, test_targets) = boston_housing.load_data()
    # (404, 13)
    # print(train_data.shape)
    # (102, 13)
    # print(test_data.shape)
    # [15.2 42.3 50.  21.1 17.7 18.5 11.3 ... 19.4 19.4 29.1]
    # print(train_targets)

    # average value
    mean = train_data.mean(axis=0)
    train_data -= mean
    # standard deviation
    std = train_data.std(axis=0)
    train_data /= std
    test_data -= mean
    test_data /= std

    k = 4
    num_val_samples = len(train_data) // k
    num_epochs = 500
    all_mae_histories = []
    for i in range(k):
        print('processing fold #', i)
        val_data = train_data[i * num_val_samples: (i + 1) * num_val_samples]
        val_targets = train_targets[i * num_val_samples: (i + 1) * num_val_samples]
        partial_train_data = np.concatenate(
            [train_data[:i * num_val_samples],
             train_data[(i + 1) * num_val_samples:]],
            axis=0)
        partial_train_targets = np.concatenate(
            [train_targets[:i * num_val_samples],
             train_targets[(i + 1) * num_val_samples:]],
            axis=0)
        model = build_model()
        model.fit(train_data, train_targets,
                  epochs=80, batch_size=16, verbose=0)
        test_mse_score, test_mae_score = model.evaluate(test_data, test_targets)
        # history = model.fit(partial_train_data, partial_train_targets,
        #                     validation_data=(val_data, val_targets),
        #                     epochs=num_epochs, batch_size=1, verbose=0)
        # mae_history = history.history['val_mean_absolute_error']
        # all_mae_histories.append(mae_history)

    # average_mae_history = [
    #     np.mean([x[i] for x in all_mae_histories]) for i in range(num_epochs)]
    #
    # plt.plot(range(1, len(average_mae_history) + 1), average_mae_history)
    # plt.xlabel('Epochs')
    # plt.ylabel('Validation MAE')
    # plt.show()
    #
    # smooth_mae_history = smooth_curve(average_mae_history[10:])
    # plt.plot(range(1, len(smooth_mae_history) + 1), smooth_mae_history)
    # plt.xlabel('Epochs')
    # plt.ylabel('Validation MAE')
    # plt.show()


def build_model():
    model = models.Sequential()
    model.add(layers.Dense(64, activation='relu',
                           input_shape=(train_data.shape[1],)))
    model.add(layers.Dense(64, activation='relu'))
    model.add(layers.Dense(1))
    model.compile(optimizer='rmsprop', loss='mse', metrics=['mae'])
    return model


def smooth_curve(points, factor=0.9):
    smoothed_points = []
    for point in points:
        if smoothed_points:
            previous = smoothed_points[-1]
            smoothed_points.append(previous * factor + point * (1 - factor))
        else:
            smoothed_points.append(point)
    return smoothed_points


def smooth_curve(points, factor=0.9):
    smoothed_points = []
    for point in points:
        if smoothed_points:
            previous = smoothed_points[-1]
            smoothed_points.append(previous * factor + point * (1 - factor))
        else:
            smoothed_points.append(point)
    return smoothed_points


if __name__ == "__main__":
    time_start = time.time()
    housing()
    time_end = time.time()
    print('Time Used: ', time_end - time_start)