Time series data can be seen everywhere. In order to analyze time series, we must preprocess the data first. Time series preprocessing technology has a significant impact on the accuracy of data modeling.
In this article, we will mainly discuss the following points:
- Definition and importance of time series data.
- Preprocessing steps of time series data.
- Build time series data, find missing values, denoise features, and find abnormal values in the data set.
First, let's understand the definition of time series:
Time series is a series of evenly distributed observations recorded in a specific time interval.
An example of a time series is the price of gold. In this case, our observation is the price of gold collected after a fixed time interval. The time unit can be minutes, hours, days, years, etc. However, the time difference between any two consecutive samples is the same.
In this article, we will see the common time series preprocessing steps and common problems related to time series data that should be performed before delving into the data modeling part.
Time series data preprocessing
Time series data contains a lot of information, but it is usually invisible. Common problems associated with time series are unordered timestamps, missing values (or timestamps), outliers, and noise in data. Of all the problems mentioned, dealing with missing values is the most difficult one, because the traditional interpolation method (a technology to deal with missing data by replacing missing values to retain most of the information) is not suitable for dealing with time series data. To analyze this preprocessed real-time analysis, we will use Kaggle's Air Passenger dataset.
Time series data usually exist in unstructured format, that is, time stamps may be mixed together and not sorted correctly. In addition, in most cases, the date time column has the default string data type. Before any operation is applied to it, the data time column must be converted to the date time data type. Let's implement it into our dataset:
import pandas as pd

passenger = pd.read_csv('AirPassengers.csv')
passenger['Date'] = pd.to_datetime(passenger['Date'])
passenger.sort_values(by=['Date'], inplace=True, ascending=True)

Missing values in time series
Dealing with missing values in time series data is a challenging task. Traditional interpolation techniques are not suitable for time series data because the order of received values is very important. To solve this problem, we have the following interpolation methods:
Interpolation is a commonly used missing value interpolation technique for time series. It helps to use two known data points around to estimate the missing data points. This method is simple and intuitive. The following methods can be used when processing timing data:
- Time based interpolation
- Spline interpolation
- linear interpolation
Let's see what our data looks like before interpolation:
from matplotlib.pyplot import figure
import matplotlib.pyplot as plt

figure(figsize=(12, 5), dpi=80, linewidth=10)
plt.plot(passenger['Date'], passenger['Passengers'])
plt.title('Air Passengers Raw Data with Missing Values')
plt.xlabel('Years', fontsize=14)
plt.ylabel('Number of Passengers', fontsize=14)
plt.show()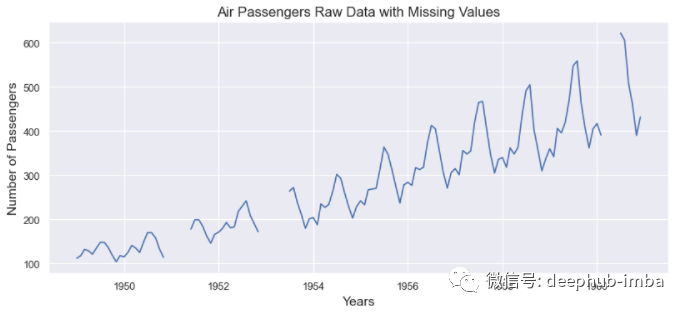
Let's look at the results of the above three methods:
passenger['Linear'] = passenger['Passengers'].interpolate(method='linear')
passenger['Spline order 3'] = passenger['Passengers'].interpolate(method='spline', order=3)
passenger['Time'] = passenger['Passengers'].interpolate(method='time')

methods = ['Linear', 'Spline order 3', 'Time']

from matplotlib.pyplot import figure
import matplotlib.pyplot as plt
for method in methods:
    figure(figsize=(12, 4), dpi=80, linewidth=10)
    plt.plot(passenger["Date"], passenger[method])
    plt.title('Air Passengers Imputation using: ' + types)
    plt.xlabel("Years", fontsize=14)
    plt.ylabel("Number of Passengers", fontsize=14)
    plt.show()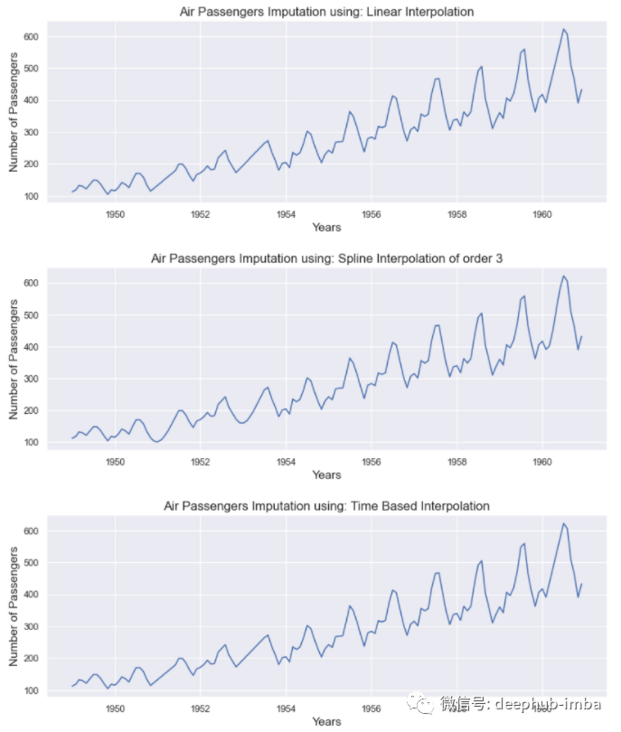
All methods give good results. These methods are more meaningful when the missing value window (the width of the missing data) is small. However, if several consecutive values are lost, these methods are more difficult to estimate them.
Time series denoising
Noise elements in time series may cause serious problems, so generally, there will be noise removal operations before building any model. The process of minimizing noise is called denoising. Here are some methods commonly used to remove noise from time series:
Rolling average
The rolling average is the average of the previous observation window, where the window is a series of values from time series data. Calculate the average for each ordered window. This can greatly help minimize noise in time series data.
Let's apply a rolling average to Google's stock price:
rolling_google = google_stock_price['Open'].rolling(20).mean()
plt.plot(google_stock_price['Date'], google_stock_price['Open'])
plt.plot(google_stock_price['Date'], rolling_google)
plt.xlabel('Date')
plt.ylabel('Stock Price')
plt.legend(['Open','Rolling Mean'])
plt.show()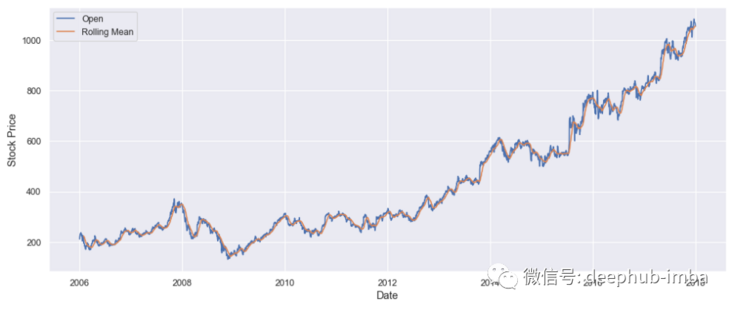
Fourier transform
Fourier transform can help remove noise by converting time series data to frequency domain. We can filter out noise frequency. Then the filtered time series are obtained by inverse Fourier transform. We use Fourier transform to calculate Google stock price.
denoised_google_stock_price = fft_denoiser(value, 0.001, True)
plt.plot(time, google_stock['Open'][0:300])
plt.plot(time, denoised_google_stock_price)
plt.xlabel('Date', fontsize = 13)
plt.ylabel('Stock Price', fontsize = 13)
plt.legend(['Open','Denoised: 0.001'])
plt.show()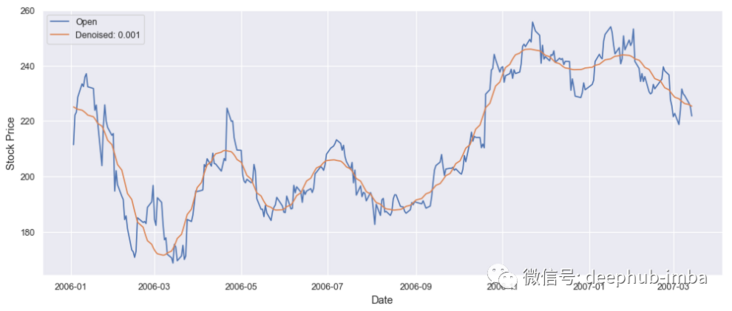
Outlier detection in time series
Outliers in time series refer to sudden peaks or declines in trend lines. There may be many factors leading to outliers. Let's take a look at the methods available to detect outliers:
Method based on rolling statistics
This method is the most intuitive and suitable for almost all types of time series. In this approach, the upper and lower limits are created based on specific statistical measures, such as mean and standard deviation, Z and T scores, and percentiles of the distribution. For example, we can define the upper and lower limits as:
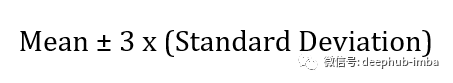
It is not advisable to take the mean and standard deviation of the whole sequence, because in this case, the boundary will be static. Boundaries should be created on the basis of scrolling windows, just like considering a continuous set of observations to create boundaries and then move to another window. This method is an efficient and simple outlier detection method.
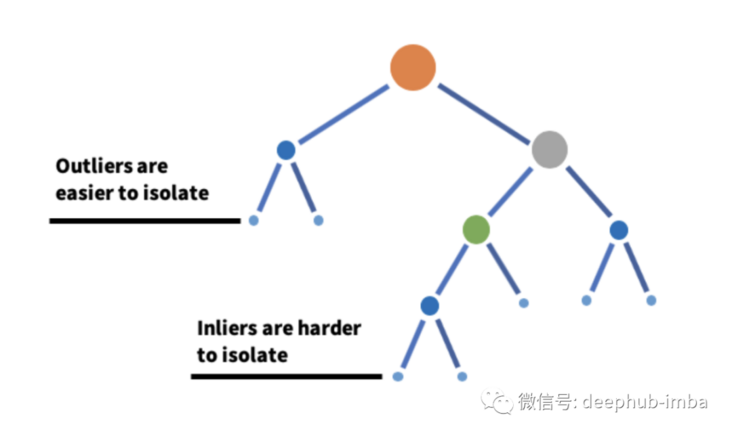
Isolated forest
As its name suggests, isolated forest is a machine learning algorithm for anomaly detection based on decision tree. It works by using the partition of the decision tree to isolate the data points on a given feature set. In other words, it takes a sample from the dataset and constructs a tree on the sample until each point is isolated. In order to isolate the data points, the segmentation between the maximum and minimum values of the feature is selected to partition randomly until each point is isolated. Random partitioning of features will create shorter paths in the tree for outlier data points to distinguish them from the rest of the data.
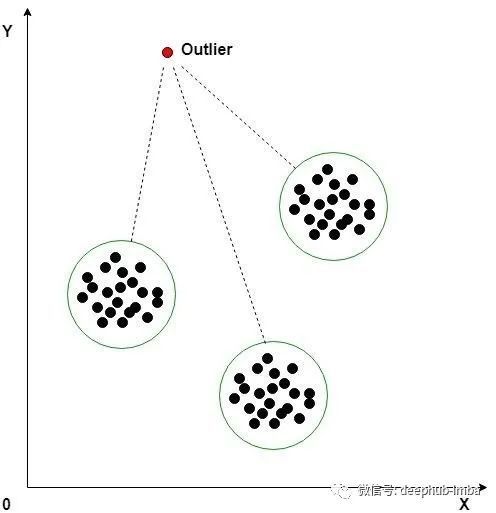
K-means clustering
K-means clustering is an unsupervised machine learning algorithm, which is often used to detect outliers in time series data. The algorithm looks at the data points in the data set and groups the similar data points into K clusters. Anomalies are distinguished by measuring the distance from the data point to its nearest centroid. If the distance is greater than a threshold, the data point is marked as abnormal. The k-means algorithm uses Euclidean distance for comparison.
Possible interview questions
If a person writes a project about time series in their resume, the interviewer can ask these possible questions from this topic:
- What are the methods of preprocessing time series data and how are they different from standard interpolation methods?
- What does time series window mean?
- Have you ever heard of isolated forests? If so, can you explain how it works?
- What is Fourier transform and why do we need it?
- What are the different ways to fill in missing values in time series data?
summary
In this paper, we study some common time series data preprocessing techniques. We start with sorting time series observation; Then various missing value interpolation techniques are studied. Because we deal with an ordered set of observations, time series interpolation is different from traditional interpolation techniques. In addition, some noise removal techniques are applied to Google stock price data set. Finally, some outlier detection methods of time series are discussed. Using all these mentioned preprocessing steps can ensure high-quality data and prepare for building complex models.
https://www.overfit.cn/post/9274a9c482b0431a802f5318c15cd76d
Author: Shashank Gupta