This paper describes how to realize the application monitoring of Prometheus
Monitoring Nginx
nginx: 1.16.1,nginx-vts-exporter: 0.10.3,nginx-module-vts: 1.6.3
Monitoring Nginx mainly uses the following three modules:
- Nginx module VTS: monitoring module of nginx, which can provide data output in JSON format.
- Nginx VTS exporter: it is mainly used to collect monitoring data of nginx and provide monitoring interface for Prometheus. The default port number is 9913.
- Prometheus: monitor the Nginx data provided by Nginx VTS exporter and store it in the timing database. You can use PromQL to query and aggregate the timing data
Nginx module VTS module compilation
The Nginx module VTS exporter depends on the Nginx module VTS module, and no other dependency is required to install this module. The version compatibility between the module and Nginx is as follows:
1.11.x (last tested: 1.11.10)
1.10.x (last tested: 1.10.3)
1.8.x (last tested: 1.8.0)
1.6.x (last tested: 1.6.3)
1.4.x (last tested: 1.4.7)
1. Install dependency package
$ yum -y install gcc gcc-c++ autoconf automake make
$ yum -y install zlib zlib-devel openssl openssl-devel pcre pcre-devel
2. Add www user
$ groupadd -f www
$ useradd -g www www
3. Download nginx (version 1.16.1)
$ wget http://nginx.org/download/nginx-1.16.1.tar.gz
$ tar xf nginx-1.16.1.tar.gz
3. Clone vts module warehouse
$ git clone git://github.com/vozlt/nginx-module-vts.git
4. Compile nginx configuration and add vts module
Add vts module at nginx compile time: -- add module = / path / to / nginx module vts
$ cd nginx-1.16.1/

# Configure nginx
# --prefix specifies the directory to install
# /usr/local/nginx is the installation directory. It can't be duplicated with the file directory you downloaded
#./configure --prefix=/usr/local/nginx

$ ./configure --user=www --group=www \
--prefix=/usr/local/nginx \
--with-http_stub_status_module \
--with-http_ssl_module \
--with-stream \
--with-http_gzip_static_module \
--with-http_sub_module \
--add-module=/root/nginx-module-vts

$ make && make install
5.Nginx config configuration
Change the configuration of Nginx Conf and add the monitoring interface / status
$ vim /usr/local/nginx/conf/nginx.conf
user www;
worker_processes  1;

events {
    worker_connections  1024;
}

http {
    include       mime.types;
    default_type  application/octet-stream;

    log_format  main  '$remote_addr - $remote_user [$time_local] "$request" '
                      '$status $body_bytes_sent "$http_referer" '
                      '"$http_user_agent" "$http_x_forwarded_for"';

    access_log  logs/access.log  main;

    sendfile        on;
    tcp_nopush     on;

    keepalive_timeout  65;

    # enabled nginx status
    vhost_traffic_status_zone;
    gzip  on;

    server {
        listen       80;
        server_name  localhost;
        location /status {
             vhost_traffic_status_display;
             vhost_traffic_status_display_format html;
             # Only allow local access the url
             allow 127.0.0.1;
        }
      }
}
Check nginx syntax and start
$ /usr/local/nginx/sbin/nginx -t
nginx: the configuration file /usr/local/nginx/conf/nginx.conf syntax is ok
nginx: configuration file /usr/local/nginx/conf/nginx.conf test is successful

$ /usr/local/nginx/sbin/nginx
6.curl view and capture nginx data
$ curl http://127.0.0.1/status/format/json
7. Install nginx VTS exporter
Download address: https://github.com/hnlq715/nginx-vts-exporter/releases
$ tar xf nginx-vts-exporter-0.10.3.linux-amd64.tar.gz
$ cp nginx-vts-exporter-0.10.3.linux-amd64/nginx-vts-exporter  /usr/local/bin/

//Start command
nginx-vts-exporter -nginx.scrape_uri=http://127.0.0.1/status/format/json
6. Add nginx VTS exporter to system service
$ vim /usr/lib/systemd/system/nginx-vts-exporter.service
[Unit]
Description=Prometheus
Wants=network-online.target
After=network-online.target

[Service]
User=root
Group=root
Type=simple
ExecStart=/usr/local/bin/nginx-vts-exporter \
-nginx.scrape_uri=http://127.0.0.1/status/format/json

[Install]
WantedBy=multi-user.target
7. Start the added system service
$ systemctl daemon-reload
$ systemctl start nginx-vts-exporter.service
$ systemctl enable nginx-vts-exporter.service

// Nginx VTS exporter default port - 9913
$ netstat -lntup | grep "9913"
tcp6       0      0 :::9913                 :::*                    LISTEN      9195/nginx-vts-expo
8. Use prometheus monitoring to modify the monitoring end configuration file
$ vim /usr/local/prometheus/prometheus.yml
  - job_name: 'nginx'
    static_configs:
      - targets: ['10.0.0.171:9913']
9. Start prometheus service
$ systemctl restart prometheus.service
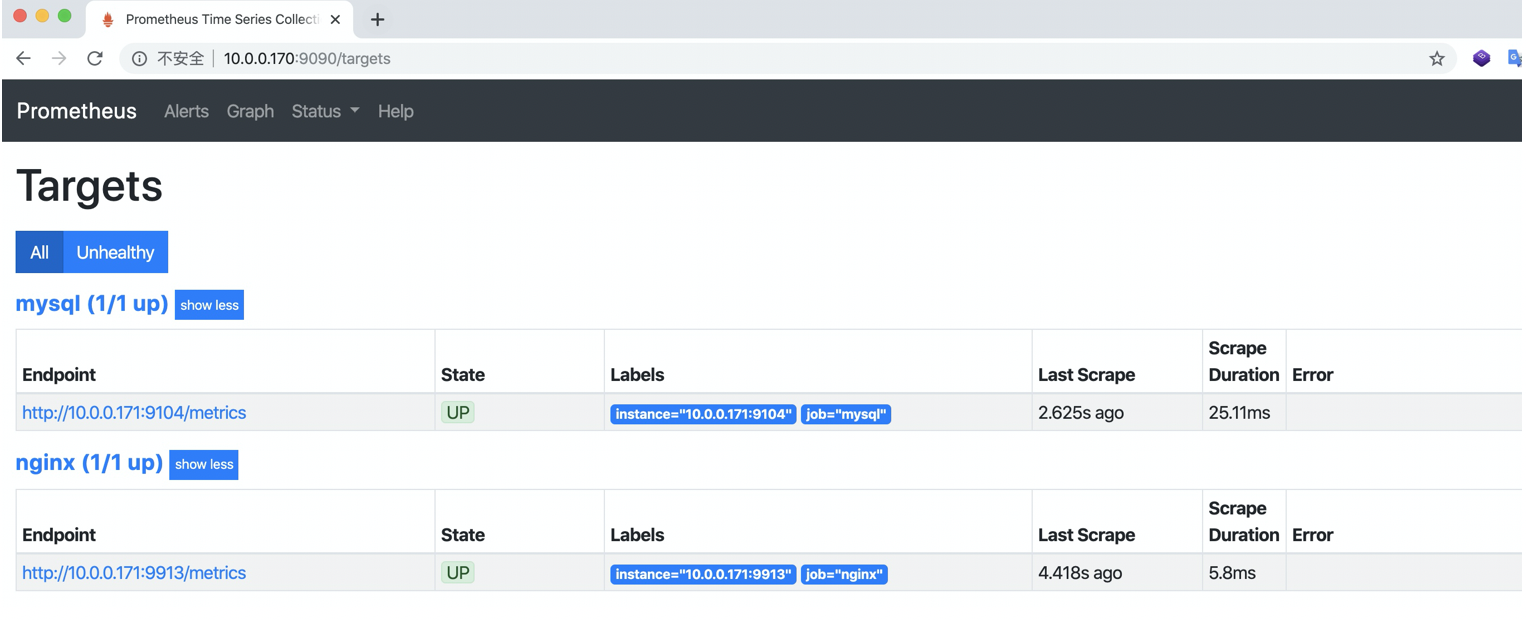
10. Check whether the monitoring terminal is involved
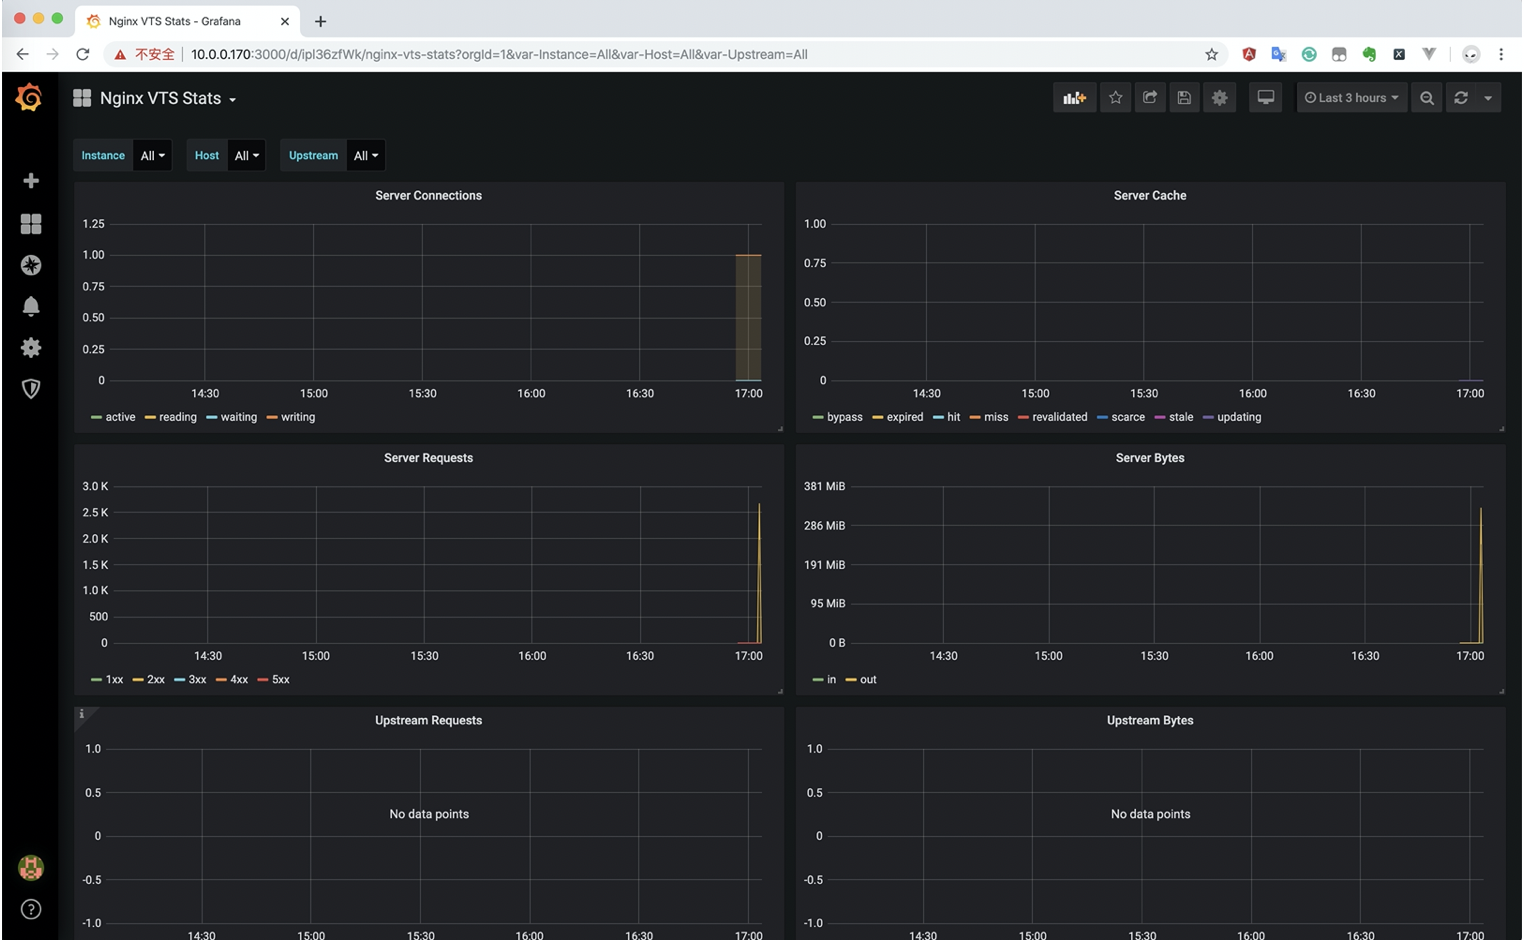
11. Granfina import Nginx monitoring chart
Monitoring MySQL
This paper mainly monitors the master-slave information of MySQL/MySQL
Version: mysql-5.7, mysql_exporter-0.12.1
Download address of MySQL exporter: https://github.com/prometheus/mysqld_exporter/releases
1. Download MySQL ﹣ exporter and unzip it
$ tar xf mysqld_exporter-0.12.1.linux-amd64.tar.gz

// Copy MySQL? Exporter binary to / usr/local/bin
$ cp mysqld_exporter-0.12.1.linux-amd64/mysqld_exporter /usr/local/bin/
2. Users need to be authorized to use for the exporter
> CREATE USER 'exporter'@'localhost' IDENTIFIED BY 'abc12345' WITH MAX_USER_CONNECTIONS 3;

// You can view the master-slave running status, view threads, and all databases.
> GRANT PROCESS, REPLICATION CLIENT, SELECT ON *.* TO 'exporter'@'localhost';
Set the maximum number of connections for this user to avoid overloading the server due to excessive monitoring data
3. Modify mysql configuration file, add the exporter user and password just created
$ vim /etc/my.cnf
[client]
user=exporter
password=abc12345
4. To start the exporter client, you need to specify the mysql configuration file and read the exporter user and password
$ mysqld_exporter --config.my-cnf=/etc/my.cnf

//Common parameters:
// Choose to collect innodb
--collect.info_schema.innodb_cmp
// innodb storage engine status
--collect.engine_innodb_status
// Specify profile
--config.my-cnf="/etc/my.cnf"
5. Add system system service
$ vim /usr/lib/systemd/system/mysql_exporter.service
[Unit]
Description=Prometheus
Wants=network-online.target
After=network-online.target

[Service]
User=root
Group=root
Type=simple
ExecStart=/usr/local/bin/mysqld_exporter \
--config.my-cnf=/etc/my.cnf

[Install]
WantedBy=multi-user.target
6. Start the added system service
$ systemctl daemon-reload
$ systemctl start mysql_exporter.service
$ systemctl enable mysql_exporter.service

// MySQL export default port - 9104
$ netstat -lntup | grep "9104"
tcp6       0      0 :::9104                 :::*                    LISTEN      34137/mysqld_export
7.curl view and capture mysql data
curl http://localhost:9104/metrics
8. Use prometheus monitoring to modify the monitoring end configuration file
$ vim /usr/local/prometheus/prometheus.yml
  - job_name: 'mysql'
    scrape_interval: 5s
    # Static add node
    static_configs:
      - targets: ['10.0.0.171:9104']
9. Start prometheus service
$ systemctl restart prometheus.service
10. Check whether the monitoring terminal is involved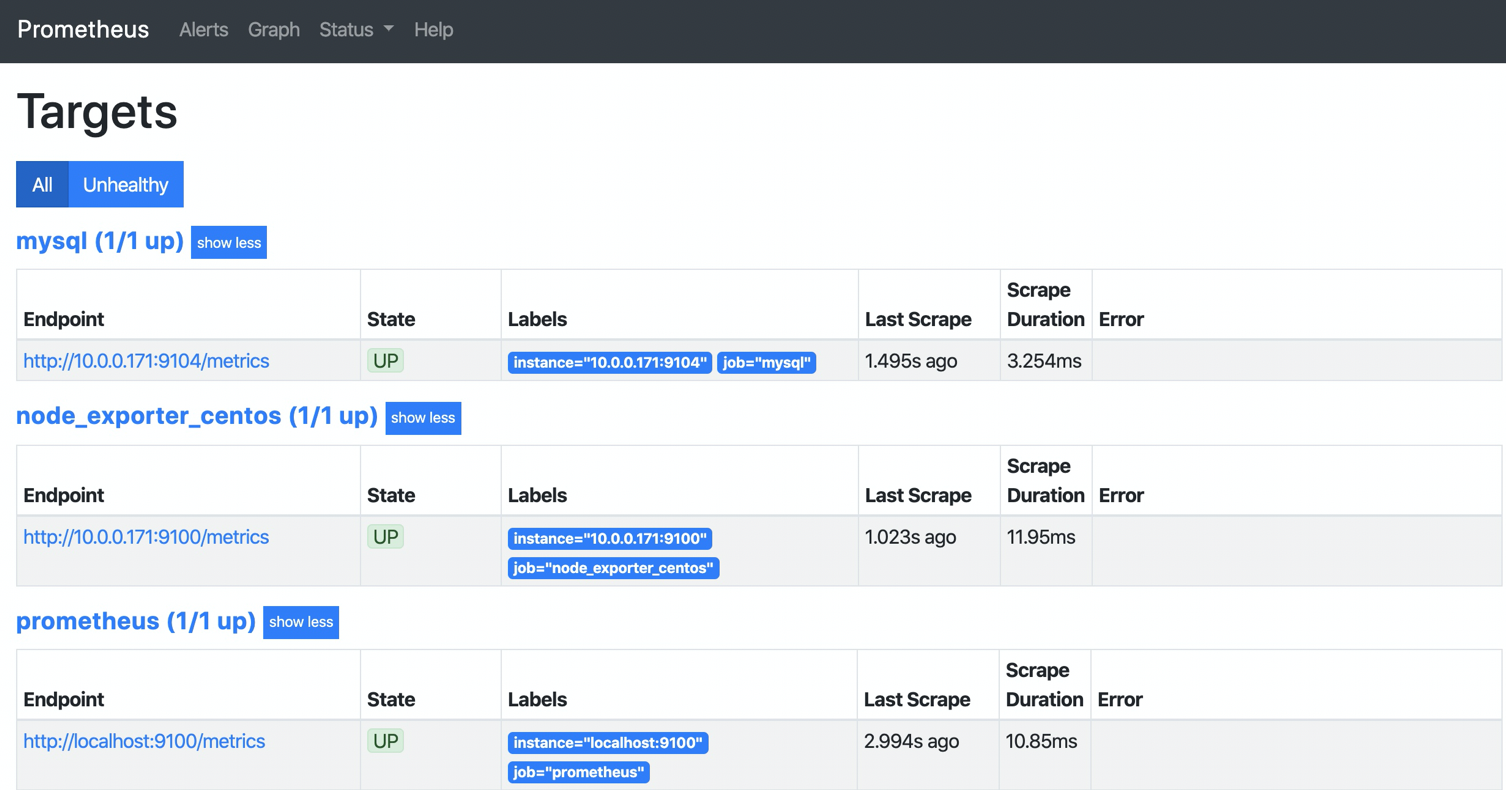
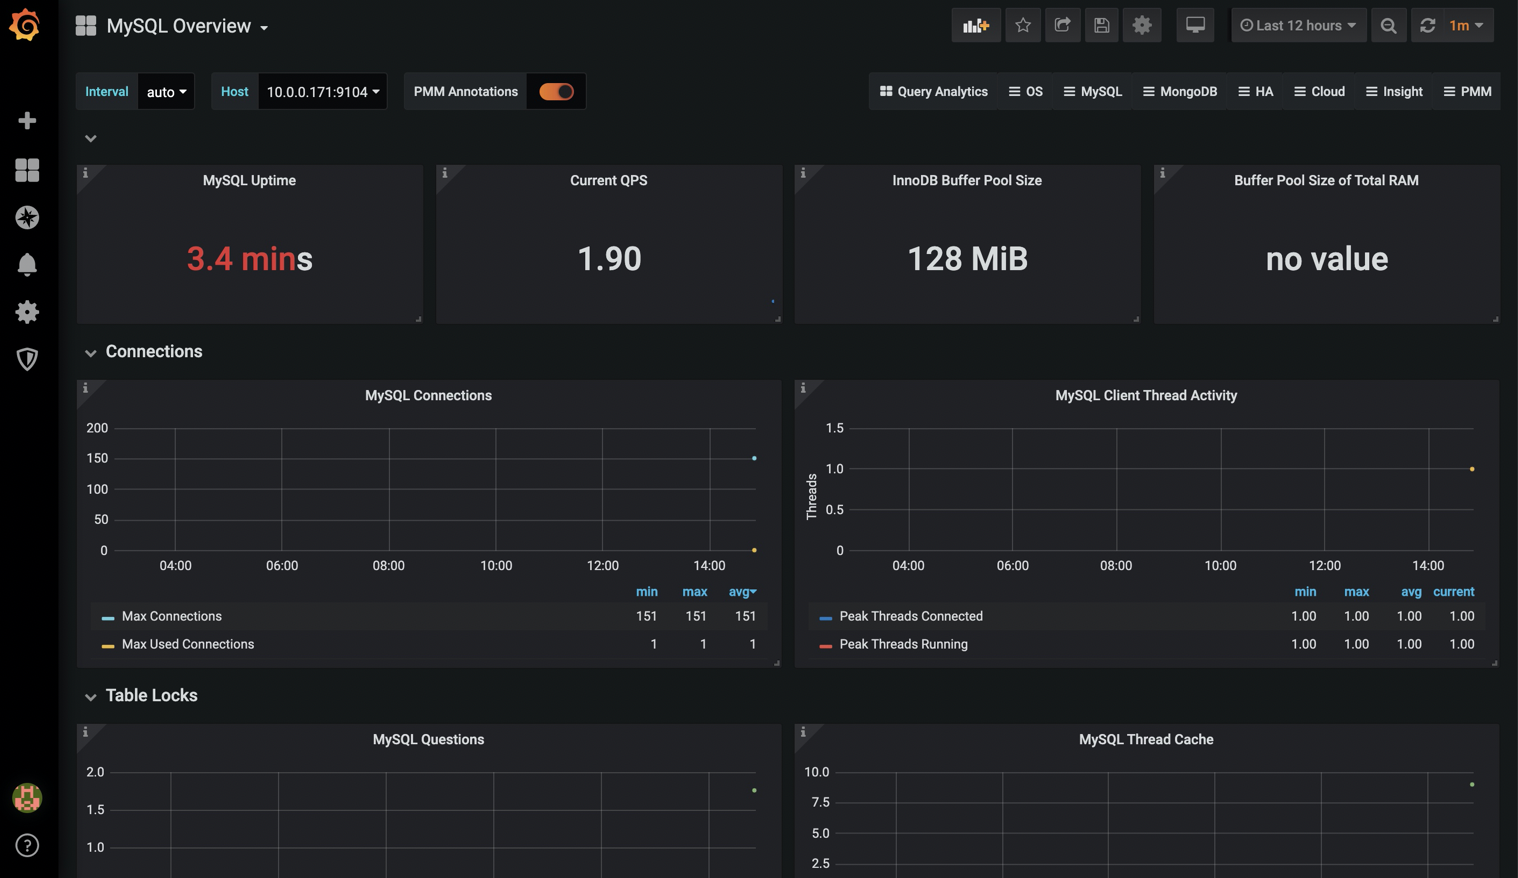
11. Granana imports MySQL monitoring chart
Monitoring Redis
This paper mainly monitors redis information
Version: redis-3.2.2, redis [exporter-1.3.4
Install and deploy redis: https://blog.51cto.com/12643266/2349586
Redis? Exporter download address: https://github.com/oliver006/redis_exporter/releases/
1. Download the redis? Exporter plug-in
Agent plug-ins do not have to be installed on redis
$ wget https://github.com/oliver006/redis_exporter/releases/download/v1.3.4/redis_exporter-v1.3.4.linux-amd64.tar.gz
$ tar xf redis_exporter-v1.3.4.linux-amd64.tar.gz
$ cp redis_exporter-v1.3.4.linux-amd64/redis_exporter  /usr/local/bin/
2. Start redis? Exporter and log in to redis
// No password
redis_exporter -redis.addr 127.0.0.1:6379
// Password
redis_exporter -redis.addr 172.0.0.1:6379  -redis.password 123456
3. Add system system service
$ vim /usr/lib/systemd/system/redis_exporter.service
[Unit]
Description=Prometheus
Wants=network-online.target
After=network-online.target

[Service]
User=root
Group=root
Type=simple
ExecStart=/usr/local/bin/redis_exporter \
-redis.addr 127.0.0.1:6379

[Install]
WantedBy=multi-user.target
4. Start the added system service
$ systemctl daemon-reload
$ systemctl start redis_exporter.service
$ systemctl enable redis_exporter.service

// Redis? Exporter default port - 9121
$ netstat -lntup | grep 9121""
tcp6       0      0 :::9121                 :::*                    LISTEN      4465/redis_exporter
5. Local curl access
curl http://127.0.0.1:9121/metrics
6. Add prometheus.yml to the redis node and restart Prometheus:
  - job_name: 'redis'
    static_configs:
      - targets: ['10.0.0.171:9121']
7. Restart the prometheus server
systemctl restart prometheus.service
8. Check whether the monitoring terminal is involved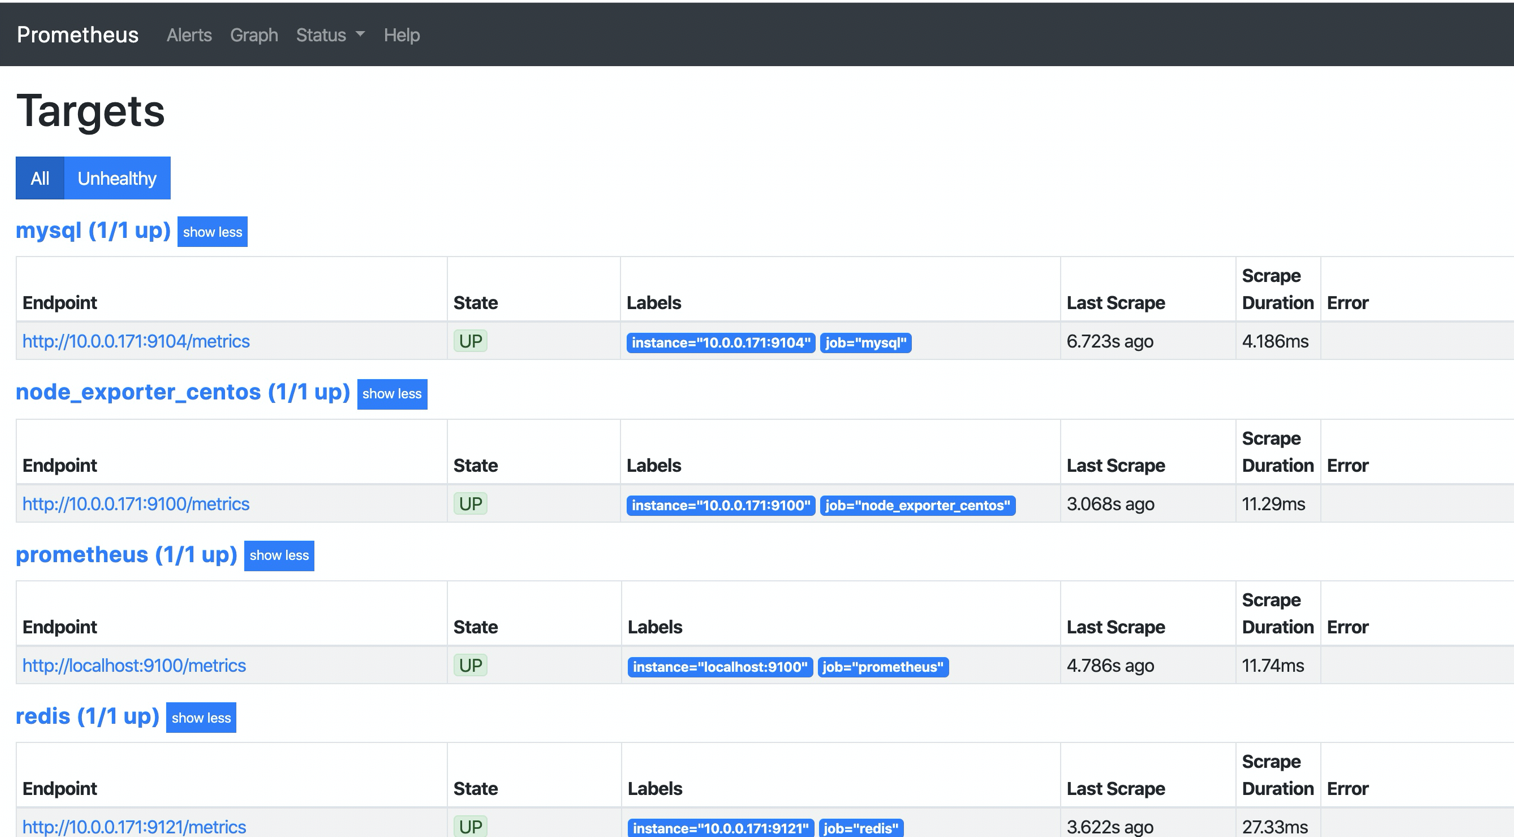
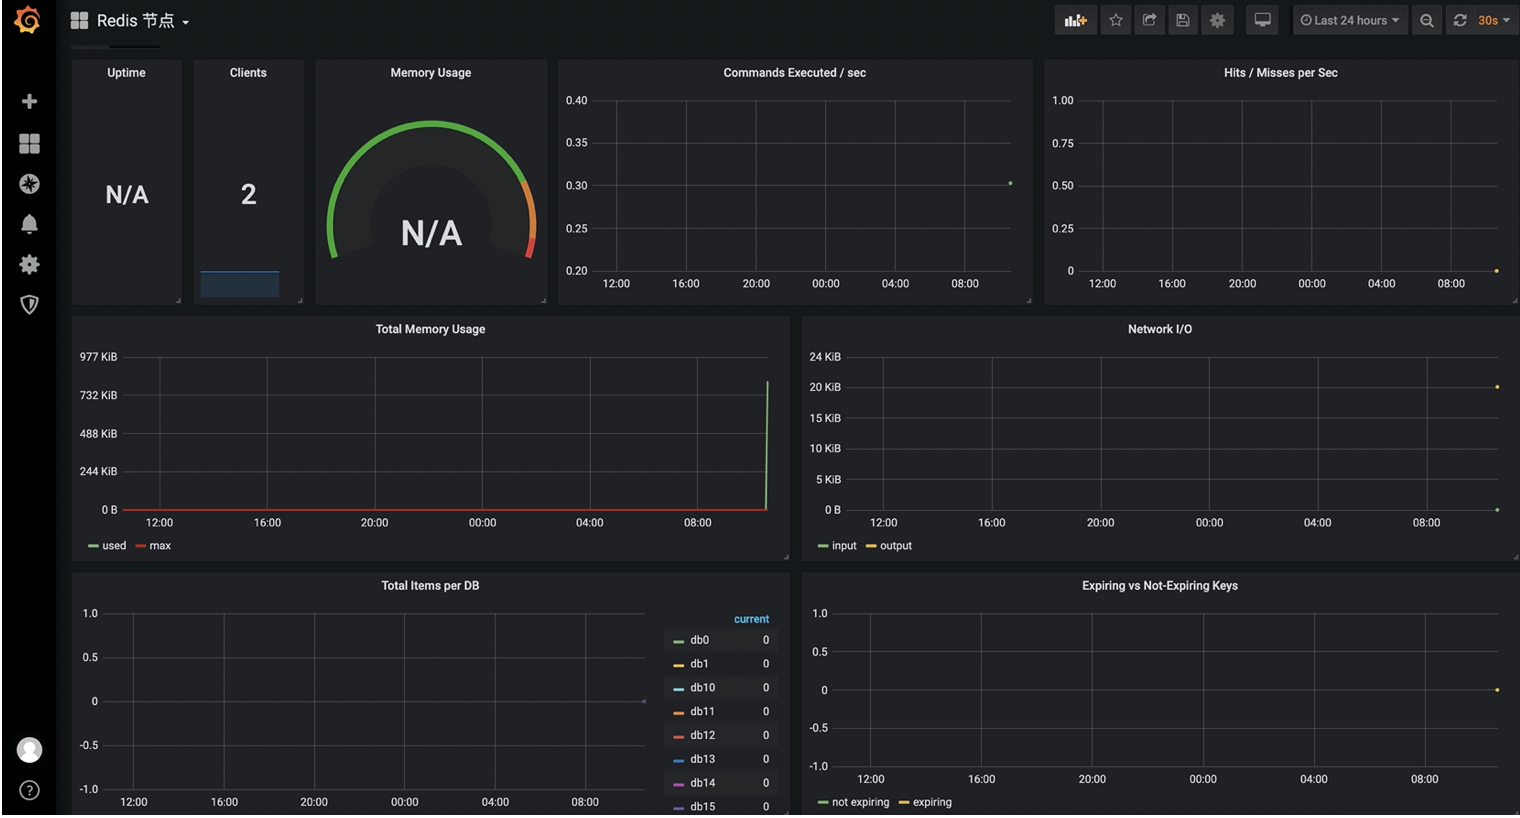
9. Granana imports Redis monitoring chart
redis node monitoring: https://grafana.com/grafana/dashboards/2751
redis sentinel monitoring: https://grafana.com/grafana/dashboards/9570