Prometheus Deployment Lab Server Assignment
host name             address                   Installation package
prometheus 192.168.80.1    prometheus-2.27.1.linux-amd64.tar.gz
server1    192.168.80.2    node_exporter-1.1.2.linux-amd64.tar.gz
server2    192.168.80.3
server3    192.168.80.4
1. Make time synchronization
ntpdate ntp1.aliyun.com
2. Decompression
[root@prometheus ~]# tar zxf prometheus-2.27.1.linux-amd64.tar.gz -C /usr/local/
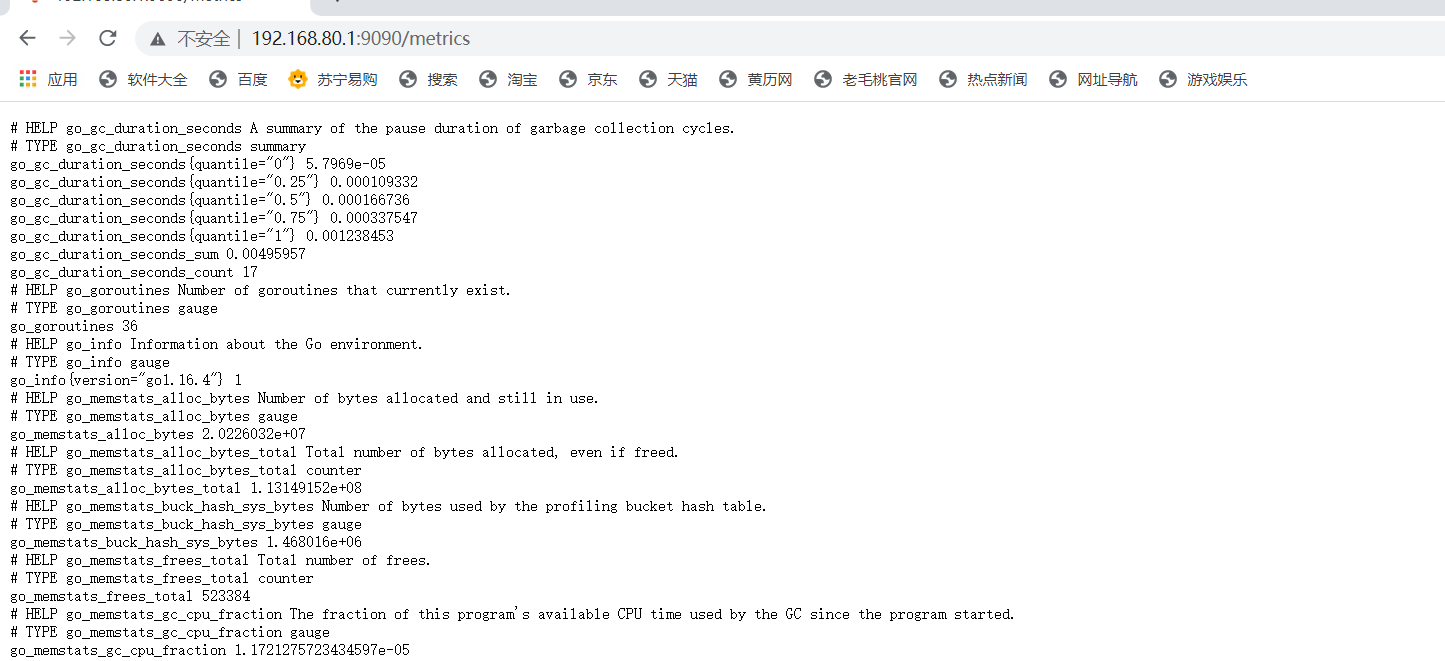
3. Run View Port
[root@prometheus ~]# /usr/local/prometheus-2.27.1.linux-amd64/prometheus
[root@prometheus ~]# ss -antp | grep 9090   #Open View in Another Terminal

4. Access web pages (expression browser)
192.168.80.1:9090
(5) Deployment and monitoring of other nodes
Prometheus wants to monitor other nodes by downloading the address with the help of node_exporter http://prometheus.io/download/
Tencent Cloud Disk prometheus Installation Package
[root@node1 ~]# tar zxf node_exporter-1.1.2.linux-amd64.tar.gz  -C /opt
[root@node1 ~]# cd /opt/node_exporter-1.1.2.linux-amd64/
[root@node1 node_exporter-1.1.2.linux-amd64]# ls
LICENSE  node_exporter  NOTICE
[root@node1 node_exporter-1.1.2.linux-amd64]# cp node_exporter  /usr/local/bin/
[root@node1 node_exporter-1.1.2.linux-amd64]# ./node_exporter
Modify prometheus configuration file
[root@prometheus ~]# vim /usr/local/prometheus-2.27.1.linux-amd64/prometheus.yml
restart
[root@prometheus prometheus-2.27.1.linux-amd64]# ./prometheus
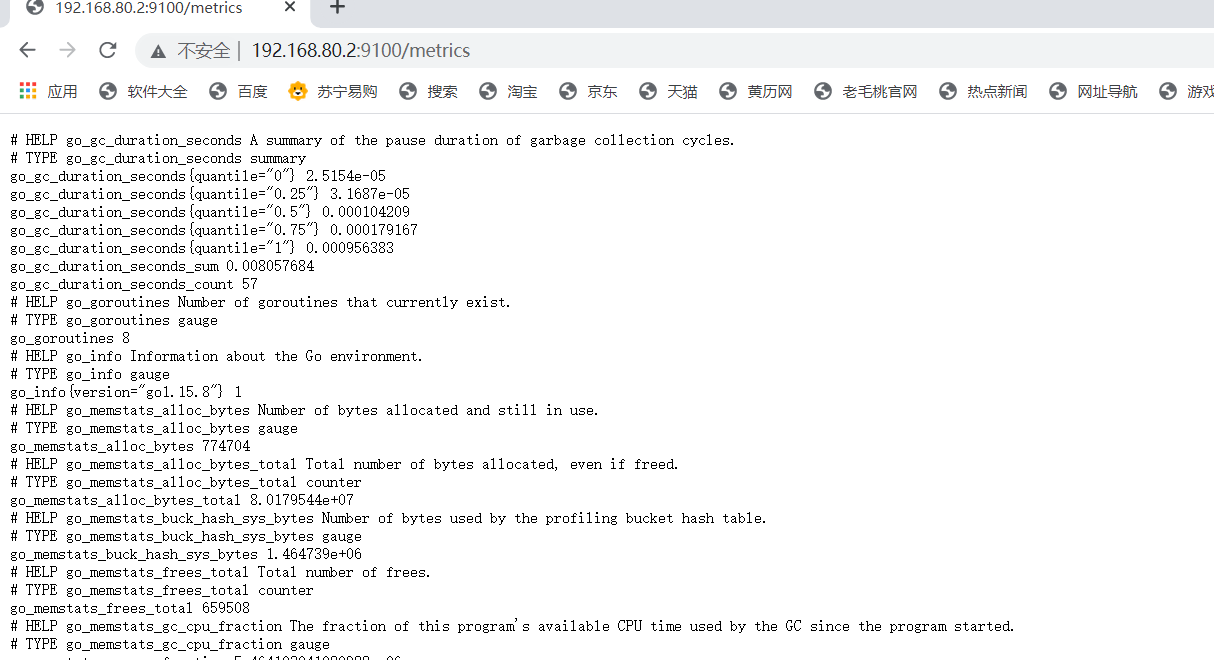
View indicator data on node1
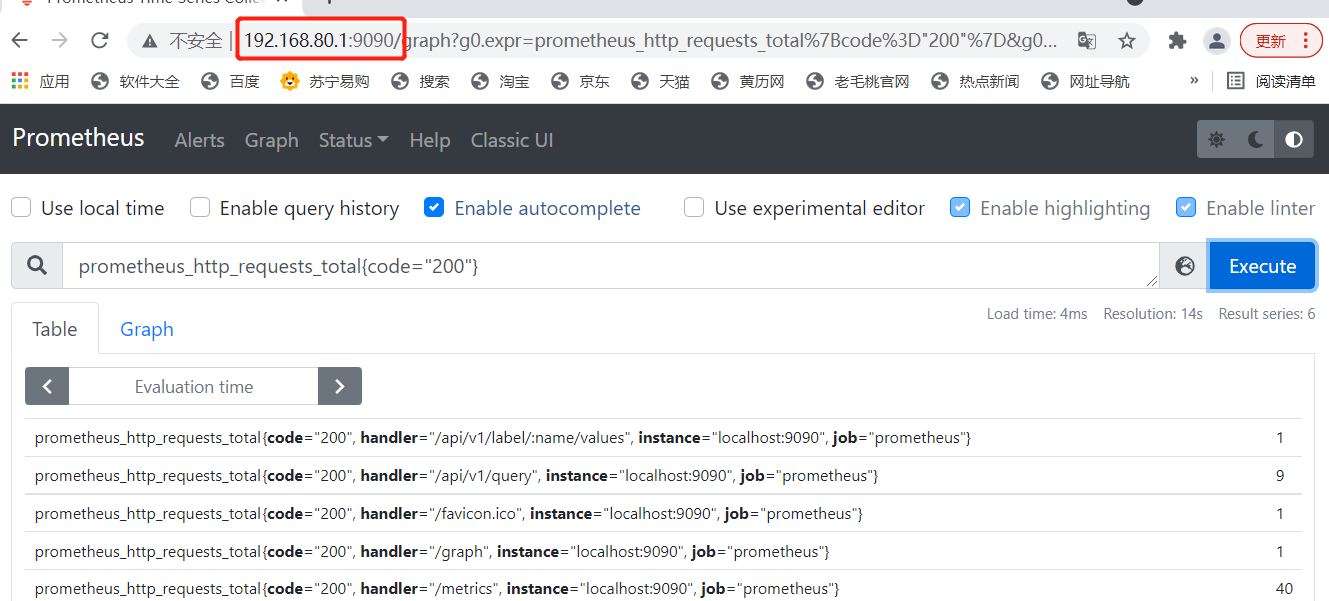
(6) Expression Browser (promQL filter use)
1. Expression Browser General Use
Data filtering is available on the prometheusUI console
Simple usage:
#Total CPU usage
node_cpu_seconds_total
Calculate CPU usage over the last 5 minutes
PromQL: irate(node_cpu_seconds_total{cpu="0",mode="idle"}[5m])
Resolution:
irate: Rate calculation function (very sensitive)
Node_cpu_seconds_total:Total CPU usage of node (indicator)
modd="idle" idle indicator
5m: Sample values of all CPU idles over the last 5 minutes, with each value performing a rate operation
{mode= "idle"}: collectively referred to as label filter
Average CPU usage per host in 5 minutes
PromQI:(1-avg(irate(node_cpu_seconds_total{cpu="0",mode="idle"}[5m]))by(instance))*100
analysis
avg:Average
avg (irate (node_cpu_seconds_total{fmode='idle'} [5m]): can be understood as the percentage of CPU idle
by (instance): represents all nodes
(1- avg (irate(node_cpu_seconds_total{(mode='idle'[5m]) )by(instance))* 100:CPU 5 Average usage in minutes
Other commonly used indicators:
1. Average load of query minute
node_load1 > on (instance) 2 * count (node_cpu_seconds_total{mode='idle'})by (instance)
node_load5
node_load15
1,5,15 Minute cpu load
 Generally speaking, the above values cannot be longer than CPU Core Quantity
2. Memory usage
node_memory_MemTotal_bytes
node_memory_MemFree_bytes
node_memory_Buffers_bytes
node_memory_Cached_ bytes
Calculate usage:
Available space: the sum of the last three indicators
Used space: total space minus available space
Usage: Used space divided by total space
Deploy service discovery service discovery discovery
(1) Related concepts
1. Lifecycle of Prometheus Indicator Capture
                  Hide sensitive data                    Integrate multiple labels for single custom indicator data output
 find -> To configure -> relabel(Relabel)-> Indicator Data Grabbing -> metrics relabel
Prometheus service discovery (based on various mainstream service discovery buses such as file, DNS, consul, k8s, etc.)
(1) File-based service discovery;
(Defines a set of resource "sub" configuration files in yaml format that contain only the targets information that the party needs to collect, which can be dynamically obtained by the pro without restarting)
(2) DNS-based service discovery;
3. API-based service discovery: Kubernetes, Consul, Azure, Re-labeling
target Re-labeling
Metrics relabeling
(4) K8s-based service discovery
2. prometheus service discovery mechanism
1 Prometheus Server works on the Pull model, so it must know where each Target is before it can fetch data from the appropriate Exporter or Instrumentation
(2) For small system environments, specifying each Target through static_dpnfigs solves the problem, which is also the simplest configuration method;Each Targets is identified by a network endpoint (ip:port);
(3) Static configuration is obviously difficult to apply in large and medium system environments or cloud computing environments with strong dynamic characteristics;
Therefore, Prometheus has designed a set of service discovery mechanisms to automatically discover, detect, classify each Target that can be monitored based on the Service Registry (Service Bus), and update the life cycle of Target metrics capture that have changed.
(4) During each scrape_interval, Prometheus checks for jobs executed (Jobs); these jobs are first checked against
The discovery configuration specified on Job generates a target list, which is the service discovery process; service discovery returns a Target list containing a set of tags called metadata prefixed with "meta_";
Service discovery also sets other tags based on the target configuration, which have "prefix and suffix, b includes" scheme","address"and"metrics path_", respectively, with the target support usage protocol (http or https by default, http), the target address, and the URI path of the indicator (default is/metrics);
If any parameters exist in the URI path, their prefix will be set to "param" These target lists and tags will be returned to Prometheus, some of which tags can also be overridden in the configuration;
Configuration tags are reused during the capture lifecycle to generate other tags, for example, the default value of the instance tag on the indicator comes from the value of the address tag;
For each discovered goal, Prometheus provides an opportunity to relabel the target, which is defined in the relabel_config configuration of the job configuration section and is often used to achieve the following functions
Attach information from metadata tags discovered by the service to the tags of the metrics
Filter target:
# is followed by data grabbing and the process of returning indicators that allow users to retype and filter indicators before they are saved
#It is defined in the metric_relabel_configs configuration of the job configuration section and is often used to implement the following functions#book Deletes unnecessary metrics
#Remove sensitive or unwanted labels from the indicator book
#Add, edit, or modify label values or formats for metrics
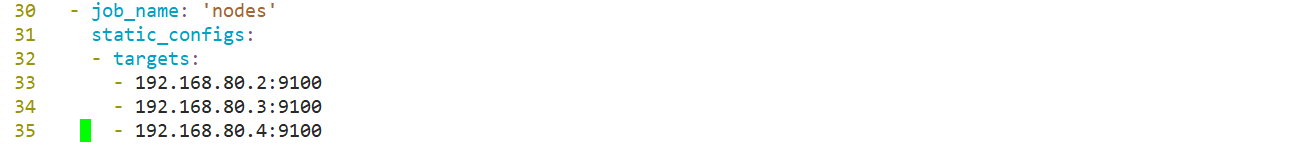
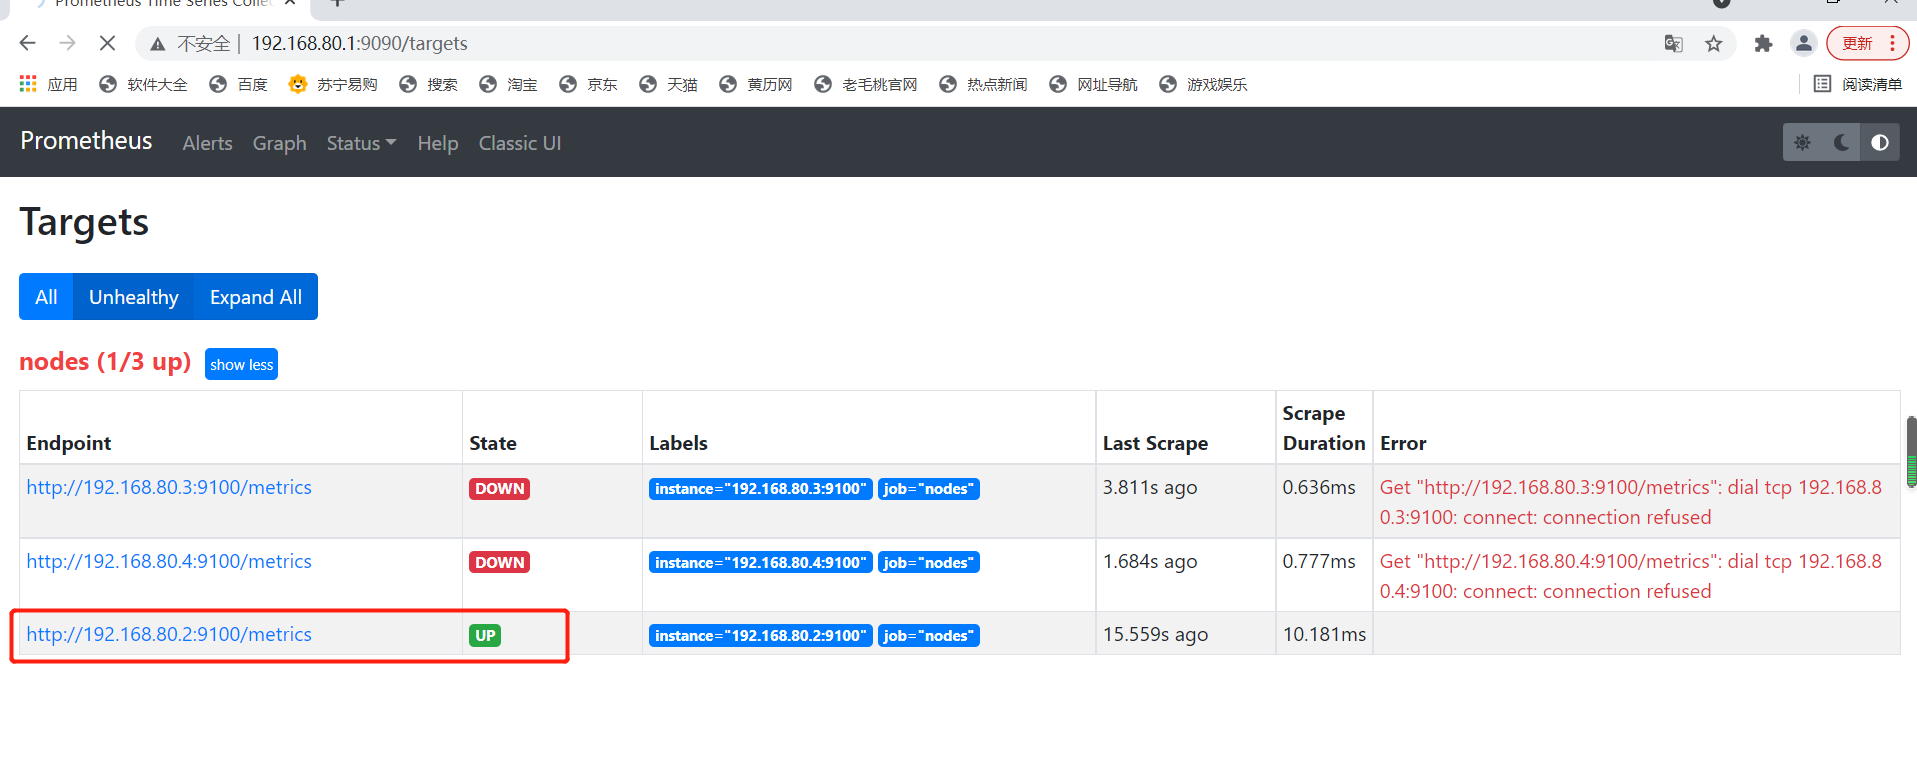
(2) Static configuration discovery
Modify the configuration file on the prometheus server to specify that the targets port has been configured on it
- job_name: 'nodes'
  static_config:
  - targets:
    -192.168.80.2:9100
    -192.168.80.3:9100
    -192.168.80.4:9100
(3) Dynamic Discovery
1. File Service Discovery
192.168.80.1
File-based service discovery is only slightly better than statically configured service discovery, and it does not depend on any platform or third-party services, and is therefore the simplest and most common implementation.prometheus server periodically loads target information from files (pro-server pull indicator discovery mechanism-job_name)
Get the object target I want to pul1) The file can be in json and yaml formats only. It contains a list of defined targets and optional tag information. The first configuration below converts the default static configuration of prometheus to the configuration required for file-based service discovery.(rometheus periodically reads and overloads the configuration in this file for dynamic discovery and update)
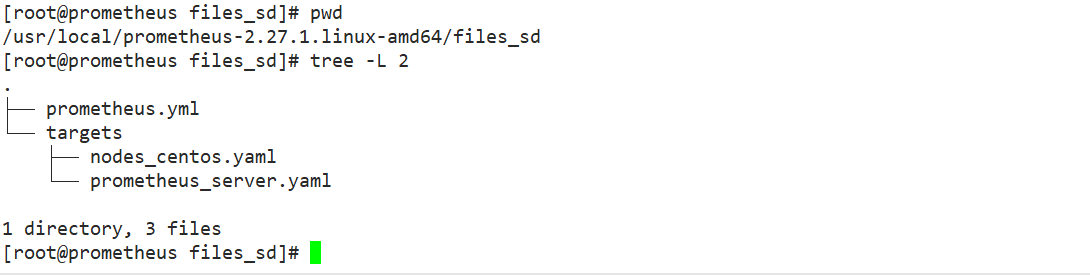
[root@prometheus files_sd]# cat prometheus.yml
# my global config
# Author: MageEdu <mage@magedu.com>
# Repo: http://gitlab.magedu.com/MageEdu/prometheus-configs/
global:
  scrape_interval:     15s # Set the scrape interval to every 15 seconds. Default is every 1 minute.
  evaluation_interval: 15s # Evaluate rules every 15 seconds. The default is every 1 minute.
  # scrape_timeout is set to the global default (10s).

# Alertmanager configuration
alerting:
  alertmanagers:
  - static_configs:
    - targets:
      # - alertmanager:9093

# Load rules once and periodically evaluate them according to the global 'evaluation_interval'.
rule_files:
  # - "first_rules.yml"
  # - "second_rules.yml"

# A scrape configuration containing exactly one endpoint to scrape:
# Here it's Prometheus itself.
scrape_configs:
  # The job name is added as a label `job=<job_name>` to any timeseries scraped from this config.
  - job_name: 'prometheus'

    # metrics_path defaults to '/metrics'
    # scheme defaults to 'http'.

    file_sd_configs:
    - files:
      - targets/prometheus_*.yaml
      refresh_interval: 2m

  # All nodes
  - job_name: 'nodes'
    file_sd_configs:
    - files:
      - targets/nodes_*.yaml
      refresh_interval: 2m
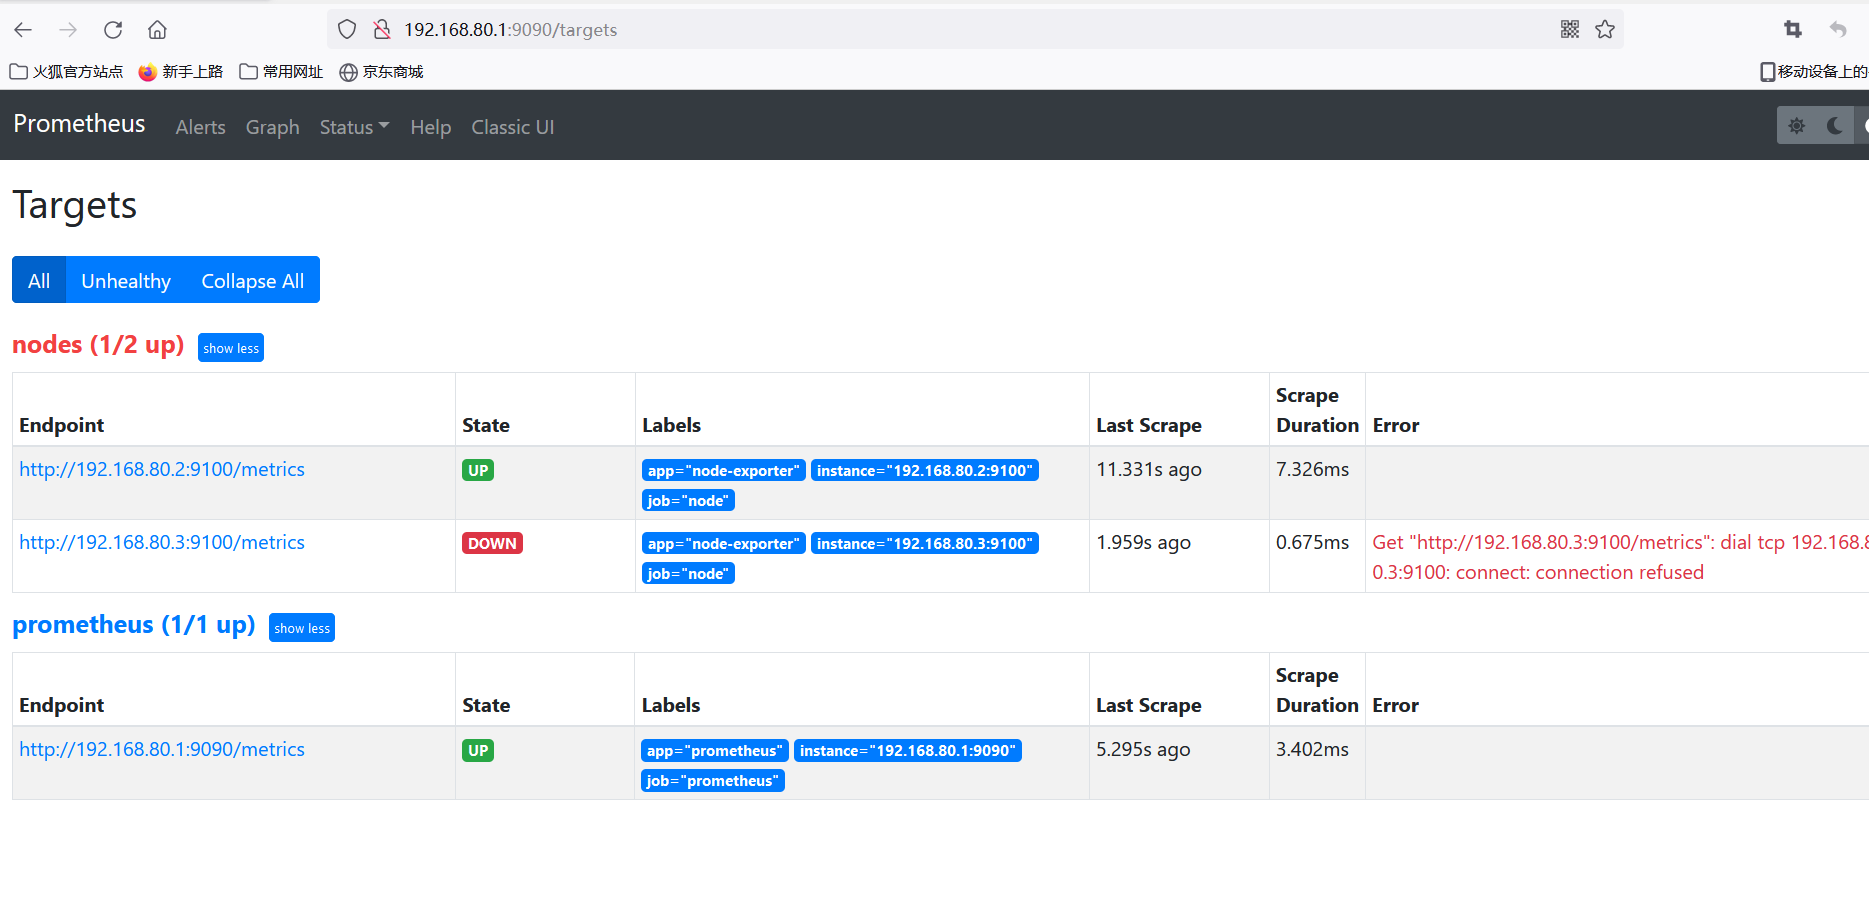
[root@prometheus targets]# cat nodes_centos.yaml
- targets:
  - 192.168.80.2:9100
  - 192.168.80.3:9100
  labels:
    app: node-exporter
    job: node
[root@prometheus targets]# cat prometheus_server.yaml
- targets:
  - 192.168.80.1:9090
  labels:
    app: prometheus
    job:  prometheus
Specify yml file startup
[root@prometheus prometheus-2.27.1.linux-amd64]# ./prometheus --config.file=./files_sd/prometheus.yml
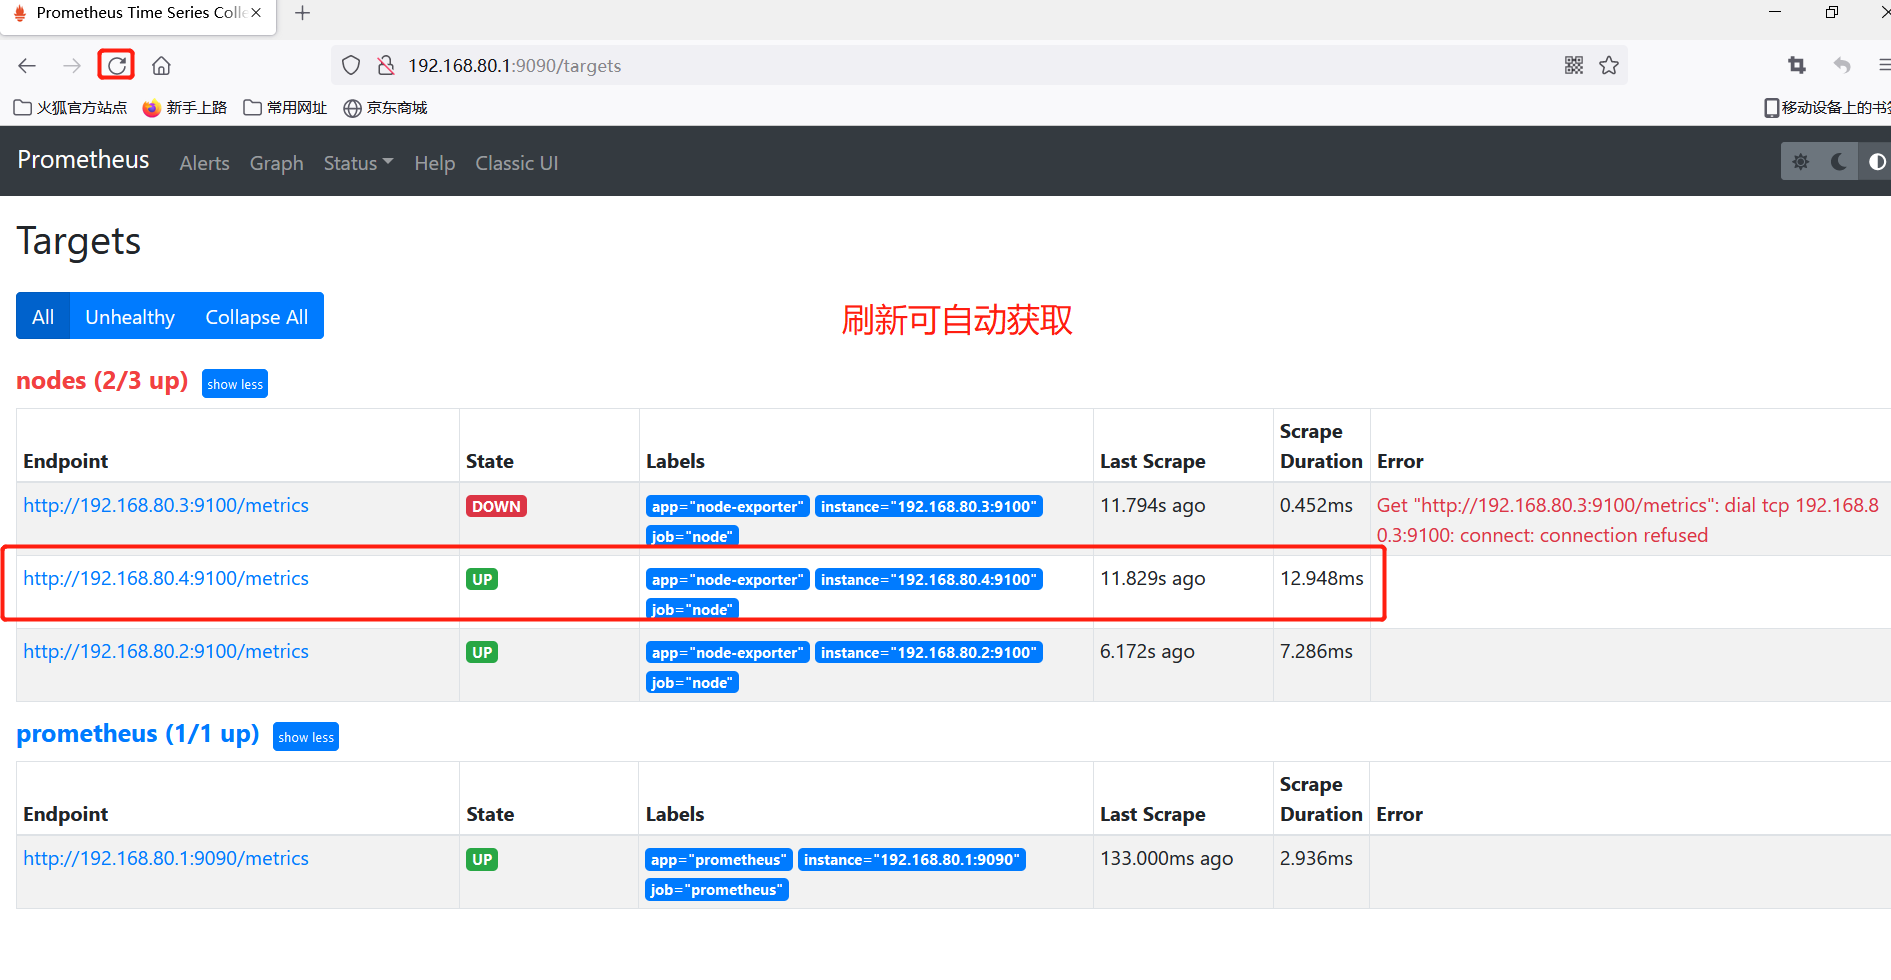
Add 192.168.80.4 Nodes
192.168.80.4 node3 starts exporter
[root@node3 ~]# tar zxf node_exporter-1.1.2.linux-amd64.tar.gz  -C /opt
[root@node3 ~]# tar zxf node_exporter-1.1.2.linux-amd64.tar.gz  -C /opt
[root@node3 ~]#  cd /opt/node_exporter-1.1.2.linux-amd64/
[root@node3 node_exporter-1.1.2.linux-amd64]# cp node_exporter  /usr/local/bin/
[root@node3 node_exporter-1.1.2.linux-amd64]# ./node_exporter
nodes_centos.yaml File Add Node
[root@prometheus targets]# vim nodes_centos.yaml