Use Prometheus and Grafana to monitor MySQL server performance.
Use two exporter s:
Node? Exporter: server system data collection
mysqld_exporter: MySQL server data collection
Monitoring architecture: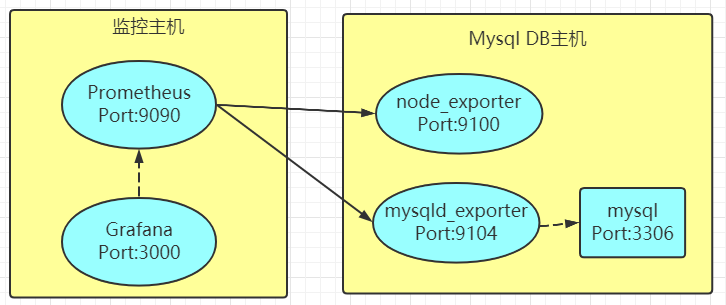
- Prometheus installation configuration
Installation mode binary installation, see here for details CentOS7 deployment Prometheus
Version: current latest prometheus-2.18.1
Modify the Prometheus configuration file prometheus.yml to mainly configure the scratch configuration item.scrape_configs: # The job name is added as a label `job=<job_name>` to any timeseries scraped from this config. - job_name: 'prometheus' # metrics_path defaults to '/metrics' # scheme defaults to 'http'. static_configs: - targets: ['10.20.1.63:9090'] - job_name: 'local_node' static_configs: - targets: ['10.20.1.63:9100'] labels: instance: prometheus_node - job_name: 'mysql01' static_configs: - targets: ['10.20.10.18:9104'] labels: instance: db1 - job_name: 'mysql02' static_configs: - targets: ['10.20.10.19:9104'] labels: instance: db2 - Install exporter
Download and install node and mysqld exporters. Download https://prometheus.io/download from the official website/
The versions are node-0.18.1 and mysqld-0.12.1, respectively.
1) Install node? Exporterwget https://github.com/prometheus/node_exporter/releases/download/v0.18.1/node_exporter-0.18.1.linux-amd64.tar.gz mkdir -p /opt/prometheus tar xzvf node_exporter-0.18.1.linux-amd64.tar.gz mv node_exporter-0.18.1.linux-amd64 /opt/prometheus/ ln -s /opt/prometheus/node_exporter-0.18.1.linux-amd64/ /opt/prometheus/node_exporter
Add system service startup
First, create a prometheus user to start the node [exporter].useradd -s /sbin/nologin -M prometheus
vim /usr/lib/systemd/system/node_exporter.service
[Unit]
Description=node_exporter
Documentation=https://prometheus.io/
After=network.target
[Service]
Type=simple
User=prometheus
ExecStart=/opt/prometheus/node_exporter/node_exporter
Restart=on-failure
[Install]
WantedBy=multi-user.target
Start the node exporter service
systemctl status node_exporter.service
2) Install mysqld? Exporter
wget https://github.com/prometheus/mysqld_exporter/releases/download/v0.12.1/mysqld_exporter-0.12.1.linux-amd64.tar.gz
mkdir -p /opt/prometheus
mv /usr/local/mysqld_exporter-0.12.1.linux-amd64/ /opt/prometheus/
ln -s /opt/prometheus/mysqld_exporter-0.12.1.linux-amd64/ /opt/prometheus/mysqld_exporter
chown -R prometheus:prometheus /opt/prometheus/
Add system service startup
First, create the prometheus user to start mysqld_exporter.useradd -s /sbin/nologin -M prometheus
vim /usr/lib/systemd/system/mysqld_exporter.service
[Unit]
Description=node_exporter
Documentation=https://prometheus.io/
After=network.target
[Service]
Type=simple
User=prometheus
ExecStart=/opt/prometheus/mysqld_exporter/mysqld_exporter --config.my-cnf=/opt/prometheus/mysqld_exporter/.my.cnf
Restart=on-failure
[Install]
WantedBy=multi-user.target
Startup parameters: - config.my-cnf=".my.cnf" ා specify the configuration file
Start mysqld? Exporter servicesystemctl status mysqld_exporter.service
Mysqld ﹣ exporter needs to connect to MySQL, so it needs the permission of Mysql to create the user of MySQL ﹣ exporter and give the required permission.
mysql> GRANT REPLICATION CLIENT,PROCESS ON *.* TO 'mysql_exporter'@'localhost' identified by 'xxxxxx';
mysql> GRANT SELECT ON *.* TO 'mysql_exporter'@'localhost';
Create the. my.cnf file and restart the mysqld? Exporter service.
vim /opt/prometheus/mysqld_exporter/.my.cnf[client] user=mysql_exporter password=xxxxxx
- Prometheus monitoring
Go back to Prometheus and check the status - > targets page on the Web. You can see that the State of the Target is UP, indicating that the exporter has collected the monitoring data.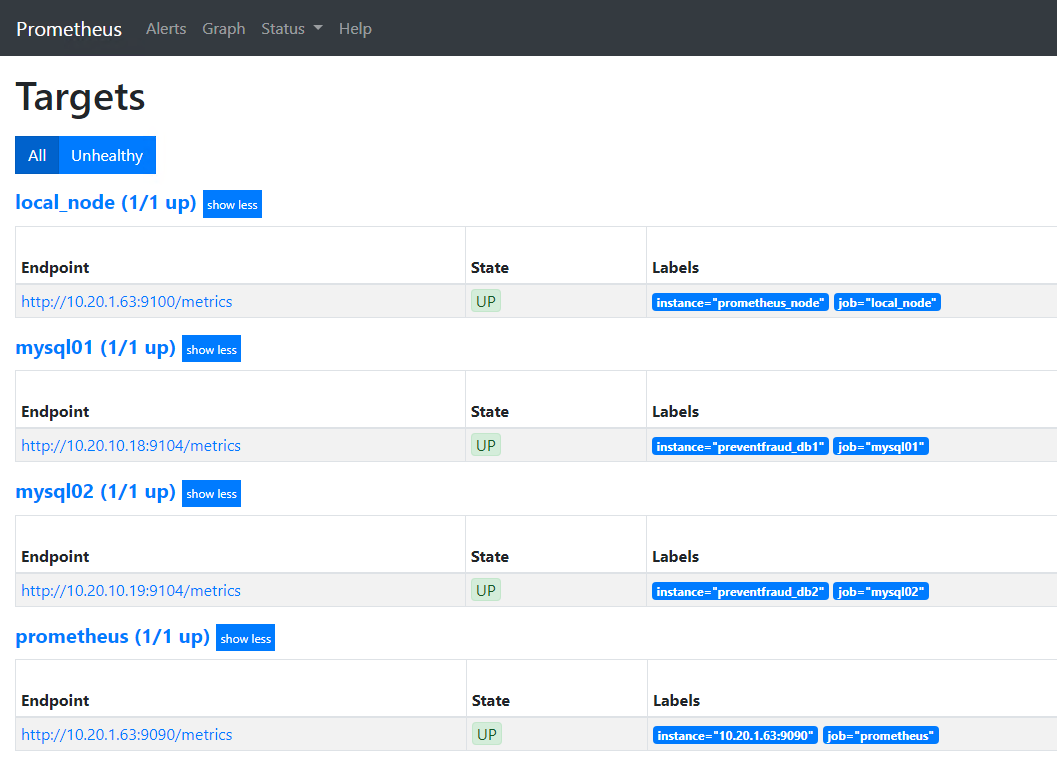
Prometheus monitoring uses promSQL to view mysql monitoring information, such as mysql global status connections.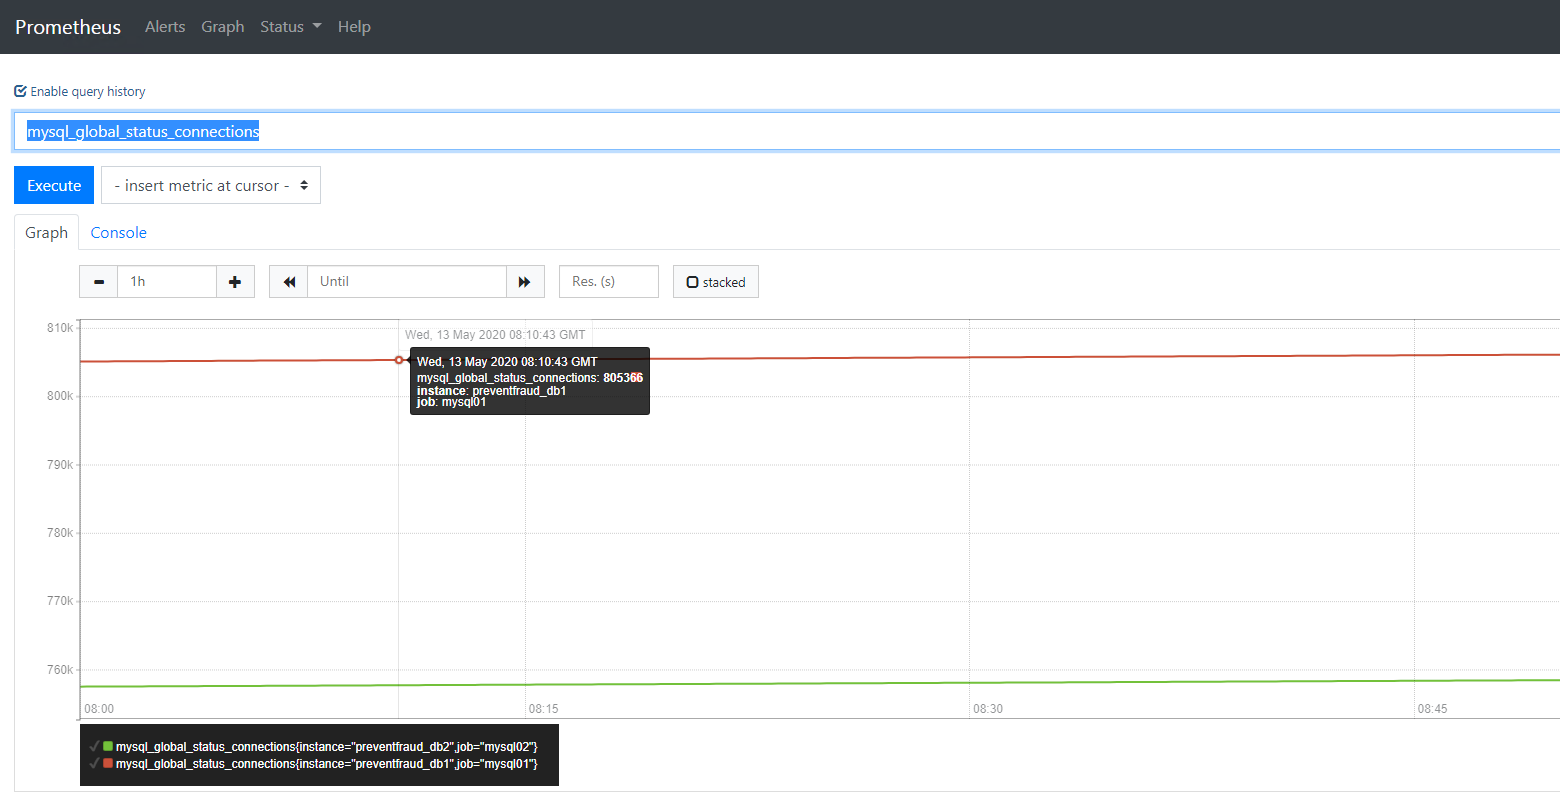
However, the graphics provided by Prometheus are not powerful enough, so we use Grafana as the Dashboard of Prometheus. - Configure Grafana
Through the default 3000 port of grafana, visit the website of grafana and add data source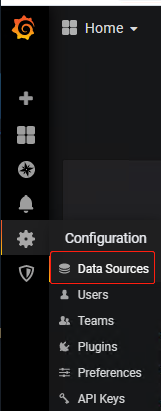
Here, select the Prometheus data source, where the URL fills in the Prometheus address, and other items remain the default. Click Save & test to add it as follows.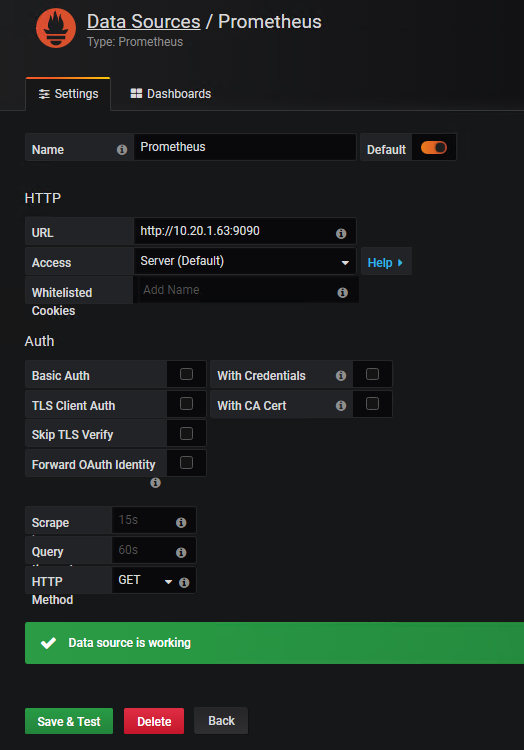
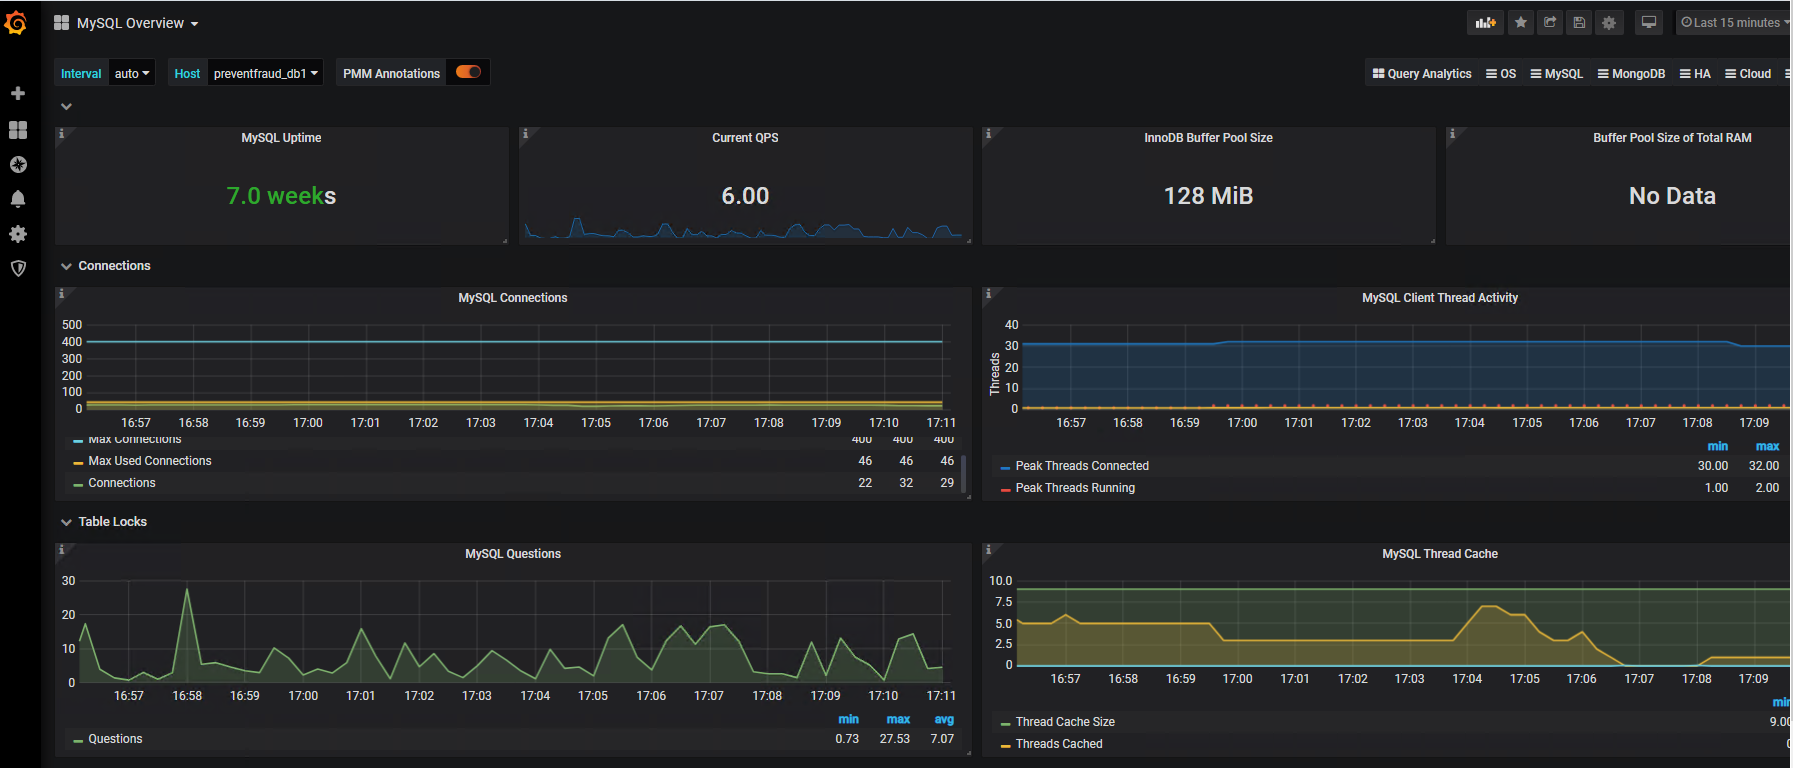
Granfina imports Mysql monitoring chart. recommend https://grafana.com/grafana/dashboards/7362 Monitor the template and export Download JSON.
Granfina enters create - > import to import Dashboards.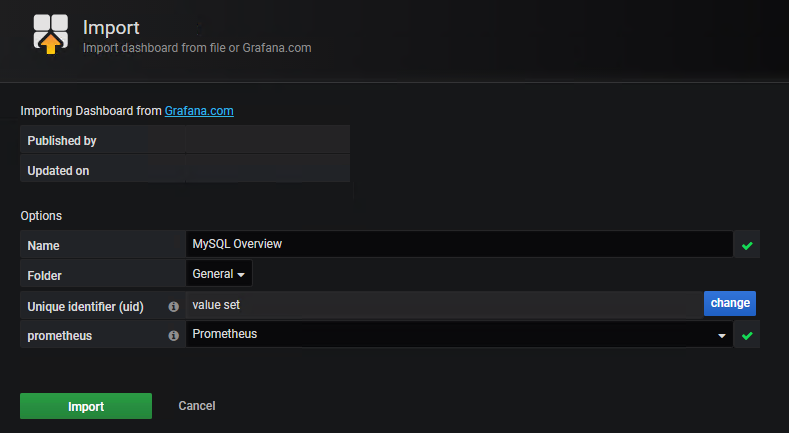
The monitoring items are very detailed, and the final presentation is as follows: