1. Introduction to Prometheus
prometheus (developed by go language (golang)) is a combination of open source monitoring & Alarm & time series database. Suitable for monitoring docker containers. Because the popularity of kubernetes (commonly known as k8s) has driven the development of prometheus.
Prometheus official website
2. Time series data
2.1 what is time series data
Time series data: data that records system and equipment status changes in time order is called time series data.
Application scenario:
- The longitude, latitude, speed, direction, distance of nearby objects, etc. to be recorded during the operation of driverless vehicles. Record and analyze the data all the time.
- Track data of vehicles in a certain area
- Real time transaction data of traditional securities industry
- Real time operation and maintenance monitoring data
2.2 features
- Good performance
The performance of relational database for large-scale data processing is poor. NOSQL can handle large-scale data better, but it is still not as good as time series database. - Low storage cost
Efficient compression algorithm saves storage space and effectively reduces IO
Prometheus has a very efficient time series data storage method. Each sampling data only occupies about 3.5byte space, millions of time series, 30 second interval, retention for 60 days, and it takes about more than 200 G (from official data).
3. Main features of Prometheus
The flexible query language of multi-dimensional data model does not rely on distributed storage. A single server node is independent. It can pull time series data through the pull model through HTTP. It can also support the push model through the intermediate gateway. It can discover the target service object through service discovery or static configuration, and support a variety of charts and interface displays.
4. Schematic diagram of Prometheus
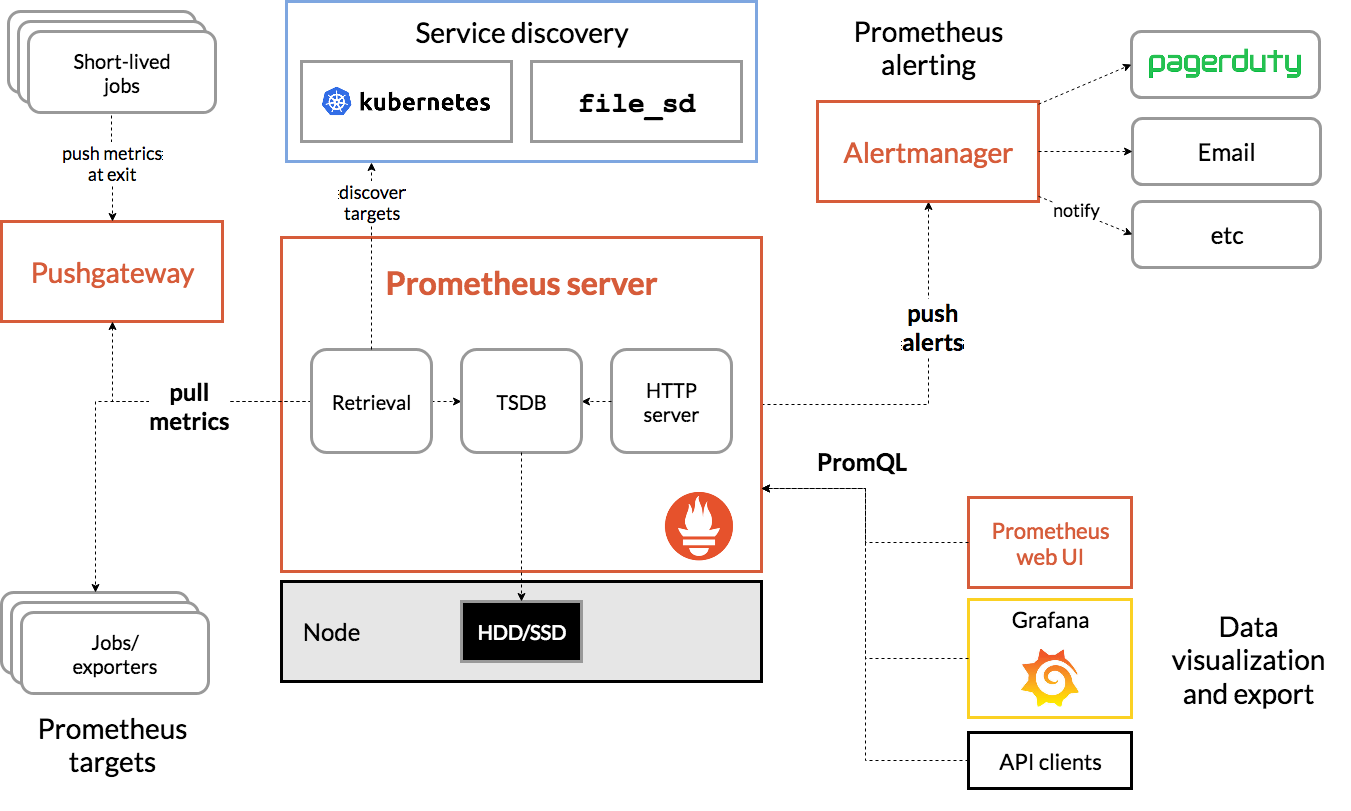
Prometheus grabs indicators from the detected jobs directly or through the intermediary push gateway for short-term jobs. It stores all captured samples locally and runs rules on these data to aggregate and record new time series from existing data or generate alerts. Grafana or other API users can be used to visualize the collected data.
5. Applicable scenarios
5.1 when is it suitable?
Prometheus is suitable for recording any pure digital time series. It is suitable for both machine centered monitoring and highly dynamic service-oriented architecture. In the world of microservices, its support for multidimensional data collection and query is a special advantage.
Prometheus is designed for reliability and becomes the system you access during power outages, allowing you to quickly diagnose problems. Each Prometheus server is independent and does not rely on network storage or other remote services. When other parts of the infrastructure are broken, you can rely on it, and you don't need to set up a lot of infrastructure to use it.
5.2 when is not appropriate?
Prometheus values reliability. Even in the event of a failure, you can view available statistics about the system at any time. If you need 100% accuracy, such as billing on request, Prometheus is not a good choice because the data collected may not be detailed and complete. In this case, you'd better use other systems to collect and analyze billing data, and use Prometheus for other monitoring.
6. Prometheus+Grafana deployment
Environmental requirements
| system | host name | IP | Required services |
|---|---|---|---|
| Centos8 | server | 192.168.249.141 | prometheus-2.28.0 |
| Centos8 | agent | 192.168.249.145 | node_exporter-1.1.2 grafana |
Related software Download address
Deploy Prometheus on the server host
//Download installation package
[root@server ~]# ls
anaconda-ks.cfg  prometheus-2.28.0.linux-amd64.tar.gz
//decompression
[root@server ~]# tar xf prometheus-2.28.0.linux-amd64.tar.gz
[root@server ~]# ls
anaconda-ks.cfg  prometheus-2.28.0.linux-amd64  prometheus-2.28.0.linux-amd64.tar.gz
[root@server ~]# mv prometheus-2.28.0.linux-amd64 /usr/local/prometheus
[root@server ~]# ls /usr/local/
bin  etc  games  include  lib  lib64  libexec  prometheus  sbin  share  src

//Check the help document of the main program and how to start the main program
[root@server ~]# cd /usr/local/prometheus/
[root@server prometheus]# ls
console_libraries  consoles  LICENSE  NOTICE  prometheus  prometheus.yml  promtool
[root@server prometheus]# ./prometheus --help
usage: prometheus [<flags>]

The Prometheus monitoring server

Flags:
  -h, --help                     Show context-sensitive help (also try --help-long and --help-man).
      --version                  Show application version.
      --config.file="prometheus.yml"    #This is the startup method
                                 Prometheus configuration file path.
      --web.listen-address="0.0.0.0:9090"
                                 Address to listen on for UI, API, and telemetry.
      --web.config.file=""       [EXPERIMENTAL] Path to configuration file that can enable TLS or
                                 authentication.
      --web.read-timeout=5m      Maximum duration before timing out read of the request, and closing idle
                                 connections.
      --web.max-connections=512  Maximum number of simultaneous connections.
      --web.external-url=<URL>   The URL under which Prometheus is externally reachable (for example, if
                                 Prometheus is served via a reverse proxy). Used for generating relative and
                                 absolute links back to Prometheus itself. If the URL has a path portion, it
                                 will be used to prefix all HTTP endpoints served by Prometheus. If omitted,
                                 relevant URL components will be derived automatically.
      --web.route-prefix=<path>  Prefix for the internal routes of web endpoints. Defaults to path of
                                 --web.external-url.
      --web.user-assets=<path>   Path to static asset directory, available at /user.
      --web.enable-lifecycle     Enable shutdown and reload via HTTP request.
      --web.enable-admin-api     Enable API endpoints for admin control actions.
      --web.console.templates="consoles"
                                 Path to the console template directory, available at /consoles.
      --web.console.libraries="console_libraries"
                                 Path to the console library directory.
      --web.page-title="Prometheus Time Series Collection and Processing Server"
                                 Document title of Prometheus instance.
      --web.cors.origin=".*"     Regex for CORS origin. It is fully anchored. Example:
                                 'https?://(domain1|domain2)\.com'
      --storage.tsdb.path="data/"
                                 Base path for metrics storage.
      --storage.tsdb.retention=STORAGE.TSDB.RETENTION
                                 [DEPRECATED] How long to retain samples in storage. This flag has been
                                 deprecated, use "storage.tsdb.retention.time" instead.
      --storage.tsdb.retention.time=STORAGE.TSDB.RETENTION.TIME
                                 How long to retain samples in storage. When this flag is set it overrides
                                 "storage.tsdb.retention". If neither this flag nor "storage.tsdb.retention" nor
                                 "storage.tsdb.retention.size" is set, the retention time defaults to 15d. Units
                                 Supported: y, w, d, h, m, s, ms.
      --storage.tsdb.retention.size=STORAGE.TSDB.RETENTION.SIZE
                                 [EXPERIMENTAL] Maximum number of bytes that can be stored for blocks. A unit is
                                 required, supported units: B, KB, MB, GB, TB, PB, EB. Ex: "512MB". This flag is
                                 experimental and can be changed in future releases.
      --storage.tsdb.no-lockfile
                                 Do not create lockfile in data directory.
      --storage.tsdb.allow-overlapping-blocks
                                 [EXPERIMENTAL] Allow overlapping blocks, which in turn enables vertical
                                 compaction and vertical query merge.
      --storage.tsdb.wal-compression
                                 Compress the tsdb WAL.
      --storage.remote.flush-deadline=<duration>
                                 How long to wait flushing sample on shutdown or config reload.
      --storage.remote.read-sample-limit=5e7
                                 Maximum overall number of samples to return via the remote read interface, in a
                                 single query. 0 means no limit. This limit is ignored for streamed response
                                 types.
      --storage.remote.read-concurrent-limit=10
                                 Maximum number of concurrent remote read calls. 0 means no limit.
      --storage.remote.read-max-bytes-in-frame=1048576
                                 Maximum number of bytes in a single frame for streaming remote read response
                                 types before marshalling. Note that client might have limit on frame size as
                                 well. 1MB as recommended by protobuf by default.
      --storage.exemplars.exemplars-limit=100000
                                 [EXPERIMENTAL] Maximum number of exemplars to store in in-memory exemplar
                                 storage total. 0 disables the exemplar storage. This flag is effective only
                                 with --enable-feature=exemplar-storage.
      --rules.alert.for-outage-tolerance=1h
                                 Max time to tolerate prometheus outage for restoring "for" state of alert.
      --rules.alert.for-grace-period=10m
                                 Minimum duration between alert and restored "for" state. This is maintained
                                 only for alerts with configured "for" time greater than grace period.
      --rules.alert.resend-delay=1m
                                 Minimum amount of time to wait before resending an alert to Alertmanager.
      --alertmanager.notification-queue-capacity=10000
                                 The capacity of the queue for pending Alertmanager notifications.
      --query.lookback-delta=5m  The maximum lookback duration for retrieving metrics during expression
                                 evaluations and federation.
      --query.timeout=2m         Maximum time a query may take before being aborted.
      --query.max-concurrency=20
                                 Maximum number of queries executed concurrently.
      --query.max-samples=50000000
                                 Maximum number of samples a single query can load into memory. Note that
                                 queries will fail if they try to load more samples than this into memory, so
                                 this also limits the number of samples a query can return.
      --enable-feature= ...      Comma separated feature names to enable. Valid options: promql-at-modifier,
                                 promql-negative-offset, remote-write-receiver, exemplar-storage,
                                 expand-external-labels. See
                                 https://prometheus.io/docs/prometheus/latest/disabled_features/ for more
                                 details.
      --log.level=info           Only log messages with the given severity or above. One of: [debug, info, warn,
                                 error]
      --log.format=logfmt        Output format of log messages. One of: [logfmt, json]
//Direct start
[root@server prometheus]# ./prometheus --config.file="prometheus.yml"
[root@server prometheus]# ss -antl
State        Recv-Q       Send-Q             Local Address:Port             Peer Address:Port      Process
LISTEN       0            128                      0.0.0.0:22                    0.0.0.0:*
LISTEN       0            128                            *:9090                        *:*
LISTEN       0            128                         [::]:22                       [::]:*
Turn off firewall and selinux
[root@server ~]# systemctl stop firewalld
[root@server ~]# systemctl disable firewalld
Removed /etc/systemd/system/multi-user.target.wants/firewalld.service.
Removed /etc/systemd/system/dbus-org.fedoraproject.FirewallD1.service.
[root@server ~]# setenforce 0
[root@server ~]# vim /etc/selinux/config
selinux=disabled
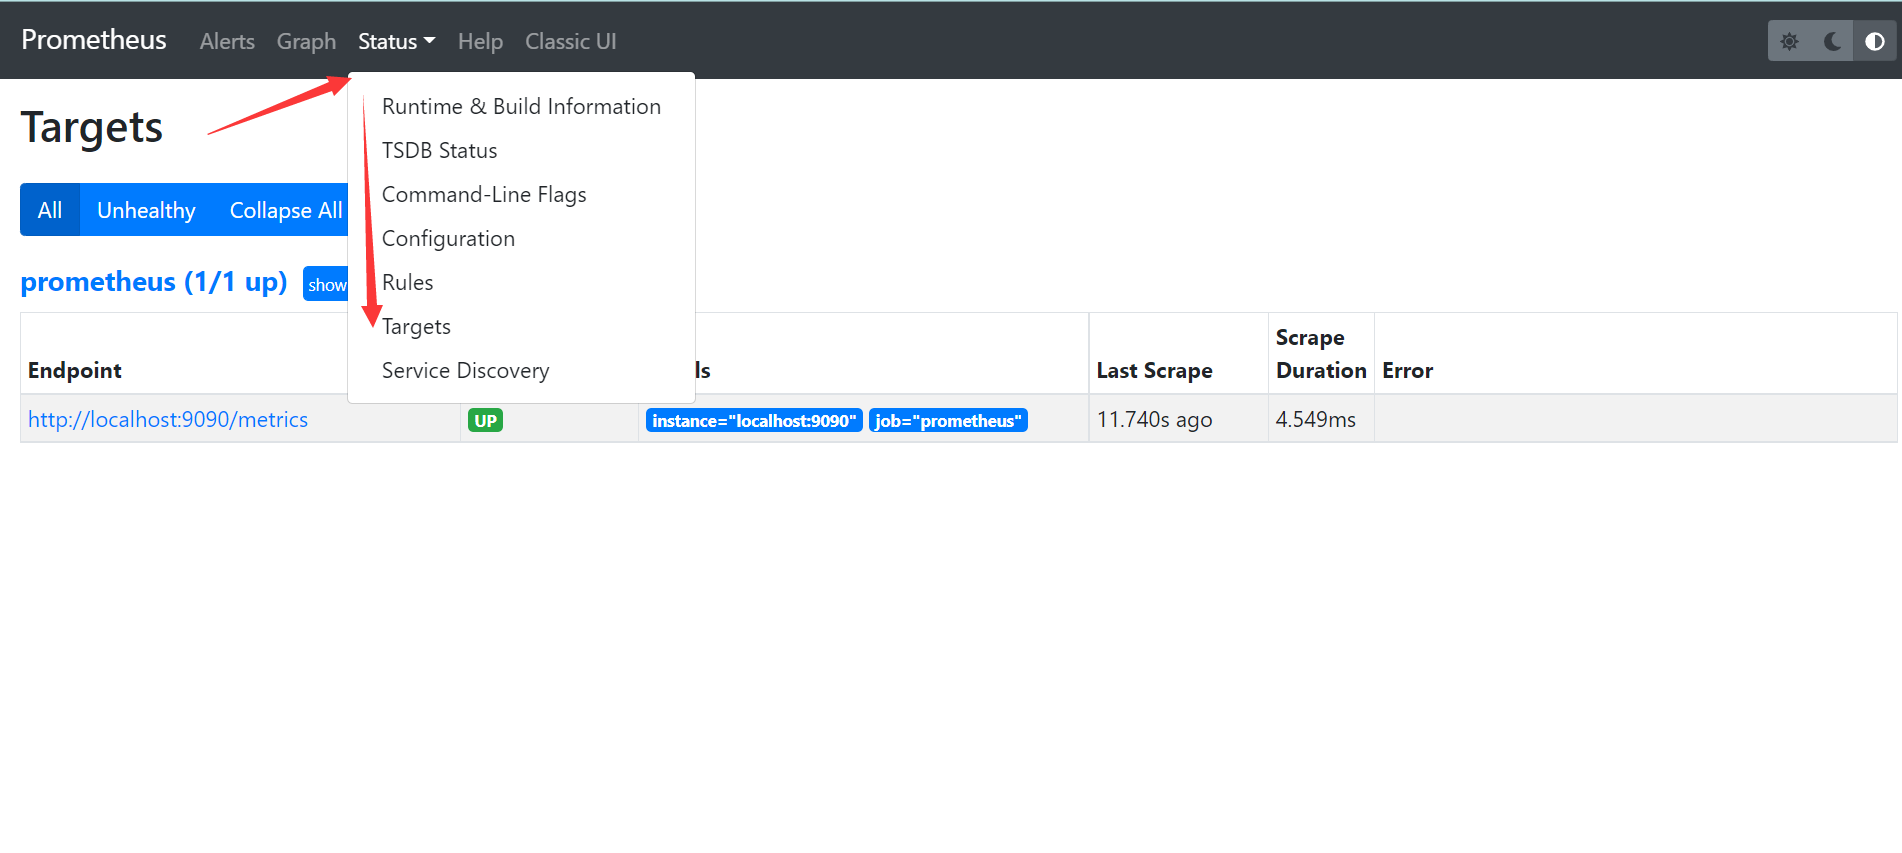
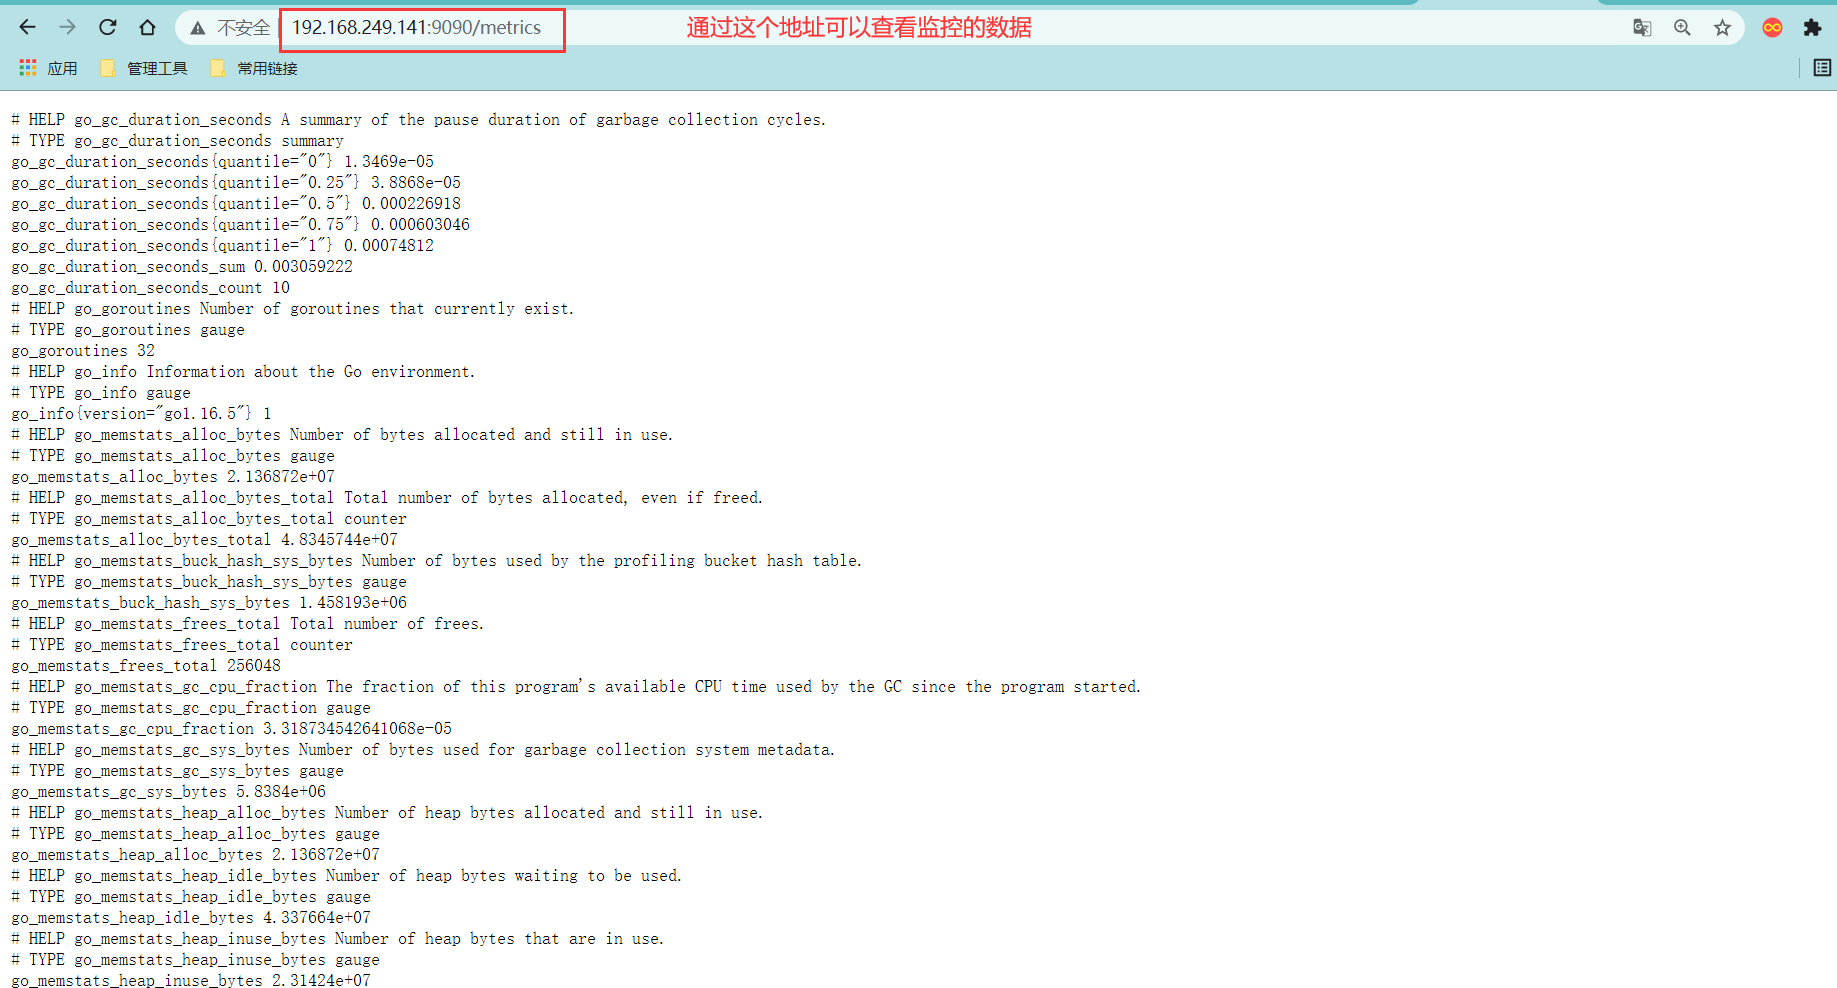
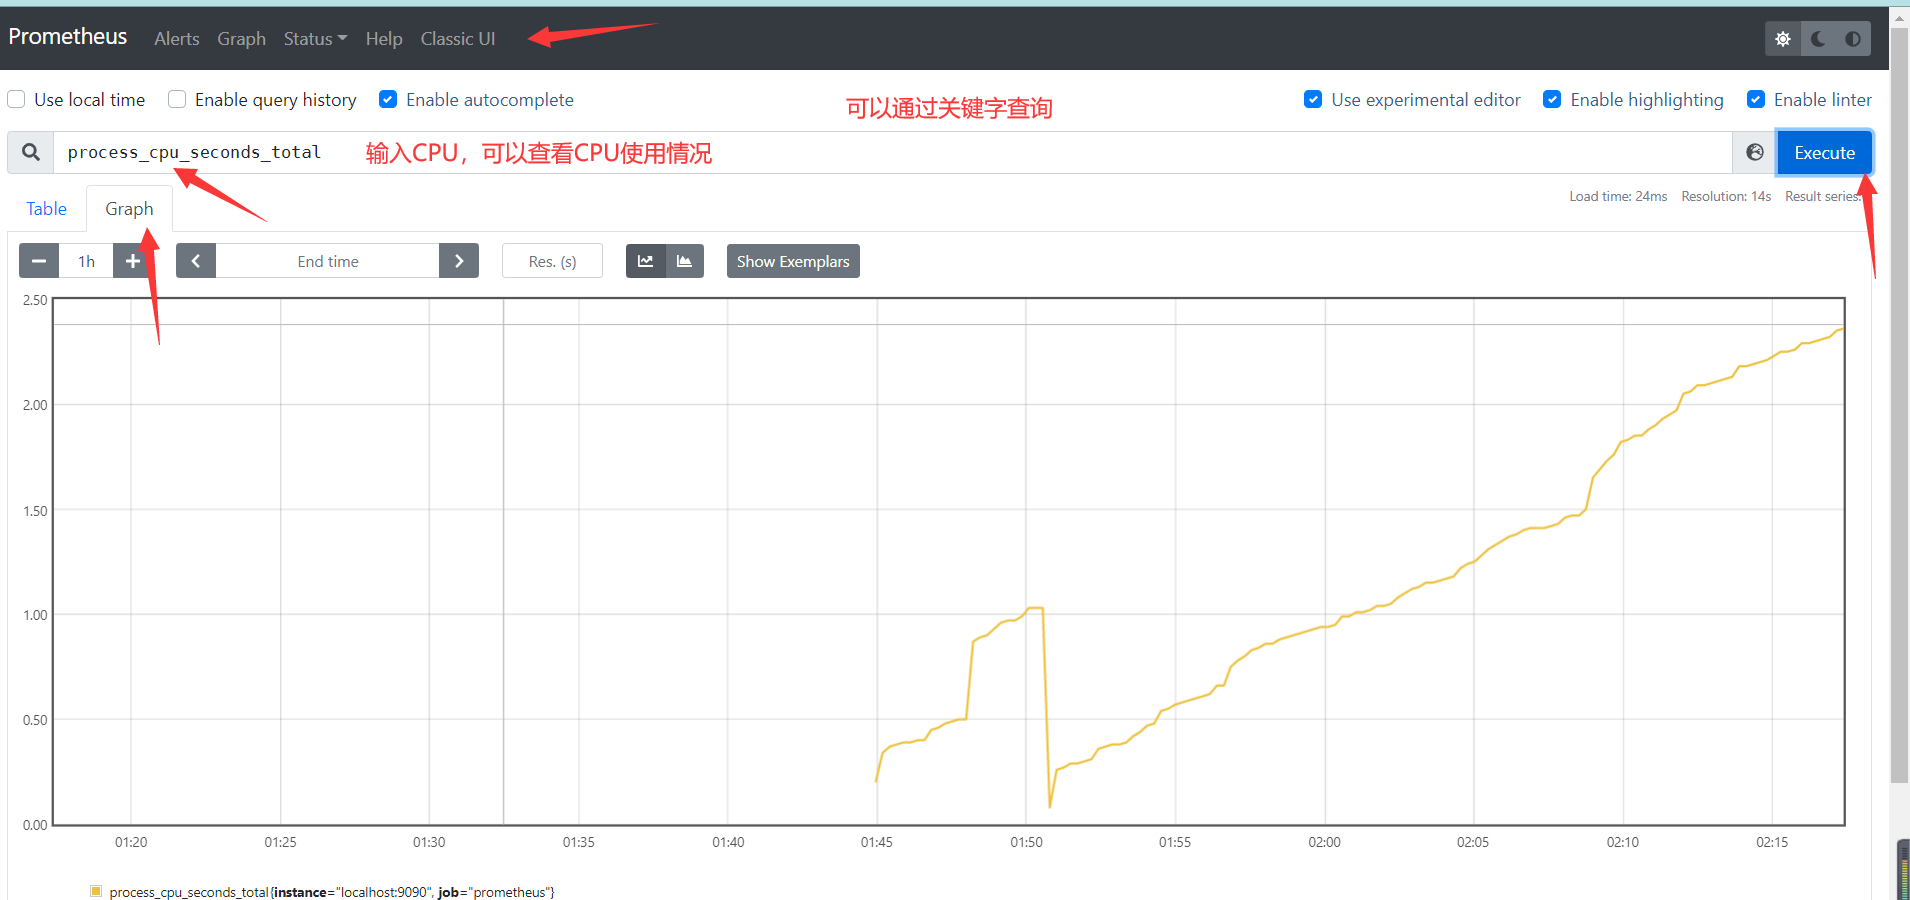
6.1 login in web interface
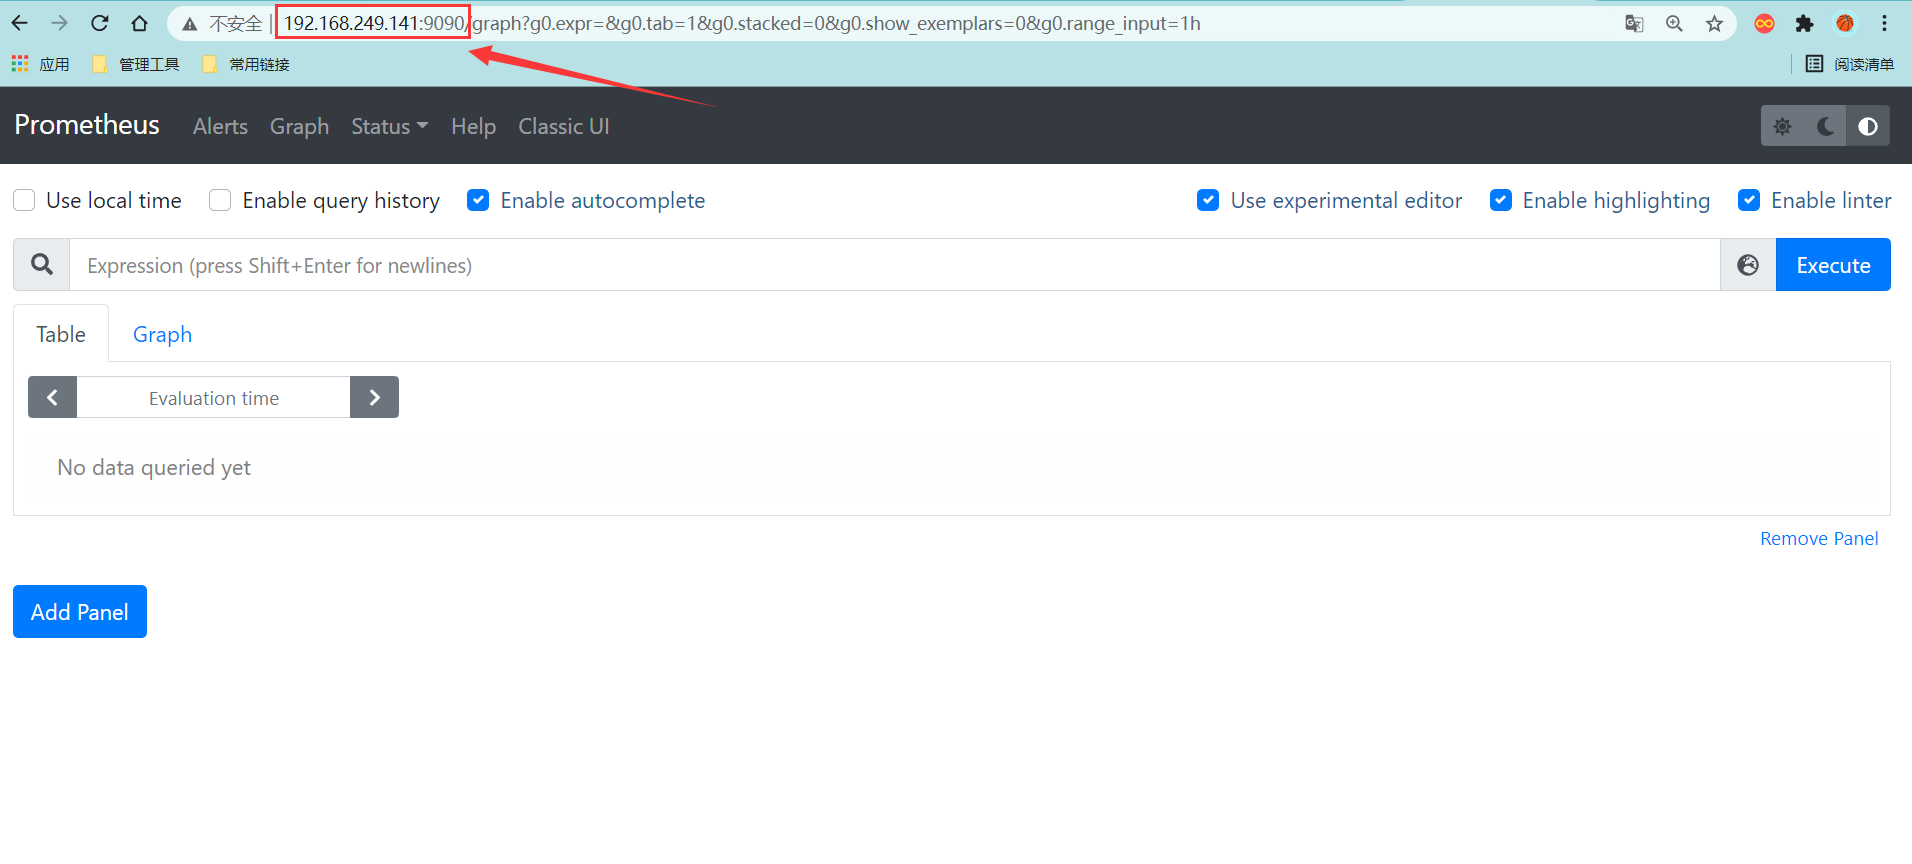
View the monitoring list. At present, only this host is in the monitoring list
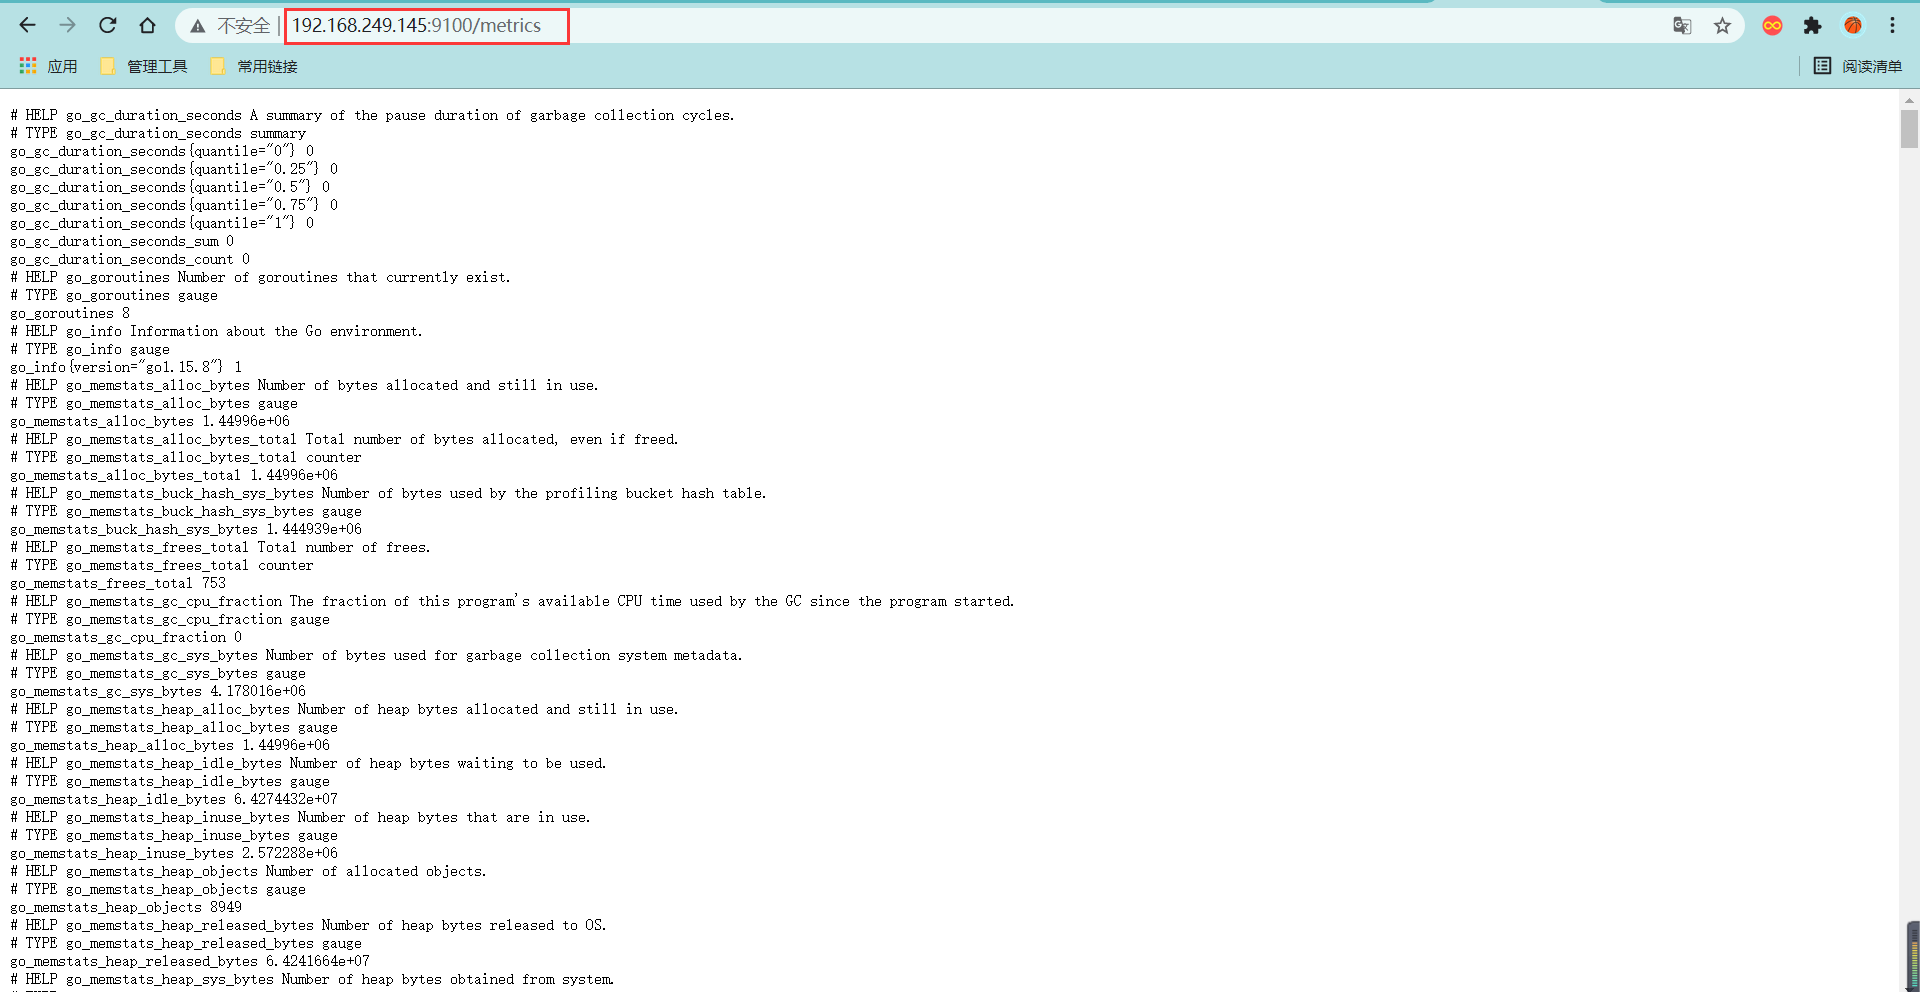
6.2 monitor other hosts
Install node on the host to be monitored_ exporter-1.1.2. linux-amd64. tar. GZ component, which can be downloaded from the official website
//decompression
[root@agent ~]# ls
anaconda-ks.cfg  node_exporter-1.1.2.linux-amd64.tar.gz
[root@agent ~]# tar xf node_exporter-1.1.2.linux-amd64.tar.gz
[root@agent ~]# ls
anaconda-ks.cfg  node_exporter-1.1.2.linux-amd64  node_exporter-1.1.2.linux-amd64.tar.gz
[root@agent ~]# mv node_exporter-1.1.2.linux-amd64 /usr/local/node_exporter

//start-up
[root@agent node_exporter]# nohup /usr/local/node_exporter/node_exporter &
[1] 10337
[root@agent node_exporter]# Nohup: ignore input and append output to 'nohup out'

[root@agent node_exporter]# ss -antl
State         Recv-Q        Send-Q               Local Address:Port               Peer Address:Port       Process
LISTEN        0             128                        0.0.0.0:22                      0.0.0.0:*
LISTEN        0             128                              *:9100                          *:*
LISTEN        0             128                           [::]:22                         [::]:*
View monitoring information