25.prometheus monitoring k8s cluster
1, Node exporter
node_ The exporter captures various running indicators of server nodes, such as conntrack, cpu, diskstats, filesystem, loadavg, meminfo, netstat, etc
See more: https://github.com/prometheus/node_exporter
1. Deploy node exporter for daemon set
Pull the image docker pull Prom / node exporter: v1 one point two
vi node-exporter-dm.yaml
apiVersion: apps/v1
kind: DaemonSet
metadata:
  name: node-exporter
  namespace: kube-mon
  labels:
    name: node-exporter
spec:
  selector:
    matchLabels:
      name: node-exporter
  template:
    metadata:
      labels:
        name: node-exporter
    spec:
      hostPID: true    # Use host PID namespace
      hostIPC: true    # Use host IPC namespace
      hostNetwork: true    # Using host net namespace
      containers:
      - name: node-exporter
        image: harbor.hzwod.com/k8s/prom/node-exporter:v1.1.2
        ports:
        - containerPort: 9100
        resources:
          requests:
            cpu: 150m
#        securityContext:
#          privileged: true
        args:
        - --path.rootfs
        - /host
        volumeMounts:
        - name: rootfs
          mountPath: /host
      tolerations:
      - key: "node-role.kubernetes.io/master"
        operator: "Exists"
        effect: "NoSchedule"
      volumes:
        - name: rootfs
          hostPath:
            path: /
- hostPID: true, hostIPC: true, hostNetwork: true enables the node export container and the host to share PID, IPC, NET namespaces to use the commands and other resources of the host
- Note that since the net namespace is shared with the host, containerPort: 9100 will be directly exposed to the 9001 port of the host, which will be used as the service entry of metrics
- Mount the / directory of the host to the container / Host Directory, and specify the parameter -- path Rootfs = / host, so that the container can find and obtain the host information through these files of the host. For example, / proc/stat can obtain cpu information, / proc/meminfo can obtain memory information
- Tolerances is added to the pod to allow the pod to run on the master node, because we hope that the master node can also be monitored. If there are other dirty nodes, we will deal with them in the same way
kubectl apply -f node-exporter-dm.yaml anomaly

Check Kube apiserver - h for this description

Add the startup parameter -- allow privileged = true to Kube apiserver to allow the container to request privileged mode
Or remove the securitycontext above Privileged: true this configuration (the impact of TODO is not known yet)
Check metrics
curl http://172.10.10.100:9100/metrics
We can see multi indicator information
At this time, each node has a metrics interface. We can configure monitoring for each node on prometheus. However, if we add a node, do we need to modify the prometheus configuration once? Is there a simple way to automatically discover nodes? Next, take a look at prometheus's service discovery
2. Service discovery
Under Kubernetes, Promethues integrates with Kubernetes API. At present, Promethues mainly supports five Service discovery modes: Node, Service, Pod, Endpoints and progress.
a. node discovery
Add prometheus config
- job_name: 'kubernetes-nodes'
  kubernetes_sd_configs:
  - role: node
- kubernetes_sd_configs is the Kubernetes API service discovery configuration provided by prometheus
- Roles can be node, service, pod, endpoints and ingress. Different role s support different meta labels
For more information, see the official documentation: kubernetes_sd_config
Except kubernetes_sd_config prometheus has many other options prometheus configuration
After reload prometheus, check the targets and find that the automatic discovery takes effect, but the interfaces are 400
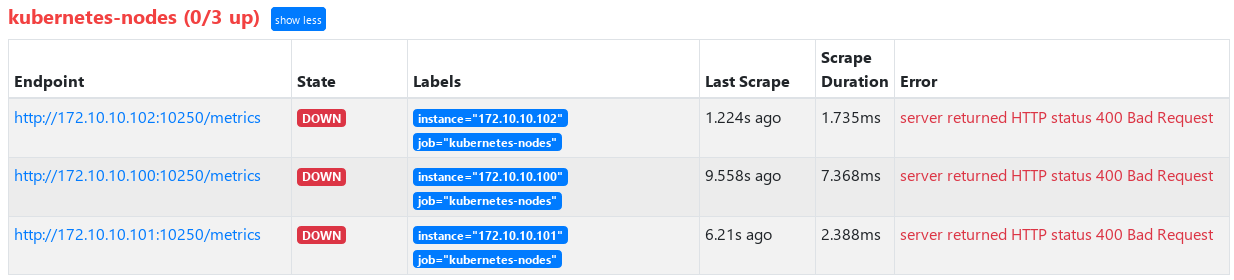
b. Use relabel_config adjust Endpoint of service discovery
We found that after automatically discovering node, the port prometheus automatically looks for is 10250, and it doesn't work. Why
Port 10250 is actually a read-only data unified interface provided by the old version of kubelet. The current version of kubelet (version of this article: v1.17.16) has been modified to 10255
We hope to automatically find that the listening port of node here is 9100 provided by node export (even if you want to use kubelet's own metrics, you need to modify it to 10255, which will be used when configuring cdadvisor below)
After kubelet is started, it will automatically open port 10255. You can view the monitoring information through curl http://[nodeIP]:10255/metrics
We can also pass relabel_configs To modify the port or other information of the Endpoint here
Modify Prometheus Kubernetes nodes job configuration of yaml
- job_name: 'kubernetes-nodes'
  kubernetes_sd_configs:
  - role: node
  relabel_configs:
  - action: replace    # Replace action
    source_labels: [__address__]    # Array, specifying that multiple label s are concatenated and matched by regex
    target_label: __address__    # Replace target label
    regex: '(.*):10250'    # Regular matching source_labels specifies the concatenation value of labels
    replacement: '${1}:9100'    # Replace the value of the target label
- action: replace
- __address__
- replacement: ':9100' is the first matching group that references a regex regular expression
More information view relabel_configs
Official website about__ address__ A description of
The __address__ label is set to the <host>:<port> address of the target. After relabeling, the instance label is set to the value of __address__ by default if it was not set during relabeling. The __scheme__ and __metrics_path__ labels are set to the scheme and metrics path of the target respectively. The __param_<name> label is set to the value of the first passed URL parameter called <name>
Then add the label map and the label of kubernetes node as the Labels of prometheus to facilitate the screening of subsequent monitoring data
  - action: labelmap
    regex: __meta_kubernetes_node_label_(.*)
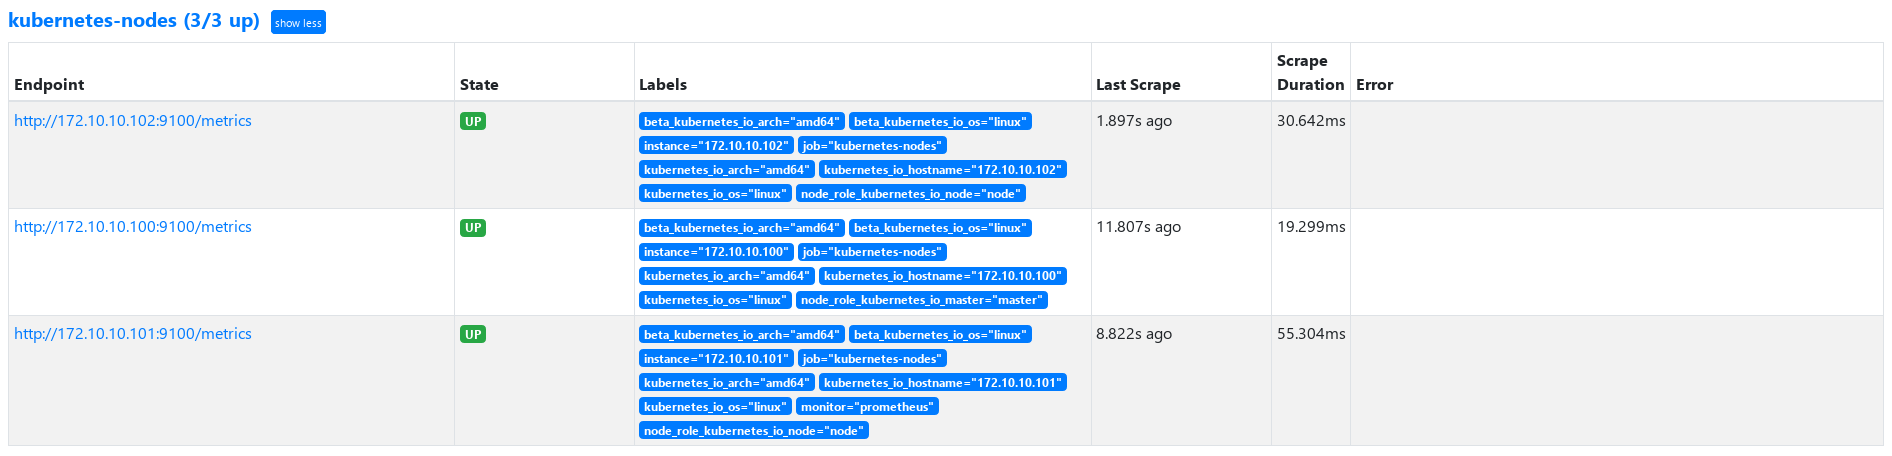
Update prometheus After yaml and reload, view prometheus
c. Complete Prometheus yaml
Let's take a look at the complete prometheus configmap (prometheus.yam is stored in etcd using configmap)
prometheus-cm.yaml
apiVersion: v1
kind: ConfigMap
metadata:
  name: prometheus-config
  namespace: kube-mon
data:
  prometheus.yml: |
    global:
      scrape_interval: 15s
      scrape_timeout: 15s
    scrape_configs:
    - job_name: 'prometheus'
      static_configs:
      - targets: ['localhost:9090']
    - job_name: 'coredns'
      static_configs:
      - targets: ['kube-dns.kube-system:9153']
    - job_name: 'traefik'
      static_configs:
        - targets: ['traefiktcp.default:8180']
    - job_name: 'kubernetes-nodes'
      kubernetes_sd_configs:
      - role: node
      relabel_configs:
      - action: replace    # Replace action
        source_labels: [__address__]    # Array, specifying that multiple label s are concatenated and matched by regex
        target_label: __address__    # Replace target label
        regex: '(.*):10250'    # Regular matching source_labels specifies the concatenation value of labels
        replacement: '${1}:9100'    # Replace the value of the target label
      - action: labelmap
        regex: __meta_kubernetes_node_label_(.*)
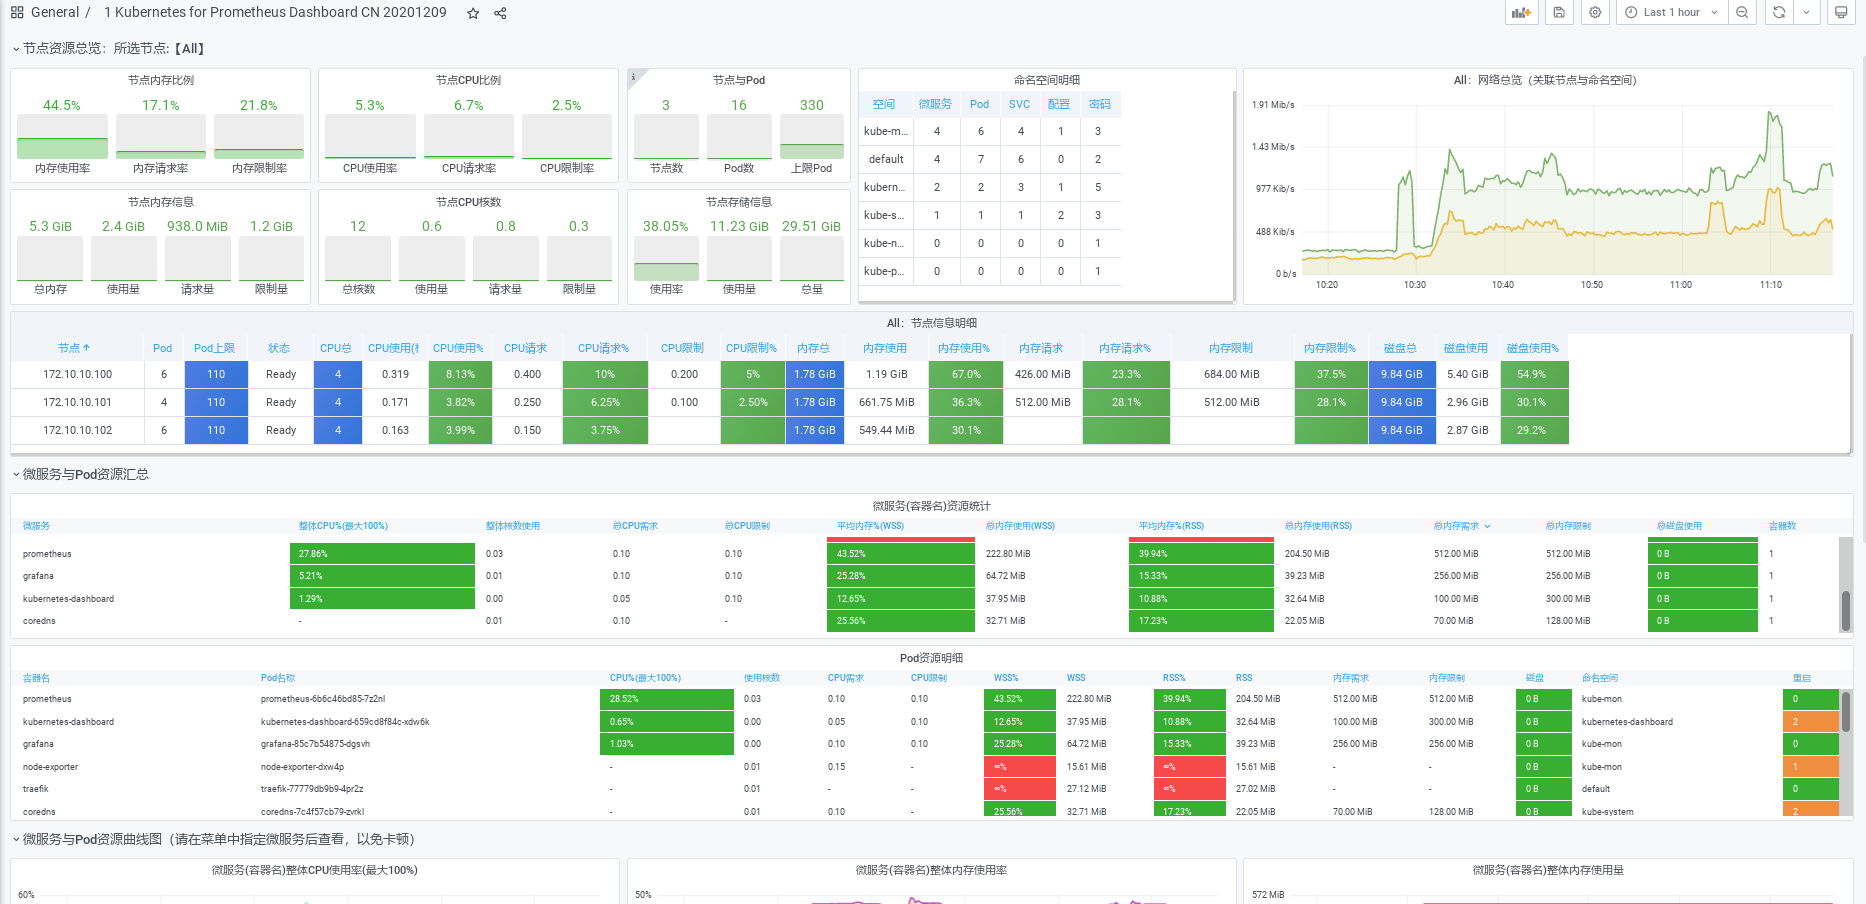
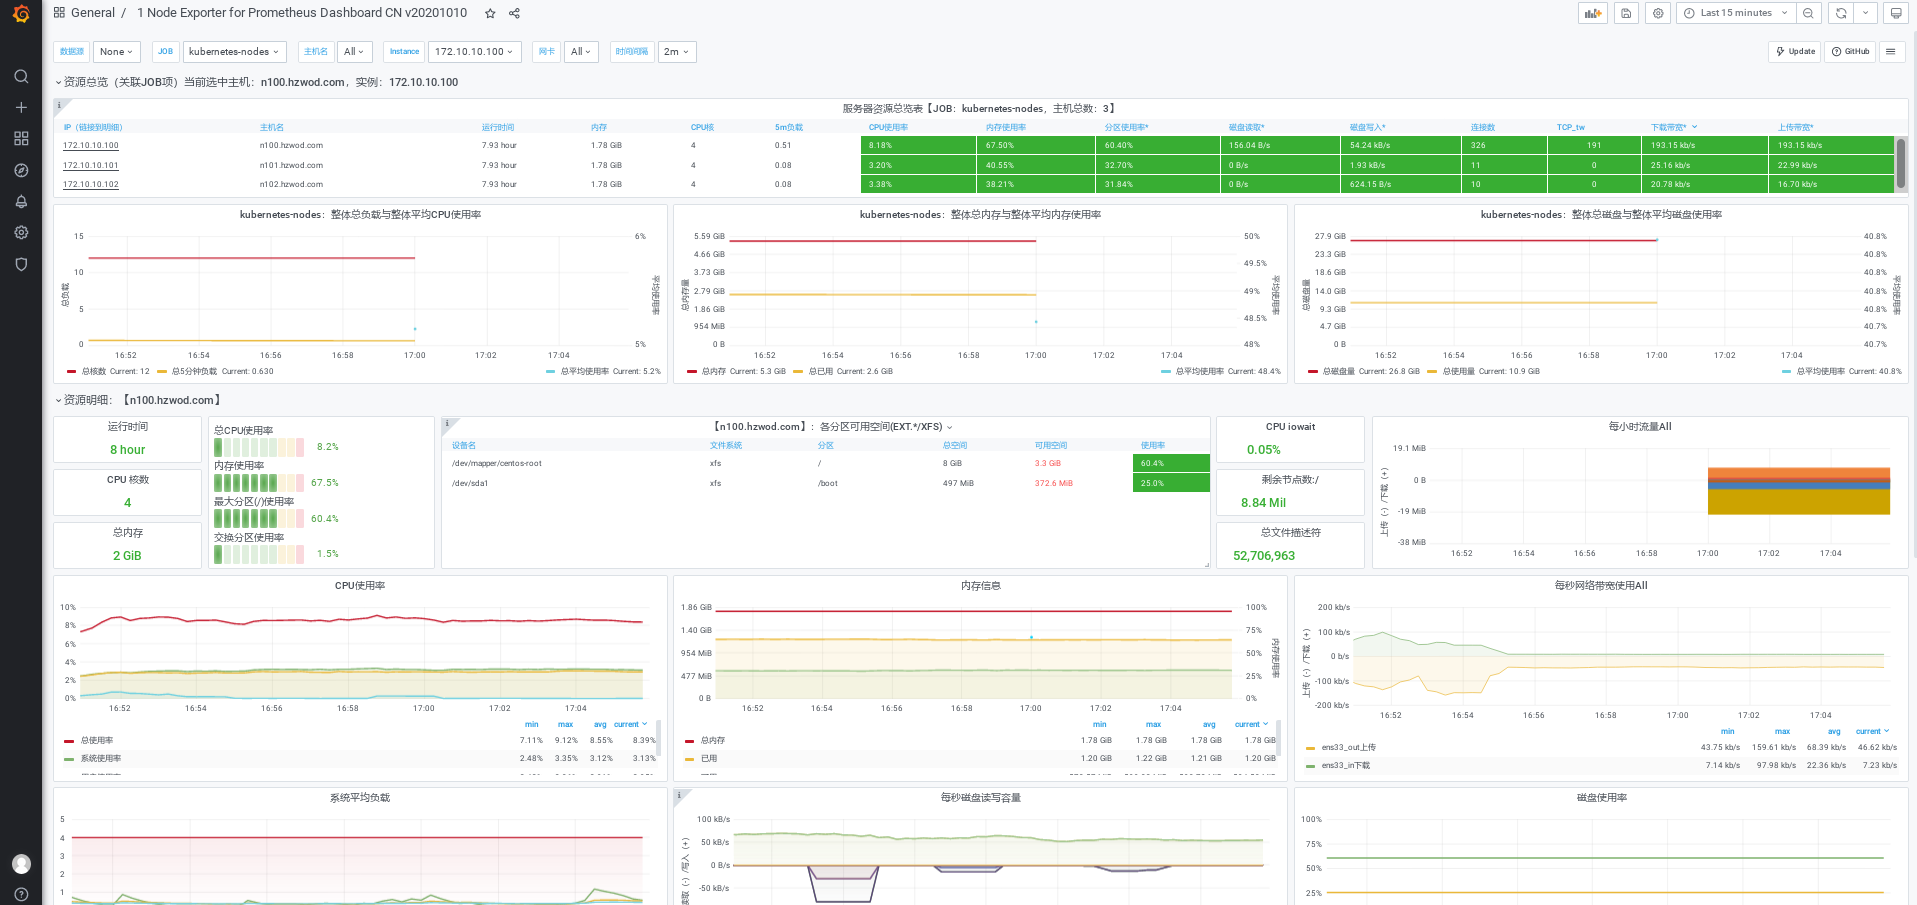
3. Configure grafana to display node monitoring information
Previously, we have installed grafana and configured the prometheus data source. Now we configure the grafana template to monitor and display nodeexport information
Download template: https://grafana.com/api/dashboards/8919/revisions/24/download
2, Kube state metrics + cdadvisor
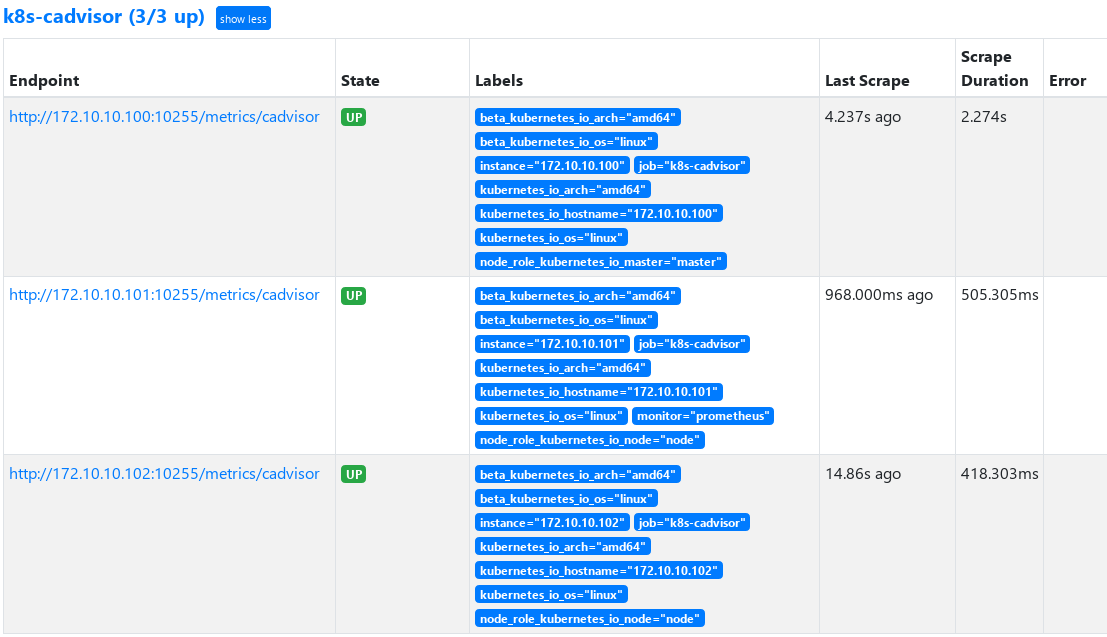
1. Configure prometheus monitoring coadvisor
As a built-in part of kubelet, cdadvisor can be used directly
    - job_name: 'k8s-cadvisor'
      metrics_path: /metrics/cadvisor
      kubernetes_sd_configs:
      - role: node
      relabel_configs:
      - source_labels: [__address__]
        regex: '(.*):10250'
        replacement: '${1}:10255'
        target_label: __address__
        action: replace
      - action: labelmap
        regex: __meta_kubernetes_node_label_(.+)
      metric_relabel_configs:
      - source_labels: [instance]
        separator: ;
        regex: (.+)
        target_label: node
        replacement: $1
        action: replace
      - source_labels: [pod_name]
        separator: ;
        regex: (.+)
        target_label: pod
        replacement: $1
        action: replace
      - source_labels: [container_name]
        separator: ;
        regex: (.+)
        target_label: container
        replacement: $1
        action: replace
2. Deploy Kube state metrics
https://github.com/kubernetes/kube-state-metrics/tree/master/examples/standard
This section deploys the namespace of Kube state metrics: Kube mon
Kube state metrics version is v1.0 nine point eight
- Download Image
docker pull quay.mirrors.ustc.edu.cn/coreos/kube-state-metrics:v1.9.8 - cluster-role-binding.yaml
apiVersion: rbac.authorization.k8s.io/v1
kind: ClusterRoleBinding
metadata:
  labels:
    app.kubernetes.io/name: kube-state-metrics
    app.kubernetes.io/version: 1.9.8
  name: kube-state-metrics
roleRef:
  apiGroup: rbac.authorization.k8s.io
  kind: ClusterRole
  name: kube-state-metrics
subjects:
- kind: ServiceAccount
  name: kube-state-metrics
  namespace: kube-mon
---
apiVersion: v1
kind: ServiceAccount
metadata:
  labels:
    app.kubernetes.io/name: kube-state-metrics
    app.kubernetes.io/version: 1.9.8
  name: kube-state-metrics
  namespace: kube-mon
- cluster-role.yaml
apiVersion: rbac.authorization.k8s.io/v1
kind: ClusterRole
metadata:
  labels:
    app.kubernetes.io/name: kube-state-metrics
    app.kubernetes.io/version: 1.9.8
  name: kube-state-metrics
rules:
- apiGroups:
  - ""
  resources:
  - configmaps
  - secrets
  - nodes
  - pods
  - services
  - resourcequotas
  - replicationcontrollers
  - limitranges
  - persistentvolumeclaims
  - persistentvolumes
  - namespaces
  - endpoints
  verbs:
  - list
  - watch
- apiGroups:
  - apps
  resources:
  - statefulsets
  - daemonsets
  - deployments
  - replicasets
  verbs:
  - list
  - watch
- apiGroups:
  - batch
  resources:
  - cronjobs
  - jobs
  verbs:
  - list
  - watch
- apiGroups:
  - autoscaling
  resources:
  - horizontalpodautoscalers
  verbs:
  - list
  - watch
- apiGroups:
  - authentication.k8s.io
  resources:
  - tokenreviews
  verbs:
  - create
- apiGroups:
  - authorization.k8s.io
  resources:
  - subjectaccessreviews
  verbs:
  - create
- apiGroups:
  - policy
  resources:
  - poddisruptionbudgets
  verbs:
  - list
  - watch
- apiGroups:
  - certificates.k8s.io
  resources:
  - certificatesigningrequests
  verbs:
  - list
  - watch
- apiGroups:
  - storage.k8s.io
  resources:
  - storageclasses
  - volumeattachments
  verbs:
  - list
  - watch
- apiGroups:
  - admissionregistration.k8s.io
  resources:
  - mutatingwebhookconfigurations
  - validatingwebhookconfigurations
  verbs:
  - list
  - watch
- apiGroups:
  - networking.k8s.io
  resources:
  - networkpolicies
  - ingresses
  verbs:
  - list
  - watch
- apiGroups:
  - coordination.k8s.io
  resources:
  - leases
  verbs:
  - list
  - watch
- deployment.yaml
apiVersion: apps/v1
kind: Deployment
metadata:
  labels:
    app.kubernetes.io/name: kube-state-metrics
    app.kubernetes.io/version: 1.9.8
  name: kube-state-metrics
  namespace: kube-mon
spec:
  replicas: 1
  selector:
    matchLabels:
      app.kubernetes.io/name: kube-state-metrics
  template:
    metadata:
      labels:
        app.kubernetes.io/name: kube-state-metrics
        app.kubernetes.io/version: 1.9.8
    spec:
      containers:
      - image: harbor.hzwod.com/k8s/kube-state-metrics:v1.9.8
        livenessProbe:
          httpGet:
            path: /healthz
            port: 8080
          initialDelaySeconds: 5
          timeoutSeconds: 5
        name: kube-state-metrics
        ports:
        - containerPort: 8080
          name: http-metrics
        - containerPort: 8081
          name: telemetry
        readinessProbe:
          httpGet:
            path: /
            port: 8081
          initialDelaySeconds: 5
          timeoutSeconds: 5
        securityContext:
          runAsUser: 65534
      nodeSelector:
        kubernetes.io/os: linux
      serviceAccountName: kube-state-metrics
- service.yaml
apiVersion: v1
kind: Service
metadata:
  annotations:
    prometheus.io/scraped: "true"
  labels:
    app.kubernetes.io/name: kube-state-metrics
    app.kubernetes.io/version: 1.9.8
  name: kube-state-metrics
  namespace: kube-mon
spec:
  clusterIP: None
  ports:
  - name: http-metrics
    port: 8080
    targetPort: http-metrics
  - name: telemetry
    port: 8081
    targetPort: telemetry
  selector:
    app.kubernetes.io/name: kube-state-metrics
kubectl apply -f . Use these resources to start the Kube state metrics container and service
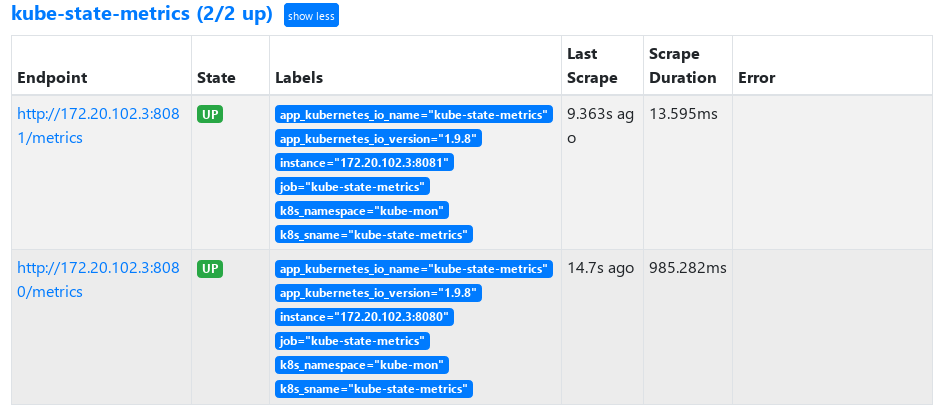
3. Configure prometheus to obtain Kube state metrics monitoring information
prometheus. Add yaml to the following job
    - job_name: kube-state-metrics
      kubernetes_sd_configs:
      - role: endpoints
        namespaces:
          names:
          - kube-mon
      relabel_configs:
      - source_labels: [__meta_kubernetes_service_label_app_kubernetes_io_name]
        regex: kube-state-metrics
        replacement: $1
        action: keep
      - action: labelmap
        regex: __meta_kubernetes_service_label_(.+)
      - source_labels: [__meta_kubernetes_namespace]
        action: replace
        target_label: k8s_namespace
      - source_labels: [__meta_kubernetes_service_name]
        action: replace
        target_label: k8s_sname
- endpoints auto discovery service
- keep only monitors that the label is app kubernetes. IO / Name: Kube state metrics service
Modify the configuration and view it after reload prometheus
4. Configure grafana template to display monitoring information
The template needs the information provided by cadvisor and Kube state metrics. Therefore, prometheus obtained the information of these two metrics above
-
Download template
https://grafana.com/grafana/dashboards/13105 -
effect