This article continues from the previous article. In this article, we will explain how Prometheus uses the service discovery function based on Kubernetes to retrieve target information and monitor it.
In terms of monitoring strategy, we will mix white box monitoring and black box monitoring to establish a comprehensive monitoring coverage including infrastructure (Node), application container (Docker), Kubernetes components and resource objects.
I Monitoring Node
1. Deploy node exporter for daemon
Create node_exporter-daemonset.yml file, as follows. In the spec configuration, tolerances are added for stain tolerance to ensure that the master node will also be deployed.
apiVersion: apps/v1
kind: DaemonSet
metadata:
  name: node-exporter
  namespace: monitoring
  labels:
    app: node-exporter
spec:
  selector:
    matchLabels:
      app: node-exporter
  template:
    metadata:
      labels:
        app: node-exporter
    spec:
      tolerations:   # Stain tolerance
      - key: node-role.kubernetes.io/master
        effect: NoSchedule
      containers:
      - image: prom/node-exporter
        name: node-exporter
        ports:
        - name: scrape
          containerPort: 9100
          hostPort: 9100
      hostNetwork: true
      hostPID: true
      securityContext:
        runAsUser: 0
Execute the yml file
$ kubectl  apply -f node_exporter-daemonset.yml
daemonset.apps/prometheus-node-exporter created
Confirm that the Daemonset and Pod status are normal
$ kubectl get daemonset -n monitoring
NAME            DESIRED   CURRENT   READY   UP-TO-DATE   AVAILABLE   NODE SELECTOR   AGE
node-exporter   3         3         3       3            3           <none>          13m

$ kubectl get pod -n monitoring |grep node-exporter
node-exporter-76qz8          1/1     Running   0          14m
node-exporter-8fqmm          1/1     Running   0          14m
node-exporter-w9jxd          1/1     Running   0          2m6s
2. Prometheus configuration task
In Prometheus config The following tasks are added to the YML file and take effect.
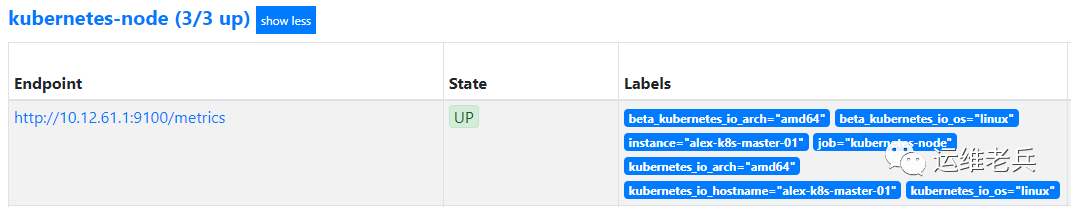
- job_name: 'kubernetes-node' kubernetes_sd_configs: - role: node relabel_configs: - source_labels: [__address__] regex: '(.*):10250' replacement: '${1}:9100' target_label: __address__ action: replace - action: labelmap regex: __meta_kubernetes_node_label_(.+)Note: this task dynamically obtains the node address information through node role discovery, and rewrites the targets target port as node expert port using the label rewriting function, so as to realize the function of automatic monitoring of cluster nodes.
After the task takes effect, you can see that Prometheus has automatically obtained the node information and monitored it.
II Monitoring container
The kubelet of each node of Kubernetes not only contains its own monitoring index information, but also has built-in support for CAdviosr. In the previous container monitoring article, we know that you can monitor the container status on the node by installing CAdviosr. In the Kuberentes cluster, a similar effect can be achieved through kubelet without installing CAdviosr.
Prometheus configuration task
prometheus-config. The following tasks are added to the YML file and take effect.
- job_name: 'kubernetes-cadvisor'
scheme: https
tls_config:
ca_file: /var/run/secrets/kubernetes.io/serviceaccount/ca.crt
bearer_token_file: /var/run/secrets/kubernetes.io/serviceaccount/token
kubernetes_sd_configs:
- role: node
relabel_configs:
- target_label: __address__
replacement: kubernetes.default.svc:443
- source_labels: [__meta_kubernetes_node_name]
regex: (.+)
target_label: __metrics_path__
replacement: /api/v1/nodes/${1}/proxy/metrics/cadvisor
- action: labelmap
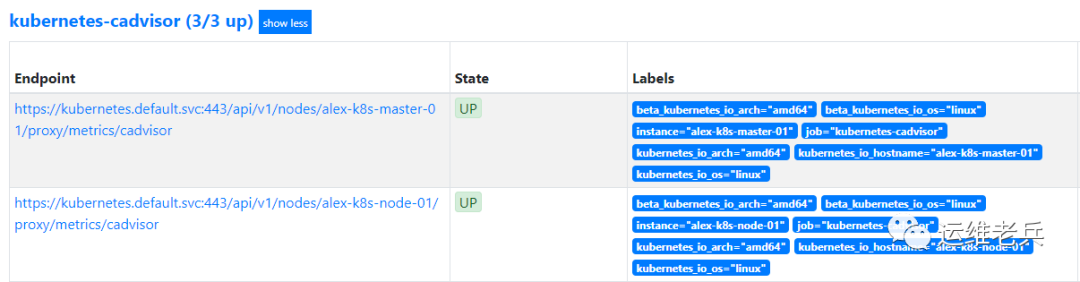
regex: __meta_kubernetes_node_label_(.+)Note: this task dynamically obtains node address information through node role discovery. Because directly accessing kubelet's address will have certificate verification problems, here we use the label rewriting function to rewrite the targets target address and address, and access kubelet's / metrics/cadvisor through the proxy address provided by API Server.
After the task takes effect, you can see that Prometheus has automatically generated relevant target information.
III Monitoring Kube API Server
Kube API Server, as the portal service of the whole Kubernetes cluster management, is responsible for exposing Kubernetes API. The stability of the service affects the availability of the cluster. Through the monitoring of Kube API Server, we can know the API's request processing delay, error, availability and other parameters.
Kube API Server components are generally deployed outside the cluster and run on the host of the Master. In order to enable applications inside the cluster to interact with the API, kubernetes will create a kubernetes Service under the default namespace for internal access in the cluster.
$ kubectl  get service  kubernetes  -o wide
NAME         TYPE        CLUSTER-IP   EXTERNAL-IP   PORT(S)   AGE   SELECTOR
kubernetes   ClusterIP   10.220.0.1   <none>        443/TCP   77d   <none>
The actual back-end address of the kubernetes service agent is maintained through endpoints, which points to port 6443 of the master node, that is, the Kube API Server service port running on the master.
$ kubectl get endpoints kubernetes
NAME         ENDPOINTS         AGE
kubernetes   10.12.61.1:6443   77d

$ netstat -lnpt  |grep 6443
tcp6       0      0 :::6443                 :::*                    LISTEN      30458/kube-apiserve
Therefore, we can realize the target discovery and monitoring of Kube API Server through Prometheus' endpoints role discovery function.
Prometheus configuration task
prometheus-config. The following tasks are added to the YML file and take effect.
- job_name: 'kubernetes-apiservers'
kubernetes_sd_configs:
- role: endpoints
scheme: https
tls_config:
ca_file: /var/run/secrets/kubernetes.io/serviceaccount/ca.crt
bearer_token_file: /var/run/secrets/kubernetes.io/serviceaccount/token
relabel_configs:
- source_labels: [__meta_kubernetes_namespace, __meta_kubernetes_service_name, __meta_kubernetes_endpoint_port_name]
action: keep
regex: default;kubernetes;https
- target_label: __address__
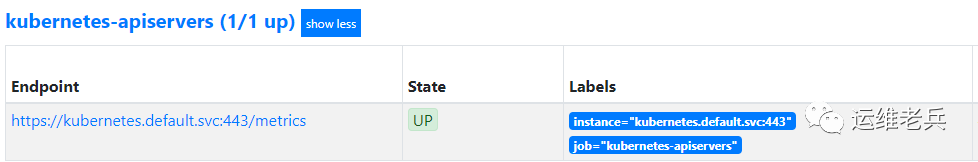
replacement: kubernetes.default.svc:443Note: this task dynamically obtains the endpoint information through the endpoint role discovery, and uses the label rewriting function to retain only the endpoints targets matching the regular expression.
After the task takes effect, view the relevant target information automatically generated by Prometheus.
IV Monitor Kubelet components
The kubelet component runs on each worker node in the cluster and is used to handle the tasks sent by the Master to this node, including managing the Pod and its containers. Kubelet will register node information on Kube API Server and regularly report node resource usage to the cluster.
The running state of kubelet is related to whether the node can work normally. Based on the importance of the component, it is necessary to monitor the kubelet of each node.
Prometheus configuration task
prometheus-config. The following tasks are added to the YML file and take effect.
- job_name: 'k8s-kubelet'
scheme: https
tls_config:
ca_file: /var/run/secrets/kubernetes.io/serviceaccount/ca.crt
bearer_token_file: /var/run/secrets/kubernetes.io/serviceaccount/token
kubernetes_sd_configs:
- role: node
relabel_configs:
- action: labelmap
regex: __meta_kubernetes_node_label_(.+)
- target_label: __address__
replacement: kubernetes.default.svc:443
- source_labels: [__meta_kubernetes_node_name]
regex: (.+)
target_label: __metrics_path__
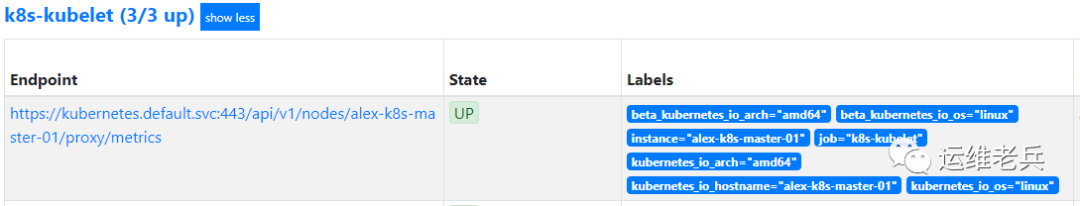
replacement: /api/v1/nodes/${1}/proxy/metricsNote: this task dynamically obtains node address information through node role discovery. Because directly accessing the kubelet address will cause certificate verification problems, here we use the label rewriting function to rewrite the targets target address and address, and access the / metrics path of kubelet through the proxy address provided by the API Server.
After the task takes effect, view the relevant target information automatically generated by Prometheus.
V Monitoring Kubernetes resources
Kubernetes resource objects include Pod, Deployment, StatefulSets, etc. we need to know the usage and status of relevant resources, such as whether Pod is running normally. Since not all resources support Prometheus monitoring, we need to use the open source Kube state metrics scheme to obtain monitoring indicators.
Kube state metrics is a project under the Kubernetes organization. It collects the latest information of relevant resources and objects by listening to the Kube API, and provides the interface address to Prometheus to obtain indicators.
1. Deploy Kube state metrics
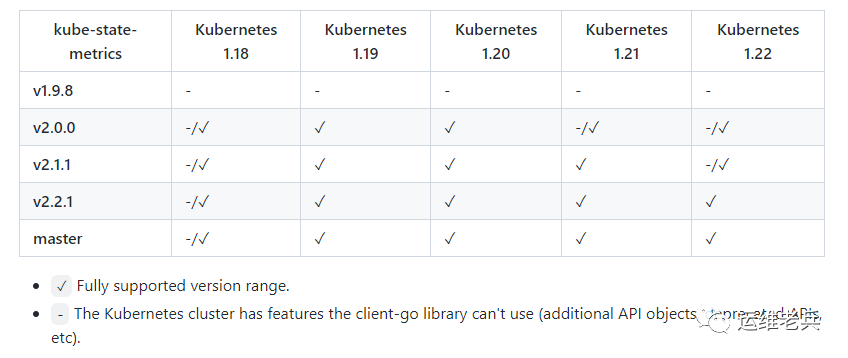
Kube state metrics has version requirements for kubernetes, as shown in the figure below. Kubernetes of our environment is 1.18, so we need to download v2 0.0 and above.
Download project warehouse
$ git clone https://github.com/kubernetes/kube-state-metrics.git
Deployment installation
$ cd kube-state-metrics/
$ kubectl  apply -f examples/standard/
clusterrolebinding.rbac.authorization.k8s.io/kube-state-metrics created
clusterrole.rbac.authorization.k8s.io/kube-state-metrics created
deployment.apps/kube-state-metrics created
serviceaccount/kube-state-metrics created
service/kube-state-metrics created
View service status
$ kubectl  get deploy kube-state-metrics -n kube-system
NAME                 READY   UP-TO-DATE   AVAILABLE   AGE
kube-state-metrics   1/1     1            1           6m20s
2. Prometheus configuration task
prometheus-config. The following tasks are added to the YML file and take effect.
- job_name: kube-state-metrics
      kubernetes_sd_configs:
      - role: endpoints
      relabel_configs:
      - source_labels: [__meta_kubernetes_service_label_app_kubernetes_io_name]
        regex: kube-state-metrics
        replacement: $1
        action: keep
      - source_labels: [__address__]
        regex: '(.*):8080'
        action: keep
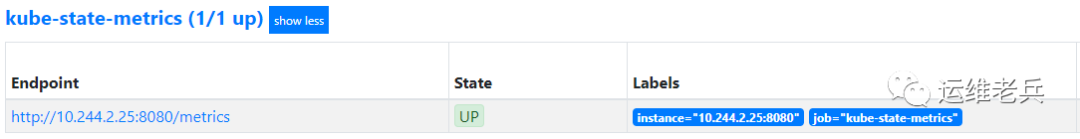
After the task takes effect, view the relevant target information automatically generated by Prometheus.
Vi Monitoring service access
In the Kubernetes cluster, we can adopt the black box monitoring mode, and Prometheus can probe the access of services through probes, so as to understand the service availability in time.
To implement probe detection, we need to install the Blackbox Exporter in the cluster.
1. Deploy Blackbox Exporter
Create a blackbox exporter YML file, as follows:
apiVersion: v1
kind: Service
metadata:
  labels:
    app: blackbox-exporter
  name: blackbox-exporter
  namespace: monitoring
spec:
  ports:
  - name: blackbox
    port: 9115
    protocol: TCP
  selector:
    app: blackbox-exporter
  type: ClusterIP
---
apiVersion: apps/v1
kind: Deployment
metadata:
  labels:
    app: blackbox-exporter
  name: blackbox-exporter
  namespace: monitoring
spec:
  replicas: 1
  selector:
    matchLabels:
      app: blackbox-exporter
  template:
    metadata:
      labels:
        app: blackbox-exporter
    spec:
      containers:
      - name: blackbox-exporter
        image: prom/blackbox-exporter
        imagePullPolicy: IfNotPresent
Execute yml file
$ kubectl  apply -f temp.yml
service/blackbox-exporter created
deployment.apps/blackbox-exporter created
Check the status of the blackbox exporter service and it is running normally.
$ kubectl  get svc blackbox-exporter  -n monitoring
NAME                TYPE        CLUSTER-IP      EXTERNAL-IP   PORT(S)    AGE
blackbox-exporter   ClusterIP   10.220.50.176   <none>        9115/TCP   11m

$ kubectl  get deploy blackbox-exporter  -n monitoring
NAME                READY   UP-TO-DATE   AVAILABLE   AGE
blackbox-exporter   1/1     1            1           12m
2. Prometheus configuration task
After deploying the Blackbox Exporter, Prometheus can access the address inside the cluster: Blackbox Exporter monitoring. svc. cluster. Local to call it.
- job_name: 'kubernetes-services'
      kubernetes_sd_configs:
      - role: service
      metrics_path: /probe
      params:
        module: [http_2xx]
      relabel_configs:
      - source_labels: [__meta_kubernetes_service_annotation_prometheus_io_probe]
        action: keep
        regex: true
      - source_labels: [__address__]
        target_label: __param_target
      - target_label: __address__
        replacement: blackbox-exporter.monitoring.svc.cluster.local:9115
      - source_labels: [__param_target]
        target_label: instance
      - action: labelmap
        regex: __meta_kubernetes_service_label_(.+)
      - source_labels: [__meta_kubernetes_namespace]
        target_label: kubernetes_namespace
      - source_labels: [__meta_kubernetes_service_name]
        target_label: kubernetes_name
Note: this task obtains the service object in the cluster through service role discovery; The "prometheus.io/probe: true" tag is used for filtering, and only the services containing this annotation are included in the monitoring; In addition__ address__ Execute the access address of the Blackbox Exporter instance, and rewrite the content of the label instance.
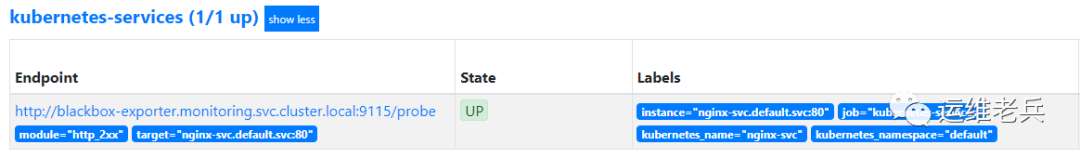
After the task takes effect, view the relevant target information automatically generated by Prometheus.
Focus on Devops operation and maintenance technology sharing, pay attention to official account and get more exciting content.