Prometheus supports a variety of operating systems, such as Linux, Windows and Max OSX. An independent binary file is provided on the product official website for downloading. You can download the corresponding tar package and install and deploy it on the server of the corresponding system. Of course, as a monitoring system closely related to containers, promethsu can also be easily deployed through container platforms such as docker and kubernetes.
The deployment and installation of Prometheus is very simple. This article will demonstrate the deployment method through binary files and Docker. The operating system of the deployment environment is Centos7.8. For the installation methods of other environments, please refer to the installation documents on the official website.
1, Binary installation
1. Download the installation package
$ cd /opt
$ wget  https://github.com/prometheus/prometheus/releases/download/v2.20.0/prometheus-2.20.0.linux-386.tar.gz
2. Unzip the tar package and copy the binary files to the bin directory
$ tar -xvf prometheus-2.20.0.linux-386.tar.gz
$ cd prometheus-2.20.0.linux-386
$ sudo cp prometheus /usr/local/bin/
$ sudo cp promtool /usr/local/bin/
3. Run -- versoin Check version
$ prometheus --version
prometheus, version 2.20.0 (branch: HEAD, revision: e5a06b483527d4fe0704b8fa3a2b475b661c526f)
  build user:       root@ac954b6d5c6e
  build date:       20200722-18:56:15
  go version:       go1.14.6
4. Start
In this case, we use the default configuration file to start prometheus.
Create the / etc/prometheus directory and move the configuration file of the installation package to this path
$ sudo mkdir /etc/prometheus
$ sudo cp prometheus.yml  /etc/prometheus/
Check whether the configuration file is correct through the promtool tool.
$ promtool check config /etc/prometheus/prometheus.yml
Checking /etc/prometheus/prometheus.yml
  SUCCESS: 0 rule files found
Start Prometheus and specify the configuration file.
$ prometheus --config.file /etc/prometheus/prometheus.yml &
Note: Prometheus only retains monitoring data for 15 days by default. You can control the retention time of time series through -- storage.tsdb.retention option-- The storage.tsdb.path option can be used to control the location of the time series database. The default data directory is located in the directory where Prometheus is running.
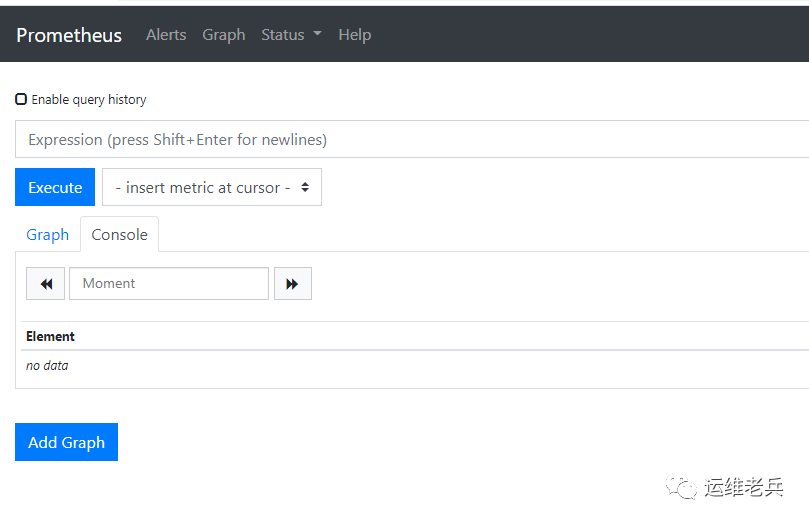
After startup, open the browser and visit http://$IP:9090 You can see the system interface.
2, Docker installation
The installation of docker is very simple. You only need one command
$ docker run --name prometheus -d -p 9090:9090 prom/prometheus
If you want to separate the configuration file from the container, you can save the prometheus.yml file in the local directory and mount it on the container through the - v parameter at startup
$ mkdir /etc/prometheus
$ vi /etc/prometheus/prometheus.yml
global:
  scrape_interval:     15s
  evaluation_interval: 15s
alerting:
  alertmanagers:
  - static_configs:
    - targets:
rule_files:
scrape_configs:
  - job_name: 'prometheus'
    static_configs:
    - targets: ['localhost:9090']
$ docker run --name prometheus -d -p 9090:9090 -v /etc/prometheus/prometheus.yml:/etc/prometheus/prometheus.yml prom/prometheus
3, Configuration introduction
Prometheus is set using prometheus.yml. The configuration file is loaded by specifying the relevant configuration file when starting Prometheus.
In the installation package downloaded above, you can see the existing default promehteus.yml file, which is as follows:
# my global config
global:
  scrape_interval:     15s # Set the scrape interval to every 15 seconds. Default is every 1 minute.
  evaluation_interval: 15s # Evaluate rules every 15 seconds. The default is every 1 minute.
  # scrape_timeout is set to the global default (10s).

# Alertmanager configuration
alerting:
  alertmanagers:
  - static_configs:
    - targets:
      # - alertmanager:9093

# Load rules once and periodically evaluate them according to the global 'evaluation_interval'.
rule_files:
  # - "first_rules.yml"
  # - "second_rules.yml"

# A scrape configuration containing exactly one endpoint to scrape:
# Here it's Prometheus itself.
scrape_configs:
  # The job name is added as a label `job=<job_name>` to any timeseries scraped from this config.
  - job_name: 'prometheus'

    # metrics_path defaults to '/metrics'
    # scheme defaults to 'http'.

    static_configs:
    - targets: ['localhost:9090']
The configuration file is divided into four modules: global, alerting and rule_files,scrape_configs, which have the following purposes:
global
Used to define the global configuration of prometheus.
scrape_interval: used to specify the time interval for Prometheus to grab data from the monitoring end (15s by default). If the time interval indicator is specified for a specific job, the configuration of the job will override the global setting.
evaluation_interval: used to specify the time interval for detecting alarm rules. Prometheus re detects alarm rules every 15s and updates the changes.
alerting
It is used to set the communication between Prometheus and Alertmanager. In the overall architecture of Prometheus, Prometheus will trigger alarms according to the configured alarm rules, and the alarm management is carried out by an independent Alertmanager component.
static_configs represents the use of static configuration. Currently, the default configuration is the annotated alertmanager:9093. You can ignore it here. The subsequent documents on Alertmanager will be described in detail
rule_files
It is used to specify the file path of alarm rules. The file format is yml.
Prometheus' alarm rules are configured through yml files. For those who are used to using zabbix to improve the graphical interface, they may not be used to it at first. However, this is also one of the characteristics of Promthesu. This method provides very open customization functions, which can customize the configuration of various rules according to their own needs.
scrape_configs
Used to specify the target information captured by Prometheus
Prometheus grabs monitoring data by configuring jobs. In the job, a set of information necessary for target fetching is specified, such as target address, port, label, authentication information, etc. The fetching time interval uses the time configured by the global module above, or can be specified separately in the job.
In the actual environment, it is usually divided into multiple job s according to the types of capture targets, such as Mysql, mongodb, kafka, etc.
The default configuration has only one monitoring target, that is, the prometheus server itself. The port is 9090. If no path is specified, it will be fetched from the / metrics path by default.
Focus on content, only quality output. Welcome to pay attention to official account "operation veterans".