What is Prometheus Operator?
To facilitate the management and deployment of Prometheus in Kubernetes, we use ConfigMap to manage Prometheus configuration files. Every time we upgrade the Prometheus configuration file, we need to manually remove the running Pod instance so that Kubernetes can create Prometheus with the latest configuration file. When the number of application instances is more, the process of deploying and upgrading Prometheus manually is cumbersome and inefficient. In essence, Prometheus is a typical stateful application, which includes some unique operation and maintenance management and configuration management methods. None of these can be automated through the application management concept provided by Kubernetes natively. In order to simplify the management complexity of such applications, CoreOS first introduced the concept of Operator, and first introduced Etcd Operator for running and managing Etcd under Kubernetes. And then Prometheus Operator.
How Prometheus Operator works
Conceptually, the Operator is aimed at managing specific applications. Based on the basic concepts of Kubernetes Resource and Controller, it extends Kubernetes api. Help users create, configure and manage complex stateful applications. So as to realize the common operation and operation and maintenance automation of specific applications. In Kubernetes, we use Deployment, DamenSet and stateful set to manage application Workload, Service and progress to manage application access, and ConfigMap and Secret to manage application configuration. The actions of creating, updating and deleting these resources in the cluster will be converted into events. The Controller Manager of Kubernetes is responsible for listening to these events and triggering corresponding tasks to meet the expectations of users. In this way, we become declarative. Users only need to care about the final state of the application, and others are completed through Kubernetes. In this way, the complexity of application configuration management can be greatly simplified. In addition to these native Resource resources, Kubernetes also allows users to add their own custom resources. And the extension of Kubernetes is realized by implementing a custom Controller.
The architecture diagram of Prometheus Operator is as follows:
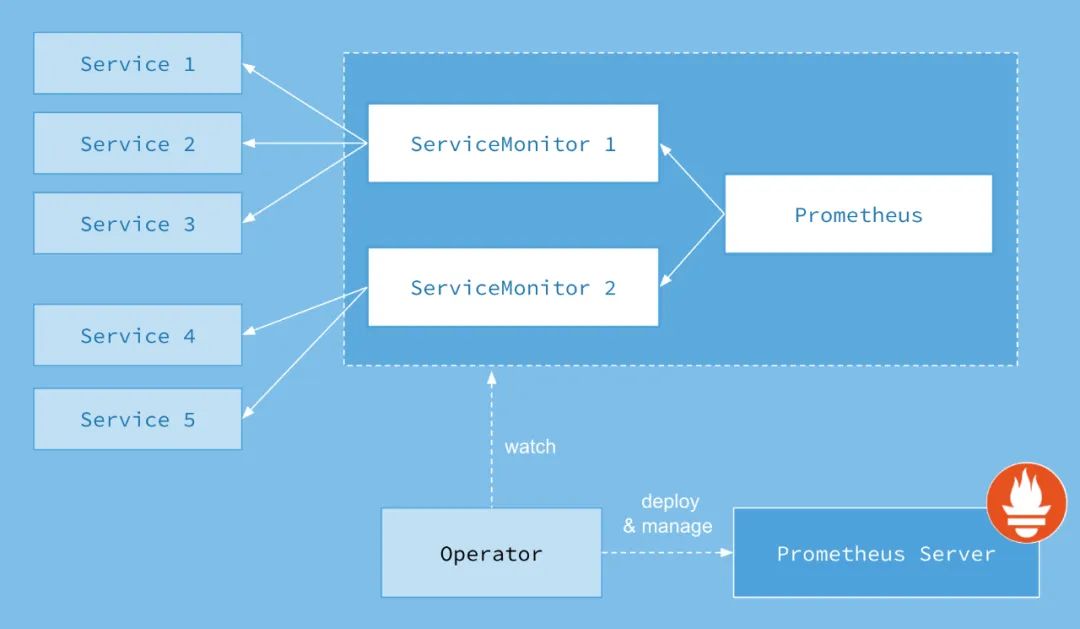
Prometheus is responsible for the implementation of a group of user-defined CRD resources and controllers. Prometheus Operator is responsible for monitoring the changes of these user-defined resources and automatically completing the automatic management of Prometheus Server itself and configuration according to the definition of these resources.
What can Prometheus Operator do?
To understand what the Prometheus # Operator can do is to understand what customized Kubernetes resources the Prometheus Operator provides us, and list the four types of resources currently provided by the Prometheus Operator:
-
Prometheus: create and manage Prometheus Server instances declaratively;
-
ServiceMonitor: responsible for declarative management monitoring configuration;
-
PrometheusRule: responsible for declarative management alarm configuration;
-
Alertmanager: create and manage alertmanager instances declaratively.
In short, Prometheus Operator can help users automatically create and manage Prometheus Server and its corresponding configuration.
Deploy Prometheus Operator in k8s cluster
The following steps are in k8s of master Node operation
It is very easy to install the Prometheus Operator in Kubernetes. Users can the source code of Prometheus Operator from the following address:
git clone https://github.com/coreos/prometheus-operator.git
The folder Prometheus operator in git above has been packaged into a compressed package. The compressed package contains all the files of the later experiment. You can download it on Baidu online disk, then upload it to your k8s master node, decompress it and refer to it. The compressed package is on Baidu online disk. The address is as follows:
Link: https://pan.baidu.com/s/10klyCGya4bQxrmtpxqnyHQ extraction code: cd33
Here, we create a separate namespace monitoring for Promethues Operator:
kubectl create namespace monitoring
Since RBAC authorization is required for Prometheus Operator, the default bundle The default namespace is used in yaml, so you need to replace the bundle before installing the Prometheus Operator All namespace definitions in yaml file are modified from default to monitoring. Install the Deployment instance of Prometheus Operator by running the following command:
cd prometheus-operator/

kubectl -n monitoring apply -f bundle.yaml
Note: if the error ImagePullBackOff is reported, it means that the Prometheus operator image cannot be pulled, and the Prometheus operator can be tar. Upload the GZ compressed package to the node node of k8s and decompress it manually
docker load -i prometheus-operator.tar.gz
The address of Baidu network disk where the image is located is as follows: link: https://pan.baidu.com/s/1zCFuQXVGrF3sdy8XiDGQMQ
Extraction code: 5 hdu
Then execute the following steps
kubectl -n monitoring delete -f bundle.yaml
kubectl -n monitoring apply -f bundle.yaml
[root@master prometheus-operator]# kubectl -n monitoring apply -f bundle.yaml
customresourcedefinition.apiextensions.k8s.io/alertmanagers.monitoring.coreos.com configured
customresourcedefinition.apiextensions.k8s.io/podmonitors.monitoring.coreos.com configured
customresourcedefinition.apiextensions.k8s.io/prometheuses.monitoring.coreos.com created
customresourcedefinition.apiextensions.k8s.io/prometheusrules.monitoring.coreos.com configured
customresourcedefinition.apiextensions.k8s.io/servicemonitors.monitoring.coreos.com configured
customresourcedefinition.apiextensions.k8s.io/thanosrulers.monitoring.coreos.com configured
clusterrolebinding.rbac.authorization.k8s.io/prometheus-operator configured
clusterrole.rbac.authorization.k8s.io/prometheus-operator configured
deployment.apps/prometheus-operator created
serviceaccount/prometheus-operator created
service/prometheus-operator created


[root@master prometheus-operator]# kubectl get pod -n monitoring
NAME                                   READY   STATUS    RESTARTS   AGE
prometheus-operator-7d6496d74b-vrjcj   1/1     Running   0          48s
You can see that the Prometheus operator is successfully deployed.