1. Host monitoring
(1). Deploy node_exporter
root@docker-3 src]# tar xf node_exporter-0.18.1.linux-amd64.tar.gz
[root@docker-3 src]# mv node_exporter-0.18.1.linux-amd64 /usr/local/node_exporter-0.18.1
[root@docker-3 src]# ln -s /usr/local/node_exporter-0.18.1/ /usr/local/node_exporter

//Modify node_exporter profile
[root@jumpserver ~]# cat /usr/lib/systemd/system/node_exporter.service
[Unit]
Description=Prometheus node_exporter
[Service]
User=nobody
ExecStart=/usr/local/node_exporter/node_exporter --log.level=error
ExecStop=/usr/bin/killall node_exporter
[Install]
WantedBy=default.target

//Start node_exporter
[root@jumpserver x]# systemctl start node_exporter
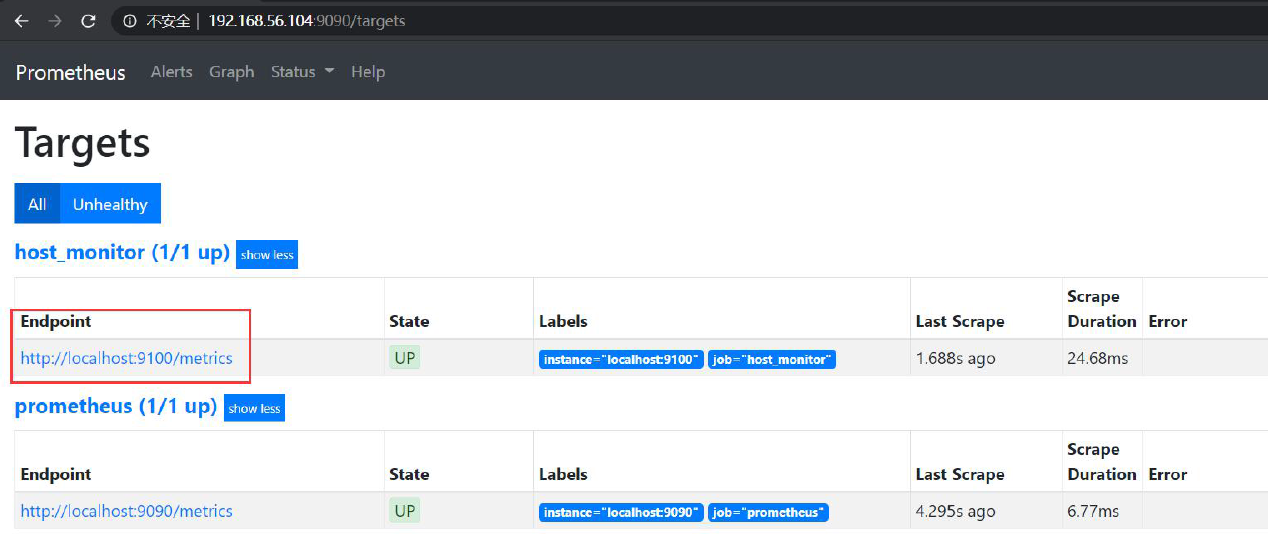
(2). Modify the prometheus file and restart
//Modify the prometheus configuration and add a monitoring node
[root@jumpserver x]# vim /usr/local/prometheus/prometheus.yml
- job_name: 'host_monitor'
	static_configs:
	- targets: ['localhost:9100'] ##Add 9100 port host monitoring

//Check prometheus configuration syntax
[root@docker-3 prometheus]# cd /usr/local/prometheus/
[root@docker-3 prometheus]# ./promtool check config prometheus.yml
Checking prometheus.yml
SUCCESS: 0 rule files found

//Restart prometheus
[root@jumpserver x]# systemctl restart prometheus
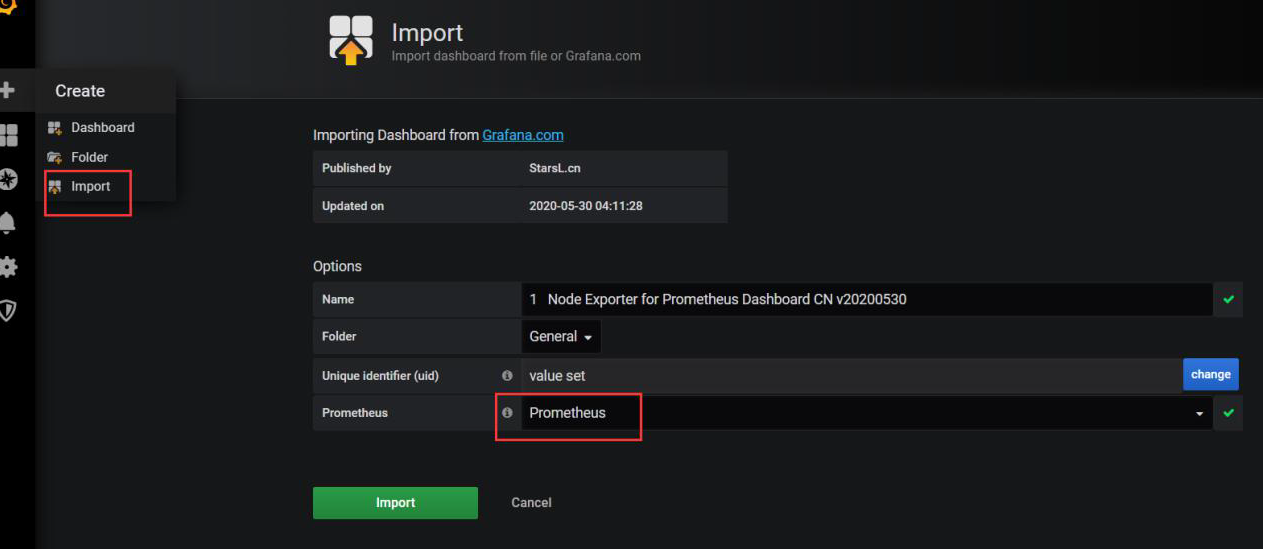
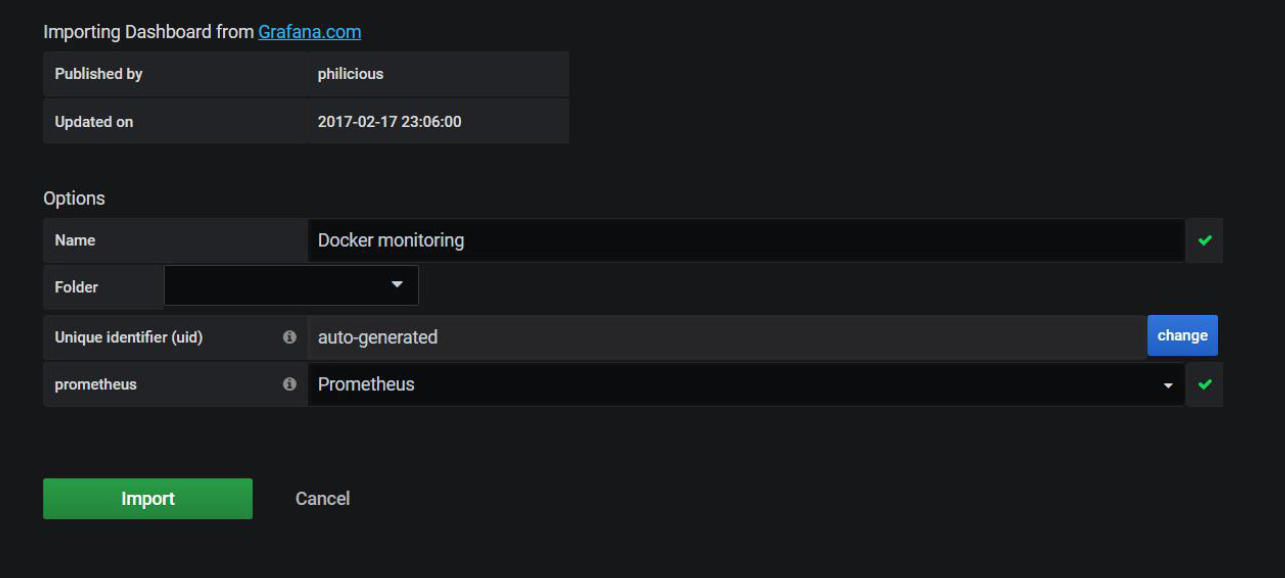
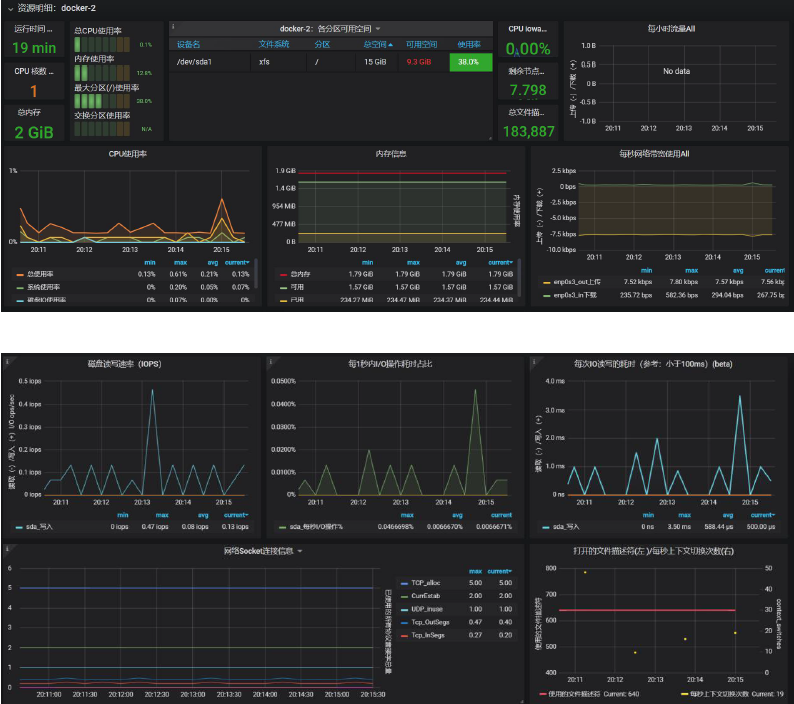
Import host template 8919
2.MySQL stand-alone monitoring
(1). Deploy mysql_exporter
[root@docker-3 src]# wget -c
https://github.com/prometheus/mysqld_exporter/releases/download/v0.12.1/mysqld_exporter-
0.12.1.linux-amd64.tar.gz

[root@docker-3 src]# tar xf mysqld_exporter-0.12.1.linux-amd64.tar.gz
[root@docker-3 src]# mv mysqld_exporter-0.12.1.linux-amd64 /usr/local/mysqld_exporter-0.12.1
[root@docker-3 src]# ln -s /usr/local/mysqld_exporter-0.12.1/ /usr/local/mysqld_exporter

//Managed by systemd
[root@docker-2 ~]# cat /usr/lib/systemd/system/mysqld_exporter.service
[Unit]
Description=mysql Monitoring System
Documentation=mysql Monitoring System

[Service]
ExecStart=/usr/local/mysqld_exporter/mysqld_exporter \
		--collect.info_schema.processlist \
		--collect.info_schema.innodb_tablespaces \
		--collect.info_schema.innodb_metrics \
		--collect.perf_schema.tableiowaits \
		--collect.perf_schema.indexiowaits \
		--collect.perf_schema.tablelocks \
		--collect.engine_innodb_status \
		--collect.perf_schema.file_events \
		--collect.binlog_size \
		--collect.info_schema.clientstats \
		--collect.perf_schema.eventswaits \
		--config.my-cnf=/usr/local/mysqld_exporter/.my.cnf

[Install]
WantedBy=multi-user.target
(2). Add profile
[root@docker-3 src]# cat /usr/local/mysqld_exporter/.my.cnf
[client]
host=localhost
user=exporter
password=123456
socket=/tmp/mysql3306.sock
(3).mysql add authorization account
db02 [(none)]>GRANT SELECT, PROCESS, SUPER, REPLICATION CLIENT, RELOAD ON *.* TO
'exporter'@'localhost' IDENTIFIED BY '123456';
Query OK, 0 rows affected, 1 warning (0.00 sec)
db02 [(none)]>flush privileges;
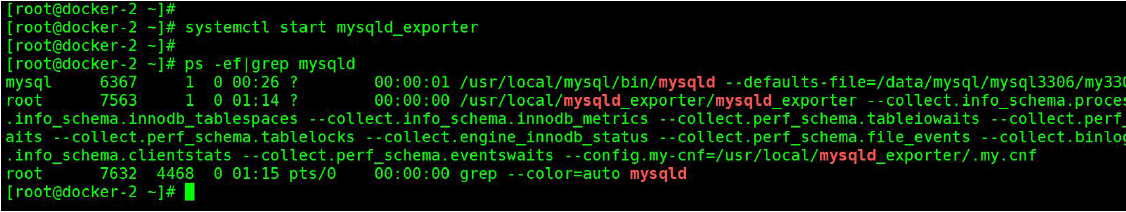
[root@docker-2 ~]# systemctl start mysqld_exporter
http://ip:9104/metrics
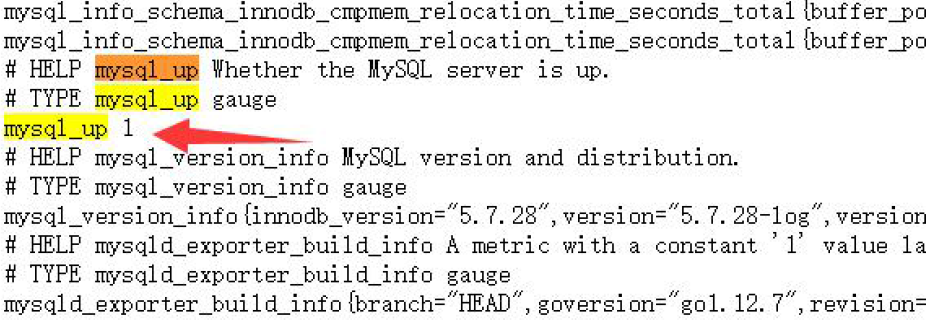
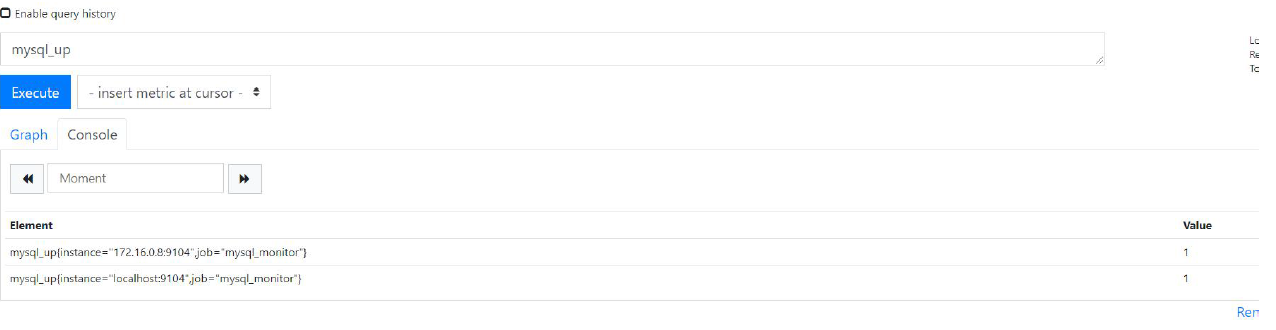
mysql_up 1 ## means that MySQL is monitored and started
(4). Modify the prometheus file and restart
- job_name: 'mysql_monitor'
	static_configs:
	- targets: ['172.16.0.8:9104']

[root@docker-3 src]# systemctl restart prometheus
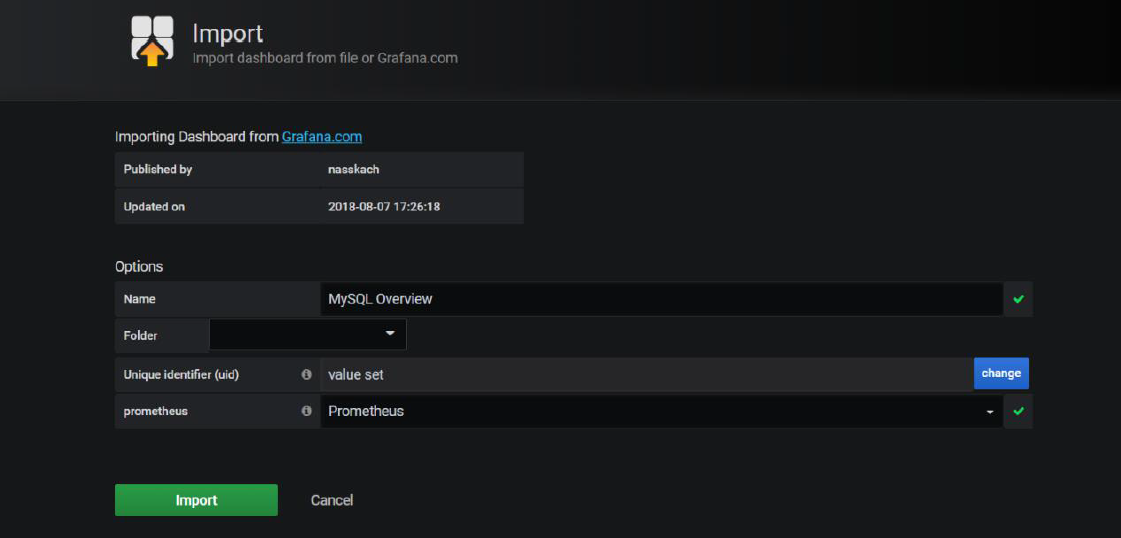
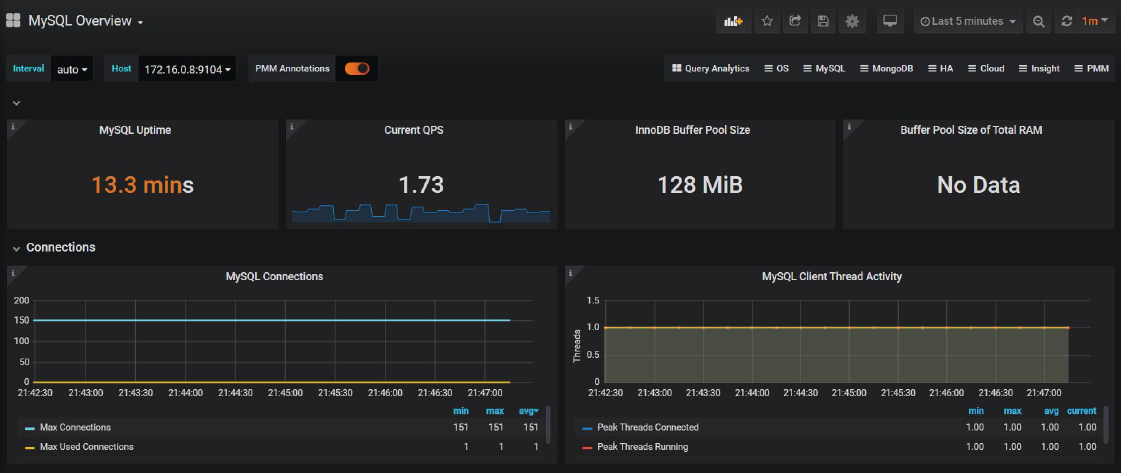
Mysql status monitoring template 7362
3.MySQL master-slave monitoring
(1). Master slave configuration
Environmental preparation
[root@docker-3 src]# cat /data/mysql/mysql3306/my3306.cnf
[mysql]
prompt="\u@\h [\d]>"
[mysqld]
user = mysql
basedir = /usr/local/mysql
datadir = /data/mysql/mysql3306/data
log-error=/data/mysql/mysql3306/data/error_3306.log
server_id = 19
port = 3306
log_bin=/data/mysql/mysql3306/binlog/mysql-bin
binlog_format=row
gtid-mode=on
enforce-gtid-consistency=true
socket = /tmp/mysql3306.sock[root@docker-2 system]#


[root@docker-2 system]# cat /data/mysql/mysql3306/my3306.cnf
[mysqld]
user = mysql
basedir = /usr/local/mysql
datadir = /data/mysql/mysql3306/data
log_bin= /data/mysql/mysql3306/binlog/mysql-bin
server_id = 18
gtid-mode=on
enforce-gtid-consistency=true
port = 3306
socket = /tmp/mysql3306.sock

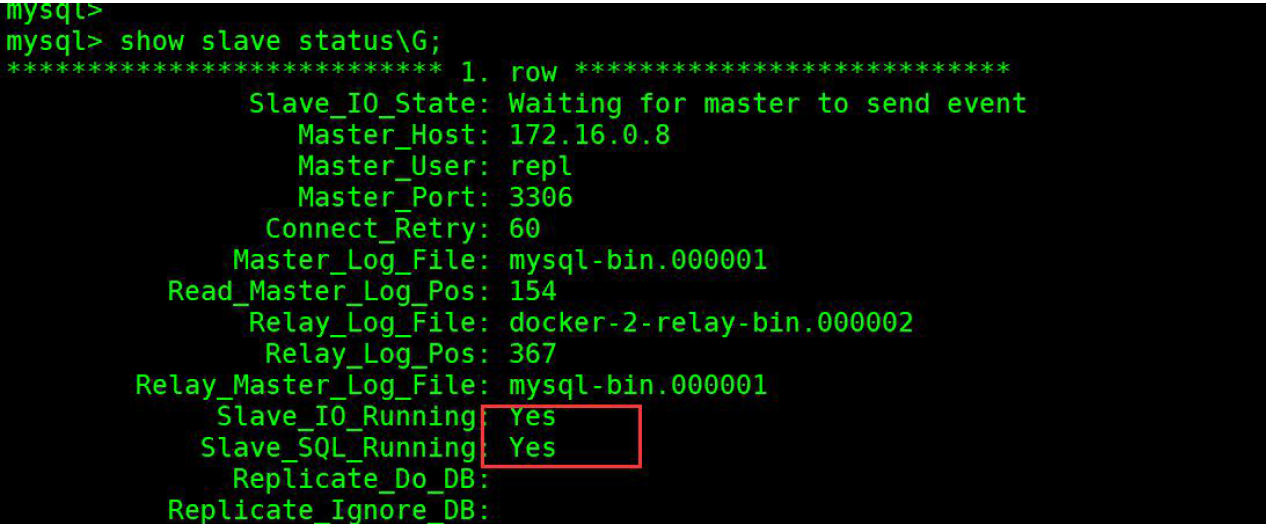
//Main library
grant replication slave on *.* to repl@'172.16.0.%' identified by '123456';

//Slave Library
CHANGE MASTER TO MASTER_HOST='172.16.0.8',
MASTER_USER='repl',
MASTER_PASSWORD='123456',
MASTER_PORT=3306,
MASTER_AUTO_POSITION=1;

mysql> start slave;
mysql> show slave status\G;
Add MySQL from the library_ Exporter monitoring, the process is consistent with the master-slave steps
View from library
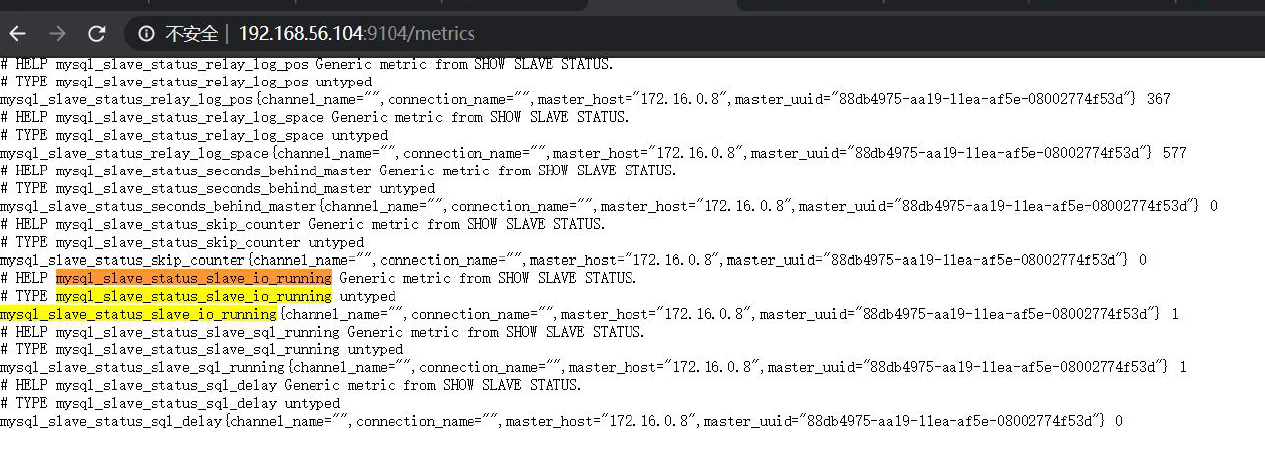
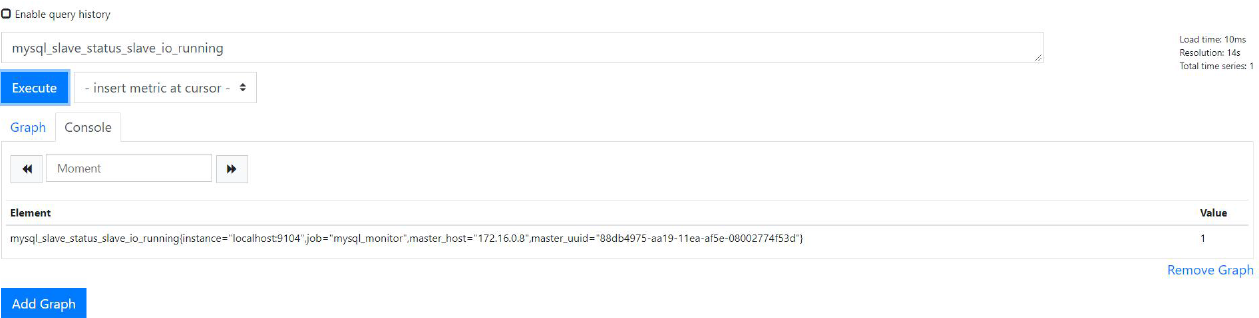
Verify slave database indicators
mysql_slave_status_slave_io_running
(2). Modify the prometheus file and restart
modify prometheus to configure
- job_name: 'mysql_monitor'
	static_configs:
	- targets: ['172.16.0.8:9104','localhost:9104']

[root@docker-3 src]# systemctl restart prometheus
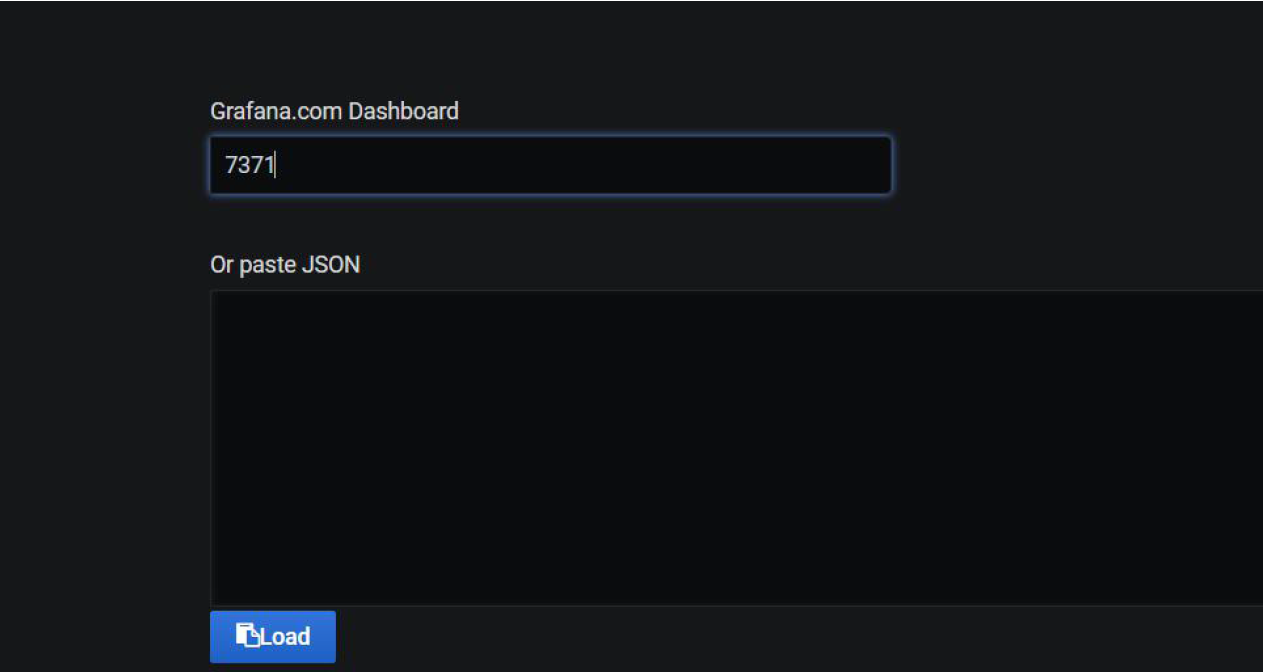
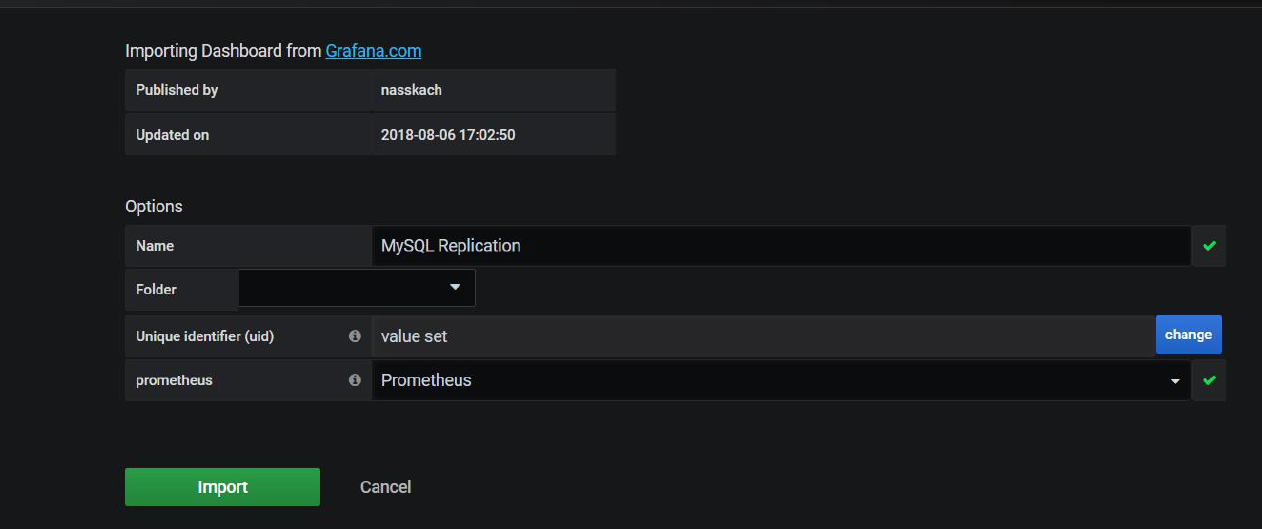
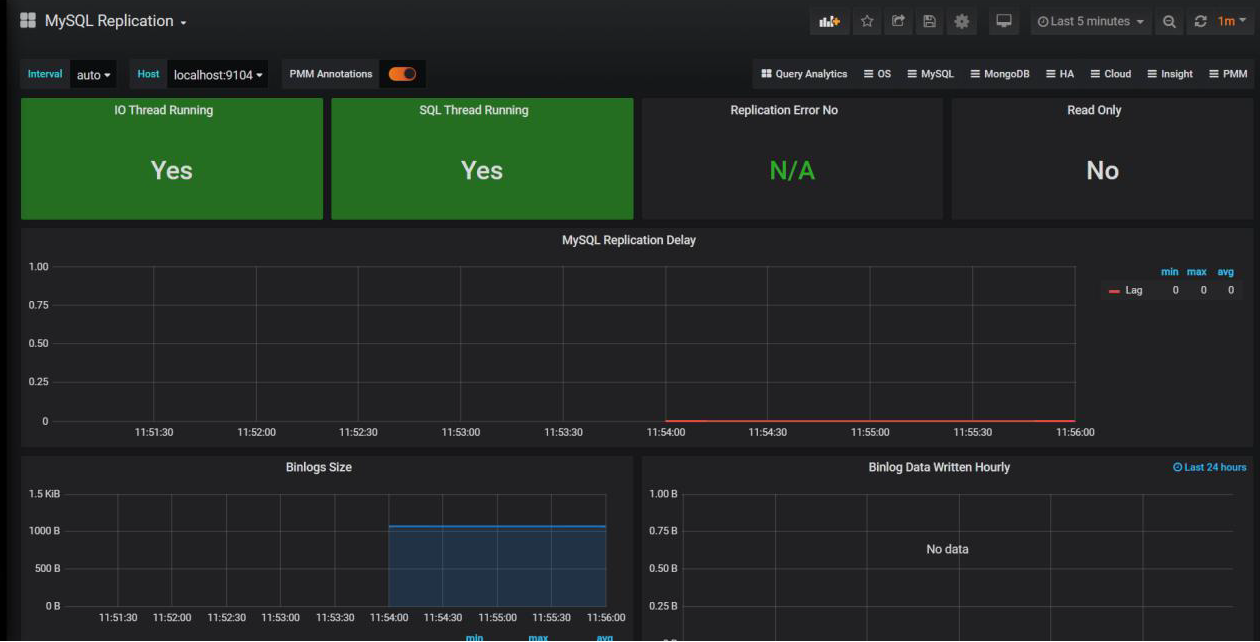
Master slave template 7371
(3). Add MySQL alarm rule
[root@docker-3 rules]# cat /usr/local/prometheus/rules/mysql.yml
groups:
- name: MySQL-rules
rules:
- alert: MySQL Status
expr: up == 0
for: 5s
labels:
severity: warning
annotations:
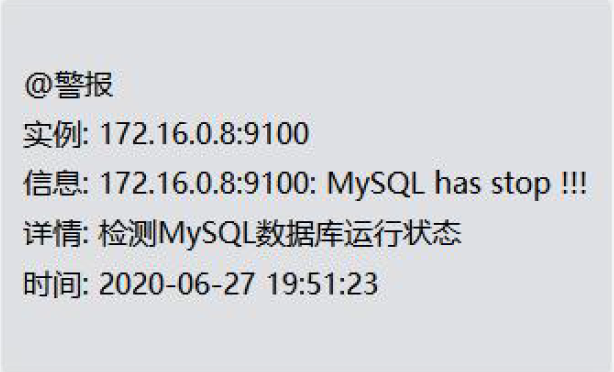
summary: "{{$labels.instance}}: MySQL has stop "
description: "MySQL The database hung up,Please check"
- alert: MySQL Slave IO Thread Status
expr: mysql_slave_status_slave_io_running == 0
for: 5s
labels:
severity: warning
annotations:
summary: "{{$labels.instance}}: MySQL Slave IO Thread has stop "
description: "testing MySQL Master and slave IO Thread running state"
- alert: MySQL Slave SQL Thread Status
expr: mysql_slave_status_slave_sql_running == 0
for: 5s
labels:
severity: warning
annotations:
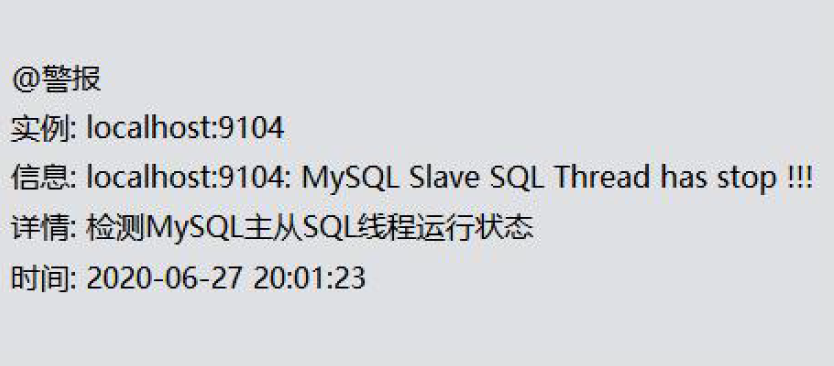
summary: "{{$labels.instance}}: MySQL Slave SQL Thread has stop "
description: "testing MySQL Master and slave SQL Thread running state"
Stop viewing from library
[root@docker-3 rules]# systemctl stop mysqld3306
Stop viewing sql threads from the library
mysql> stop slave sql_thread;
4.Redis monitoring
(1). Deploy redis_exporter
[root@docker-3 src]# wget https://github.com/oliver006/redis_exporter/releases/download/v0.30.0/redis_exporter-v0.30.0.linux-amd64.tar.gz
[root@docker-3 src]# mkdir /usr/local/redis_exporter
[root@docker-3 src]# tar xf redis_exporter-v0.30.0.linux-amd64.tar.gz
[root@docker-3 src]# mv redis_exporter /usr/local/redis_exporter/
After decompression, there is only one binary program called redis_ The exporter can get help information through - h. some common options are listed below:
- redis.addr: indicates the address of one or more Redis nodes. Multiple nodes are separated by commas. The default is
redis://localhost:6379 - redis.password: the password used to verify Redis;
- redis.file: contains the file path of one or more redis nodes, one node per line. This option is the same as - redis Addr mutual
Reprimand. - web. Listen address: the listening address and port. The default is 0.0.0.0:9121
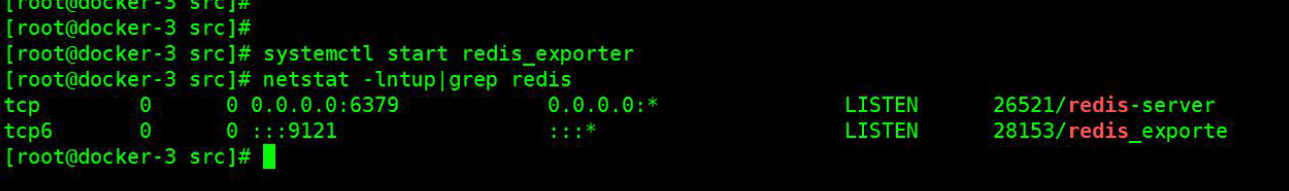
Run redis_exporter service
Direct start
- No password
./redis_exporter redis//172.16.0.9:6379 & - Have password
redis_exporter -redis.addr 172.16.0.9:6379 -redis.password 123456
Start in system D mode
vim /usr/lib/systemd/system/redis_exporter.service
[Unit]
Description=redis_exporter
Documentation=https://github.com/oliver006/redis_exporter
After=network.target
[Service]
Type=simple
User=prometheus
ExecStart=/usr/local/redis_exporter/redis_exporter -redis.addr 172.16.0.9:6379
Restart=on-failure
[Install]
WantedBy=multi-user.target
[root@docker-3 src]# useradd prometheus -s /sbin/nologin -M
(2). Modify the prometheus file and restart
- job_name: 'redis_exporter'
	scrape_interval: 10s
	static_configs:
	- targets: ['172.16.0.9:9121']
[root@docker-3 src]# /usr/local/prometheus/promtool check config /usr/local/prometheus/prometheus.yml
[root@docker-3 src]# systemctl restart prometheus
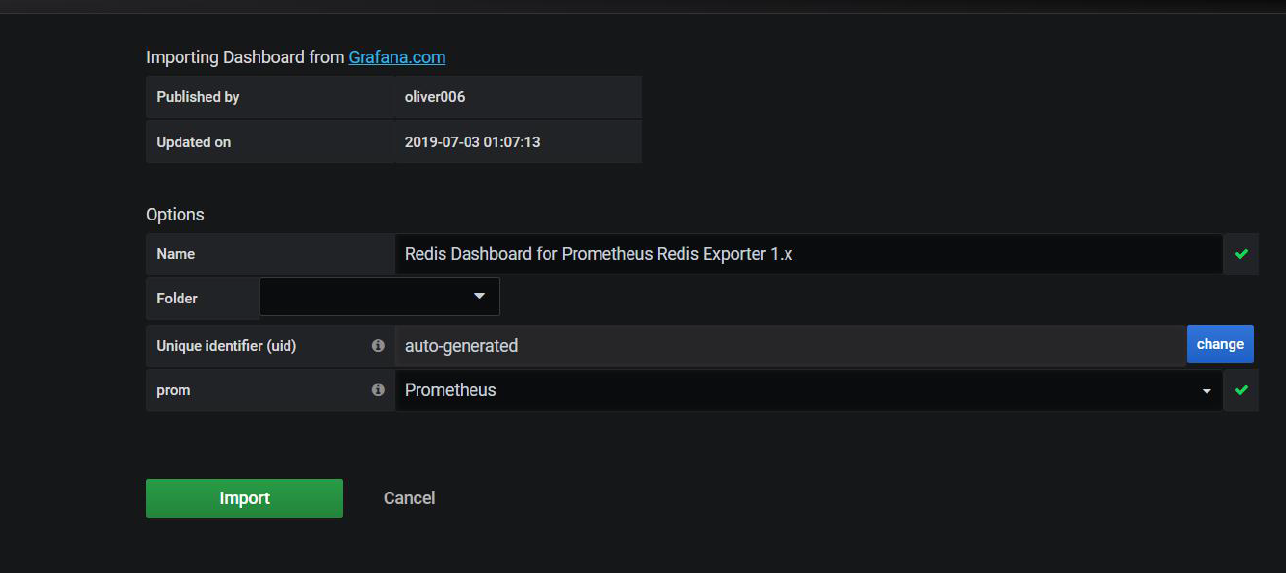
Import redis monitoring template 763
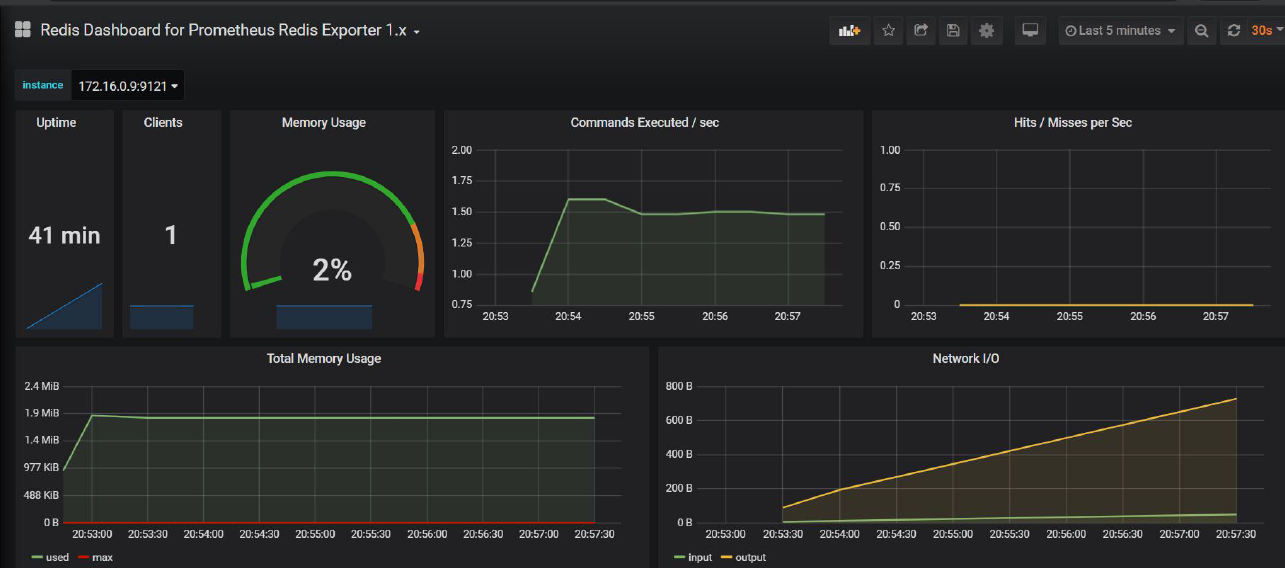
Note here: if redis does not configure the maximum available memory value
127.0.0.1:6379> CONFIG GET maxmemory
1) "maxmemory"
2) "0"
Then the memory value is displayed as 0 on the grafana interface
The configuration parameters are as follows
maxmemory 128m
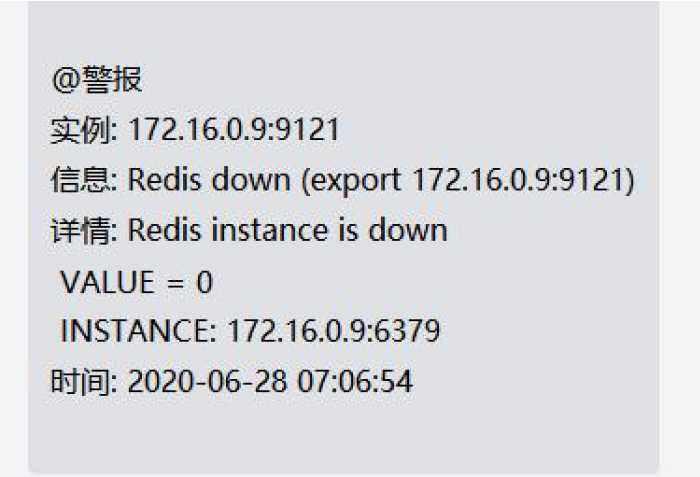
(3). Add Redis alarm rule
[root@docker-3 rules]# cat redis.yml

groups:
- name: redis_instance
	rules:
	#Risk level of redis instance downtime: 5
	- alert: RedisInstanceDown
		expr: redis_up == 0
		for: 10s
		labels:
			severity: warning
		annotations:
			summary: "Redis down (export {{ $labels.instance }})"
			description: "Redis instance is down\n VALUE = {{ $value }}\n INSTANCE: {{ $labels.addr }} {{ $labels.alias }}"

	#Too much redis memory usage hazard level: 4
	- alert: RedisOutofMemory
		expr: redis_memory_used_bytes / redis_total_system_memory_bytes * 100 > 60
		for: 3m
		labels:
			severity: warning
		annotations:
			summary: "Out of memory (export {{ $labels.instance }})"
			description: "Redis is running out of memory > 80%\n VALUE= {{ $value }}\n INSTANCE:{{ $labels.addr }} {{ $labels.alias }}"

	# Too many redis connections, danger level: 3
	- alert: RedisTooManyConnections
		expr: redis_connected_clients > 2000
		for: 3m
		labels:
			severity: warning
		annotations:
			summary: "Too many connections (export {{ $labels.instance}})"
			description: "Redis instance has too many connections\n value = {{$value}}\n INSTANCE:{{ $labels.addr }} {{ $labels.alias }}"
[root@docker-3 rules]# /usr/local/prometheus/promtool check config
/usr/local/prometheus/prometheus.yml
[root@docker-3 rules]# systemctl restart prometheus
Stop redis observation
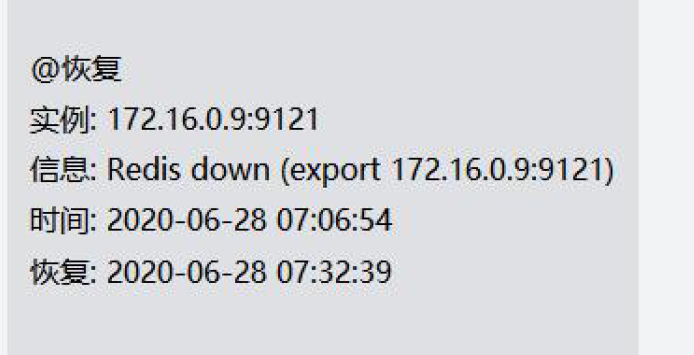
Resume observation
5.elasticsearch cluster monitoring
(1).Es cluster environment preparation
Install java
yum install -y java-1.8.0-openjdk.x86_64
1. Install software
rpm -ivh elasticsearch-6.6.0.rpm
2. Modify the configuration file
[root@db02 elasticsearch]# cat /etc/elasticsearch/elasticsearch.yml
cluster.name: Linux
node.name: node-2
path.data: /data/elasticsearch
path.logs: /var/log/elasticsearch
bootstrap.memory_lock: true
network.host: 172.16.0.7,127.0.0.1
http.port: 9200
discovery.zen.ping.unicast.hosts: ["172.16.0.7", "172.16.0.8"]
discovery.zen.minimum_master_nodes: 2
3. Modify memory lock
[root@db02 ~]# systemctl edit elasticsearch
[Service]
LimitMEMLOCK=infinity
4. Create data directory and authorize
mkidr /data/elasticsearch
chown =R elasticsearch:elasticsearch /data/elasticsearch
5. Restart the service
systemctl daemon-reload
systemctl start elasticsearch
6. View logs and ports
tail -f /var/log/elasticsearch/Linux.log
netstat -lntup:grep 9200
(2). Deploy es_export
wget https://github.com/justwatchcom/elasticsearch_exporter/releases/download/v1.1.0/elasticsearch_exporter-1.1.0.linux-amd64.tar.gz
tar -xvf elasticsearch_exporter-1.1.0.linux-amd64.tar.gz
mv elasticsearch_exporter-1.1.0.linux-amd64 /us r/local/elasticsearch_exporter-1.1.0
ln -s /usr/local/elasticsearch_exporter-1.1.0 /usr/local/elasticsearch_exporter
Run es_export service
Direct start
nohup ./elasticsearch_exporter --es.uri http://172.16.0.7:9200 &
–es.uri default http://localhost:9200 , the address (host and port) of the Elasticsearch node connected to
Start in system D mode
cat /etc/systemd/system/elasticsearch_exporter.service
[Unit]
Description=Elasticsearch stats exporter for Prometheus
Documentation=Prometheus exporter for various metrics
[Service]
ExecStart=/usr/local/elasticsearch_exporter/elasticsearch_exporter --es.uri http://ip:9200
[Install]
WantedBy=multi-user.target
http://ip:9114/metrics/ View the collected information
(3). Modify the prometheus file and restart
- job_name: 'elasticsearch_exporter'
	scrape_interval: 10s
	metrics_path: "/_prometheus/metrics"
	static_configs:
	- targets: ['172.16.0.5:9114','172.16.0.6:9114','172.16.0.7:9114',]
Import granfana template 2322 / 266
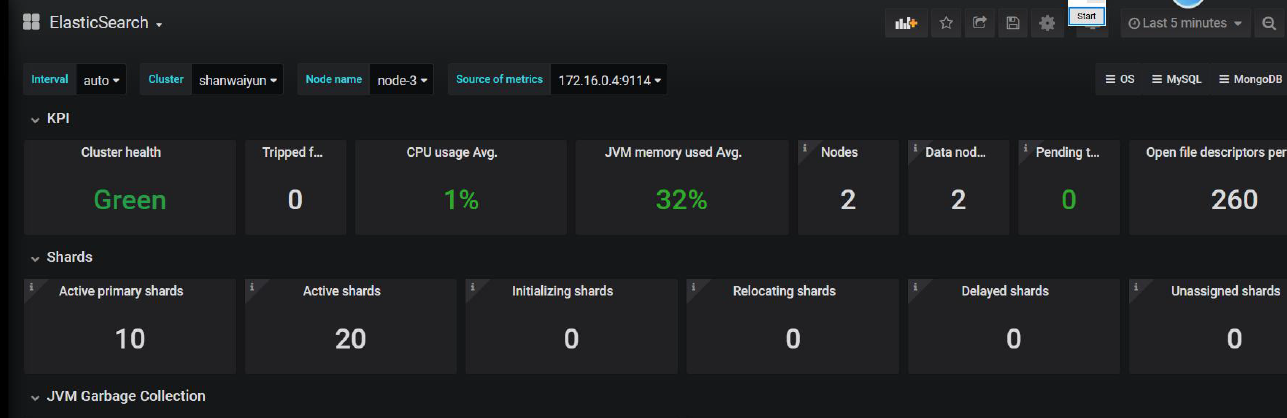
(4). Add es alarm rule
Cluster status, green (all primary partitions and replica partitions are running normally), yellow (all primary partitions are running normally, but not all replica partitions are running normally) red (some primary partitions are not running normally)
groups:
- name: es
	rules:
	- alert: esclusterwrong
		expr: elasticsearch_cluster_health_status{color="green"} != 1
		for: 10s
		labels:
			severity: critical
		annotations:
			description: "elasticsearch cluster {{$labels.server}} abnormal"
	- alert: esDown
		expr: elasticsearch_cluster_health_number_of_nodes != 3
		for: 10s
		labels:
			severity: critical
		annotations:
			description: "elasticsearch service {{$labels.instance}} down"
6.Docker monitoring
Ccadvisor exposes container statistics as Prometheus indicators.
By default, these indicators are provided under the / metrics HTTP endpoint.
You can set - Prometheus_ The endpoint command line flag is customized for this endpoint.
To use Prometheus to monitor coadvisor, you only need to configure one or more jobs in Prometheus, which will
Scrape the relevant cadadvisor process at the endpoint of the indicator.
(1).Docker environment preparation
CentOS 7 (install using yum or up2date)
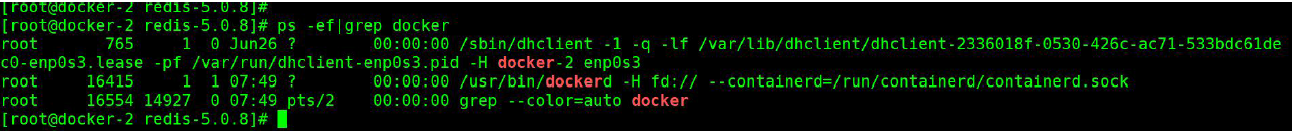
# step 1: install some necessary system tools
sudo yum install -y yum-utils device-mapper-persistent-data lvm2
# Step 2: add software source information
sudo yum-config-manager --add-repo
https://mirrors.aliyun.com/docker-ce/linux/centos/docker-ce.repo
# Step 3: update and install docker CE
sudo yum makecache fast
sudo yum -y install docker-ce
# Step 4: start Docker service
sudo service docker start
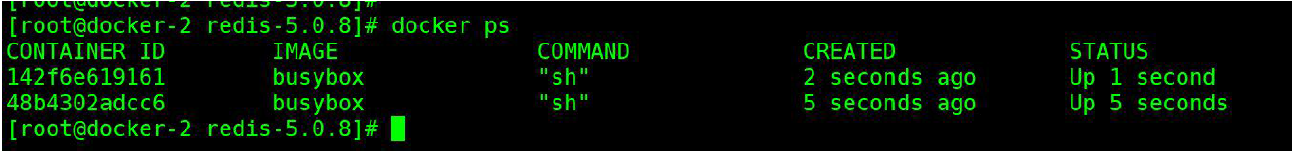
# Download test image
[root@docker-2 redis-5.0.8]# docker pull busybox

# Build container
[root@docker-2 redis-5.0.8]# docker run -itd --name bb1 busybox
[root@docker-2 redis-5.0.8]# docker run -itd --name bb2 busybox
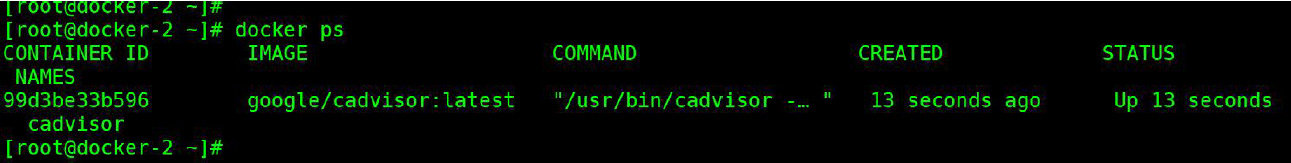
docker run \
--volume=/:/rootfs:ro \
--volume=/var/run:/var/run:ro \
--volume=/sys:/sys:ro \
--volume=/var/lib/docker/:/var/lib/docker:ro \
--volume=/dev/disk/:/dev/disk:ro \
--publish=8080:8080 \
--detach=true \
--name=cadvisor \
google/cadvisor:latest
Verify collected data
[root@docker-2 network-scripts]# curl http://172.16.0.8:8080/metrics
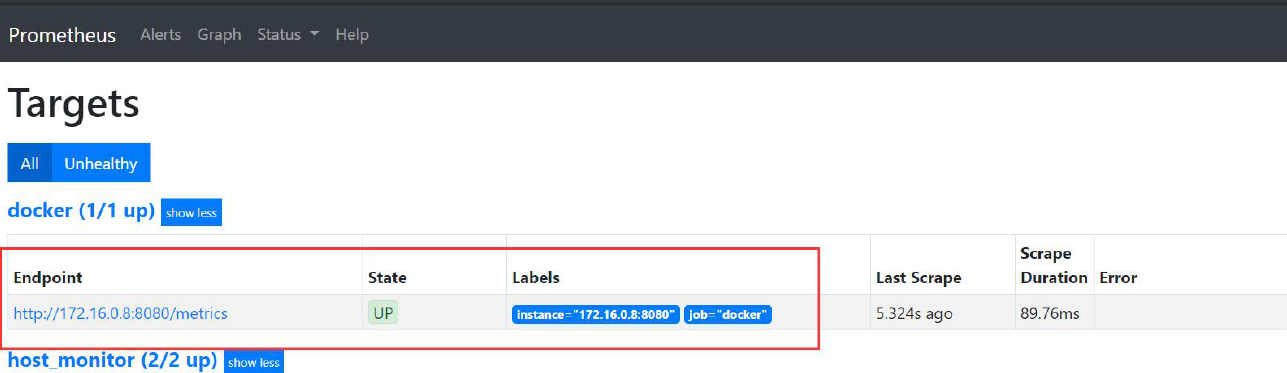
(2). Modify the prometheus file and restart
# Prometheus adds docker monitoring
- job_name: 'docker'
	static_configs:
	- targets: ['172.16.0.8:8080']
[root@docker-3 rules]# /usr/local/prometheus/promtool check config /usr/local/prometheus/prometheus.yml
[root@docker-3 rules]# systemctl restart prometheus
- Container CPU usage:
sum(irate(container_cpu_usage_seconds_total{image!=""}[1m])) without (cpu) - Query container memory usage (unit: bytes):
container_memory_usage_bytes{image!=""} - Query container network reception rate (unit: bytes / second):
sum(rate(container_network_receive_bytes_total{image!=""}[1m])) without (interface) - Query container network transmission rate (unit: bytes / second):
sum(rate(container_network_transmit_bytes_total{image!=""}[1m])) without (interface) - Query container file system read rate (unit: bytes / second):
sum(rate(container_fs_reads_bytes_total{image!=""}[1m])) without (device) - Query container file system write rate (unit: bytes / second):
sum(rate(container_fs_writes_bytes_total{image!=""}[1m])) without (device)
Grana template: FANA 193 template: