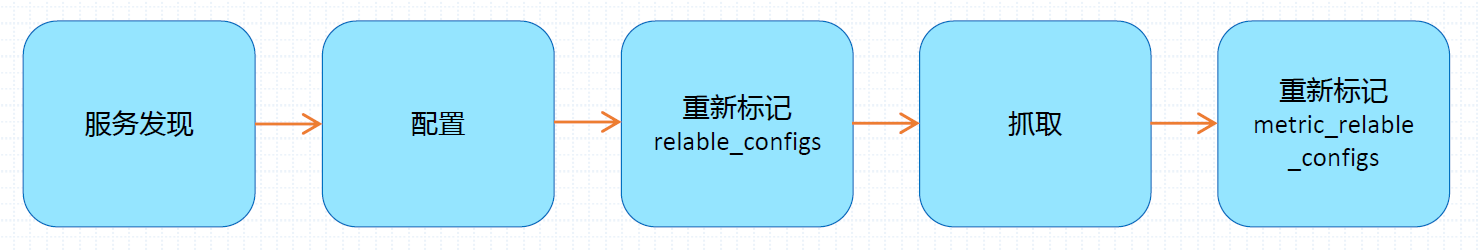
Life cycle of indicator capture
Prometheus in each scene_ During the interval, the executed jobs will be detected, and these jobs will generate a target list according to the specified service discovery configuration;
- Service discovery will return a list of target s containing a set of__ meta_ Tag of metadata beginning with;
- Service discovery also sets other tags based on the target configuration with__ Prefixes and suffixes, including__ scheme__ ,__ address__ , And__ metrics_path__ , The protocol supported by the target, the address of the target and the uri path of the indicator are saved respectively (metric by default). These target lists and labels will be returned to Prometheus, and some of them can also be overwritten in the configuration.
The configuration tag will be reused in the captured life cycle to generate other tags. For example, the default value of the instance tag on the indicator comes from__ address__ The value of the label.
Prometheus provides the opportunity to re mark the found targets. You can configure the relabel in the job section_ Configure in configs. It is usually used to filter the target and attach the information in the metadata tag to the tag of the indicator.
After re marking, the indicator data will be captured and returned. Before saving the received indicator data, users are also allowed to use metric_ relabel_ In the configs configuration section, the indicator data is re marked and filtered. It is usually used to delete unnecessary indicators, delete sensitive or unnecessary labels in indicators, and add, edit or modify the label value or label format of indicators.
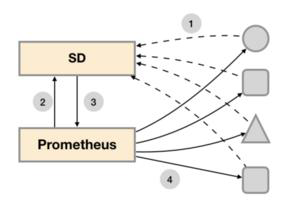
Service discovery
The data capture of Prometheus Server is based on the Pull model. Therefore, it must know the location of each target in advance before it can capture data from the corresponding Exporter or Instrumentation.
For small system environments, use static_configs can solve the problem by specifying each target, but in medium and large-scale system environments or cloud computing environments with strong dynamics, static configuration is difficult to adapt. Prometheus has specially designed a set of service discovery mechanisms to automatically discover, detect and classify targets that can be monitored and update changed targets based on the service registry.
Integrated service discovery mechanism
Prometheus can be integrated into many different open source Service discovery tools to dynamically discover the targets to be monitored. Prometheus can be well integrated into Kubernetes platform, dynamically discover all kinds of monitored Pod, Service, Endpoint, progress and Node objects through its API Server, and also support dynamic discovery based on files.
[tip] Prometheus also supports service discovery based on docker swarm and marathon. Official documents
File based service discovery
File based service discovery, which does not depend on any platform or third-party services, is the simplest and most common implementation. The configuration file format is as follows
# Official documents
# Patterns for files from which target groups are extracted.
files:
  [ - <filename_pattern> ... ]

# Refresh interval to re-read the files.
[ refresh_interval: <duration> | default = 5m ]
# prometheus.yml
- job_name: "nodes"
    file_sd_configs:
      - files:
          - "./targets/*.yaml"
        refresh_interval: 1m
# targets/nodes.yaml
- labels:
    server: "Prometheus"
  targets:
    - "localhost:9090"

- labels:
    server: "haproxy"
    role: "api-server endpoint"
  targets:
    - "node07.example.com:9100"
    - "node08.example.com:9100"
The contents of dynamic discovery files are usually generated by another system. Configuration management systems such as Ansible, Saltstack or Puppet can also be generated by scripts based on regular queries in the CMDB system.
Service discovery based on Kubernetes API
The Service discovery mechanism based on Kubernetes API supports monitoring resource objects under resource types such as Pod, Service, Endpoint, progress and Node in API Server as target s. These resource objects are defined by their own discovery mechanisms. They are responsible for discovering the components of each type of resource object. In Prometheus, they are called a role (not a role in Kubernetes). It also supports Node deployment based on the DaemonSet controller on the cluster_ After the exporter, all nodes are found.
Node resource discovery
Prometheus's node role regards each node in the cluster as a target, and these nodes listen to the ports used by Kubelet. The node role will retrieve the NodeInternalIP, NodeExternalIP, NodeLegacyHostIP and NodeHostName on the node specification in turn, and take the first address found as the target address__ address__.
The value of the instance tag on the node is taken from the node name found in the API Server.
Service resource discovery
Prometheus's service role is responsible for discovering each service resource on the cluster. Each port declared on the service will be regarded as a target, and the address is the DNS name of the service and the corresponding port.
Pod resource discovery
Prometheus' pod role is responsible for discovering each pod resource in the cluster and exposing its container as target. Each port on the pod will be regarded as a target, and a "no port" type target will be created for containers that do not specify a port, so that users can manually add ports through the relax function.
Endpoint resource discovery
Prometheus' endpoint role will find targets from various endpoint resources. Each port on the endpoint will be regarded as a target. If the backend workload of the endpoint is a pod, other ports on the pod that are not bound to the endpoint will also be regarded as a target.
Ingress resource discovery
Prometheus's ingress role will discover the ingress resource from the API Server. Each path on the progress resource will be regarded as a target. The associated address is set to the value of the associated host field on the ingress resource.
# The information to access the Kubernetes API.

# The API server addresses. If left empty, Prometheus is assumed to run inside
# of the cluster and will discover API servers automatically and use the pod's
# CA certificate and bearer token file at /var/run/secrets/kubernetes.io/serviceaccount/.
[ api_server: <host> ]

# The Kubernetes role of entities that should be discovered.
# One of endpoints, service, pod, node, or ingress.
role: <string>

# Optional path to a kubeconfig file.
# Note that api_server and kube_config are mutually exclusive.
[ kubeconfig_file: <filename> ]

# Optional authentication information used to authenticate to the API server.
# Note that `basic_auth` and `authorization` options are mutually exclusive.
# password and password_file are mutually exclusive.

# Optional HTTP basic authentication information.
basic_auth:
  [ username: <string> ]
  [ password: <secret> ]
  [ password_file: <string> ]

# Optional `Authorization` header configuration.
authorization:
  # Sets the authentication type.
  [ type: <string> | default: Bearer ]
  # Sets the credentials. It is mutually exclusive with
  # `credentials_file`.
  [ credentials: <secret> ]
  # Sets the credentials to the credentials read from the configured file.
  # It is mutually exclusive with `credentials`.
  [ credentials_file: <filename> ]

# Optional OAuth 2.0 configuration.
# Cannot be used at the same time as basic_auth or authorization.
oauth2:
  [ <oauth2> ]

# Optional proxy URL.
[ proxy_url: <string> ]

# Configure whether HTTP requests follow HTTP 3xx redirects.
[ follow_redirects: <bool> | default = true ]

# TLS configuration.
tls_config:
  [ <tls_config> ]

# Optional namespace discovery. If omitted, all namespaces are used.
namespaces:
  names:
    [ - <string> ]

# Optional label and field selectors to limit the discovery process to a subset of available resources.
# See https://kubernetes.io/docs/concepts/overview/working-with-objects/field-selectors/
# and https://kubernetes.io/docs/concepts/overview/working-with-objects/labels/ to learn more about the possible
# filters that can be used. Endpoints role supports pod, service and endpoints selectors, other roles
# only support selectors matching the role itself (e.g. node role can only contain node selectors).

# Note: When making decision about using field/label selector make sure that this
# is the best approach - it will prevent Prometheus from reusing single list/watch
# for all scrape configs. This might result in a bigger load on the Kubernetes API,
# because per each selector combination there will be additional LIST/WATCH. On the other hand,
# if you just want to monitor small subset of pods in large cluster it's recommended to use selectors.
# Decision, if selectors should be used or not depends on the particular situation.
[ selectors:
  [ - role: <string>
    [ label: <string> ]
    [ field: <string> ] ]]
The configuration file can refer to this link