I remember in my last company, a big man made a monitoring system, bullying, really want to study how he did it. Of course, we are not people who pat their heads to work. We can't do what others do. Now let's introduce the benefits of such a platform.
background
First, why do we do the front-end system? Looking at the table below, we can clearly see that the performance of the front-end is very helpful to improve the value of the product. But if we can collect these information in real time, and implement monitoring to keep the whole product running efficiently on the product line, this is our goal.
| performance | Profit |
|---|---|
| Google Delay 400 ms | Search volume decreased by 0.59%. |
| Bing delay 2s | Income fell by 4.3%. |
| Yahoo delay 400 ms | Flow drops by 5-9%. |
| Mozilla Page Opening Reduced by 2.2s | Download volume increased by 15.4%. |
| Netflix opens Gzip | Performance improvement 13.25% bandwidth reduction 50%. |
Secondly, it is also conducive to our release of products, can timely detect our mistakes. If a product has an undescribable error in the new iteration.

Yes! It's not descriptive. We can't wait for users'feedback and complaints. By that time, the Yellow cauliflower will be cold.
start
Based on the above, we began to build a simple front-end monitoring and control platform. (Although there are many such systems on the market, such as ELK, but still can not help but own one)
It can only be simple.

Brothers forgive me. I can only help you here.
Next, please look.
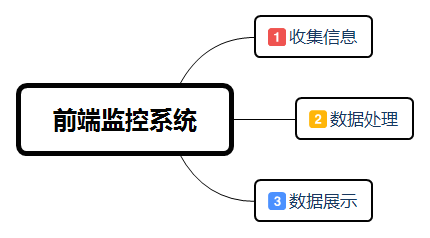
These are some of the things we need to do.
Gathering information
To do the monitoring system, we first have to have an object. We monitor the object! Object! Object! Object.
I wrote a page like this on my system.
<body>
    <div>2</div>
    <div>2</div>
    <div>2</div>
    <div>2</div>
    <div>2</div>
    <div>2</div>
</body>
Yes, that's the page we're monitoring. This... It's not that I'm lazy.

Then I designed three pieces of data.
- Page load time
- Statistical User Use Equipment
- Error statistics
Page load time
window.logInfo = {};  //Statistical Page Loading Time
window.logInfo.openTime = performance.timing.navigationStart;
window.logInfo.whiteScreenTime = +new Date() - window.logInfo.openTime;
document.addEventListener('DOMContentLoaded',function (event) {
  window.logInfo.readyTime = +new Date() - window.logInfo.openTime;
});
window.onload = function () {
  window.logInfo.allloadTime = +new Date() - window.logInfo.openTime;
  window.logInfo.nowTime = new Date().getTime();
  var timname = {
    whiteScreenTime: 'White screen time',
    readyTime: 'User Operational Time',
    allloadTime: 'Total download time',
    mobile: 'Use equipment',
    nowTime: 'time',
  };
  var logStr = '';
  for (var i in timname) {
    console.warn(timname[i] + ':' + window.logInfo[i] + 'ms');
    if (i === 'mobile') {
      logStr += '&' + i + '=' + window.logInfo[i];
    } else {
      logStr += '&' + i + '=' + window.logInfo[i];
    }

  }
  (new Image()).src = '/action?' + logStr;
};
Statistical User Use Equipment
window.logInfo.mobile = mobileType();
function mobileType() {
  var u = navigator.userAgent, app = navigator.appVersion;
  var type =  {// Mobile terminal browser version information
    ios: !!u.match(/\(i[^;]+;( U;)? CPU.+Mac OS X/), //ios terminal
    iPad: u.indexOf('iPad') > -1, //Whether iPad
    android: u.indexOf('Android') > -1 || u.indexOf('Linux') > -1, //android terminal or uc browser
    iPhone: u.indexOf('iPhone') > -1 || u.indexOf('Mac') > -1, //Is it an iPhone or QQHD browser?
    trident: u.indexOf('Trident') > -1, //IE kernel
    presto: u.indexOf('Presto') > -1, //opera kernel
    webKit: u.indexOf('AppleWebKit') > -1, //Apple, Google Kernel
    gecko: u.indexOf('Gecko') > -1 && u.indexOf('KHTML') == -1, //Gecko
    mobile: !!u.match(/AppleWebKit.*Mobile/i) || !!u.match(/MIDP|SymbianOS|NOKIA|SAMSUNG|LG|NEC|TCL|Alcatel|BIRD|DBTEL|Dopod|PHILIPS|HAIER|LENOVO|MOT-|Nokia|SonyEricsson|SIE-|Amoi|ZTE/), //Is it a mobile terminal?
    webApp: u.indexOf('Safari') == -1 //Whether or not the web should be programmed without headers and bottoms
  };
  var lists = Object.keys(type);
  for(var i = 0; i < lists.length; i++) {
    if(type[lists[i]]) {
      return lists[i];
    }
  }
}
Error statistics
window.onload = function () {
        window.logInfo.allloadTime = +new Date() - window.logInfo.openTime;
        window.logInfo.nowTime = new Date().getTime();
        var timname = {
            whiteScreenTime: 'White screen time',
            readyTime: 'User Operational Time',
            allloadTime: 'Total download time',
            mobile: 'Use equipment',
            nowTime: 'time',
        };
        var logStr = '';
        for (var i in timname) {
            console.warn(timname[i] + ':' + window.logInfo[i] + 'ms');
            if (i === 'mobile') {
                logStr += '&' + i + '=' + window.logInfo[i];
            } else {
                logStr += '&' + i + '=' + window.logInfo[i];
            }

        }
        (new Image()).src = '/action?' + logStr;
    };

    var defaults = {
        msg:'',  // Specific information about errors
        url:'',  // url where the error is located
        line:'', // The line where the error is located
        col:'',  // Column where the error is located
        nowTime: '',// time
    };
    window.onerror = function(msg,url,line,col,error) {
        col = col || (window.event && window.event.errorCharacter) || 0;

        defaults.url = url;
        defaults.line = line;
        defaults.col =  col;
        defaults.nowTime = new Date().getTime();

        if (error && error.stack){
            // If the browser has stack information, use it directly
            defaults.msg = error.stack.toString();

        }else if (arguments.callee){
            // Trying to get stack information through callee
            var ext = [];
            var fn = arguments.callee.caller;
            var floor = 3;
            while (fn && (--floor>0)) {
                ext.push(fn.toString());
                if (fn  === fn.caller) {
                    break;
                }
                fn = fn.caller;
            }
            ext = ext.join(",");
            defaults.msg = error.stack.toString();
        }
        var str = ''
        for(var i in defaults) {
            // console.log(i,defaults[i]);
            if(defaults[i] === null || defaults[i] === undefined) {
                defaults[i] = 'null';
            }
            str += '&'+ i + '=' + defaults[i].toString();
        }
        srt = str.replace('&', '').replace('\n','').replace(/\s/g, '');
        (new Image()).src = '/error?' + srt;
    }
The above is all about collecting data, which can be customized by sending / action requests or / error requests. I'm just talking about how the whole process is implemented.
Then through one of my back-end express.js, all requests are processed and recorded, and the recorded data is like this.
user_ip=127.0.0.1&whiteScreenTime=185&readyTime=192&allloadTime=208&mobile=webKit&nowTime=1513071388941data processing
Here I am through a script written by myself to parse, parse.js, there is no specific explanation, just look at the source code. I'll show you the parsed data.
I store it in cvs data format because I also support json format export for the need of the chart, but later you need to configure the visual interface yourself.
The data is like this.
charts/csvData/2017-12-16time.csv
Time, white screen time, user operating time, total download time
1513427051482,137,137,153
1513427065080,470,471,507
1513427080040,127,127,143
1513428714345,274,275,323
1513428733583,267,268,317
1513428743167,268,268,317
1513428754796,276,276,328
Data display
Here I use highcharts.js
Specific configuration I do not explain, you can go to the official website to view.
The following is a visualized chart showing information at various times of the day.
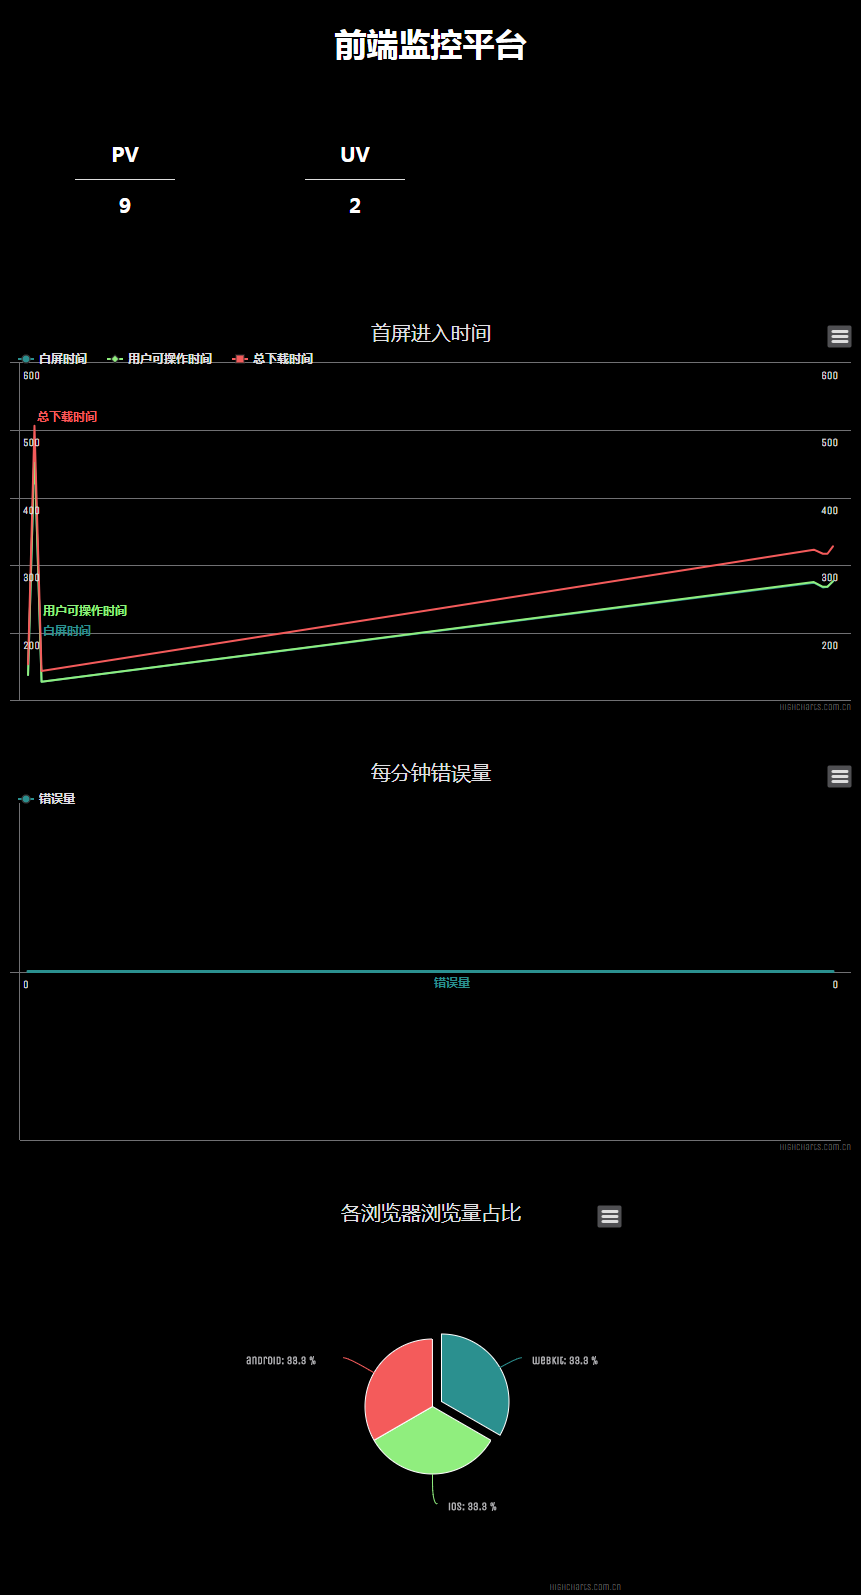
The interface may not be particularly beautiful, please forgive me.

Environmental Science
node >= 6.0.0
redis >= 2.6.0
I'll explain here, because if this is deployed on-line environment, if every record is recorded, it will consume a lot of memory, so I set up a redis layer, in order to prevent the impact of large traffic, and then it can be stored every other time.
const express = require('express');
const performance = require('./lib/performance.js');
const app = express();
const router = express.Router();
router.get('/', function (req, res, next) {
  req.url = './index.html';
  next();
});
app.use(router);
app.use(performance({
    time: 10, // Seconds per unit
    originalDir: './originalData', // Catalogue of data
    errorDir: './errorData' // Catalogue of Errors
}))
app.use(express.static('./'));
const server = app.listen(3000)
Here you can set the default time, I here in 10 seconds, for demo effect. Usually I use one minute for storage.
github address: https://github.com/hua1995116/mcharts
If you have good suggestions and optimized solutions, please also mention them to me on Issues. If you like, you can order a star.
Advancement (a real-life tremor using monitoring platforms)
I used this platform to monitor one of my projects. If you are just playing, please read only the original address above, you can ignore this section of me, after all, my system is not perfect enough.
Project Online Address: http://www.qiufengh.com/#/
Project monitoring address: http://qiufengh.com:8080/
Code address of this project: https://github.com/hua1995116/webchat/tree/monitoring
Here I set up a log every minute.
// Monitoring introduction
app.use(performance({
    time: 60, // Seconds per unit
    originalDir: './originalData', // Catalogue of data
    errorDir: './errorData' // Catalogue of Errors
}))
And parsing every 10 minutes.
function setPrase() {
    setInterval(function(){
        parseData();
      }, 1000 * 60 * 10);
}
Links to the original text: http://yifenghua.win/html/2017-12-16.html (Better reading experience)