In the twinkling of an eye, 2021 has passed, and many app s have launched annual summaries. This time, by using the third-party library pyecharts in Python to draw calendar charts and line charts, we can visually display the motion data in 2021.
1, Preparatory work
1. Environment
In addition to the necessary Python 3 X environment also needs to install a third-party library: pyecharts
pip install pyecharts
2. Data
This time, the real millet motion data is used, and the millet motion data needs to be exported manually. I sorted out a data export process for reference.
1. Enter Xiaomi sports, click [my], and click [settings]
2. Select [account and security]
3. Click [account cancellation] below
4. Select export data, and then click OK
5. Select [data] and [date] to export
6. Enter the email address and verification code, and the export is successful
7. Enter the email and click the link
8. Enter the password and download the data
9. Unzip the package and view the data
what? Can't you understand the text version? I also prepared a picture version


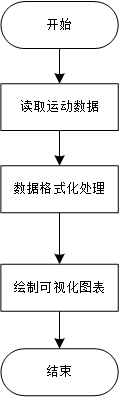
2, Train of thought
Overall thinking
3, Effect display
raw data
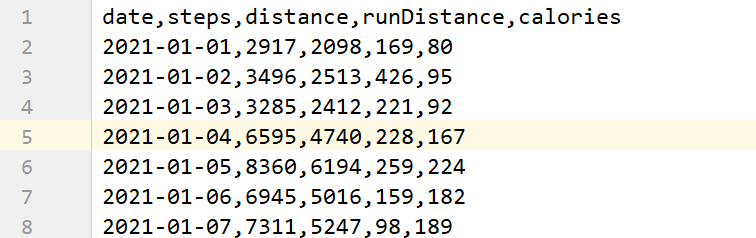
The original data format is csv format. Each data is separated by commas. The data is divided into five columns: date, steps, walking distance, exercise distance and calorie consumption.
1. Statistics of millet movement steps in 2021 - Calendar chart
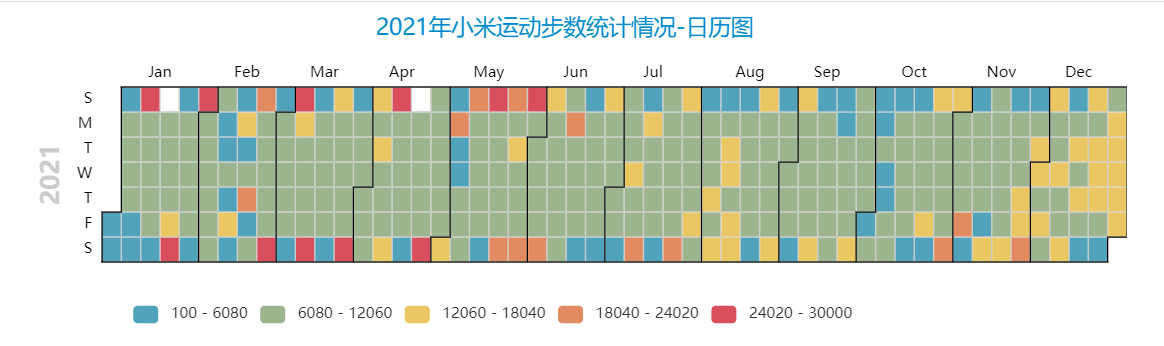
The calendar chart can intuitively show the movement of each day, and the data of the corresponding interval can be filtered by setting appropriate legends.
2. Statistics of walking distance of Xiaomi sports in 2021 - Calendar chart
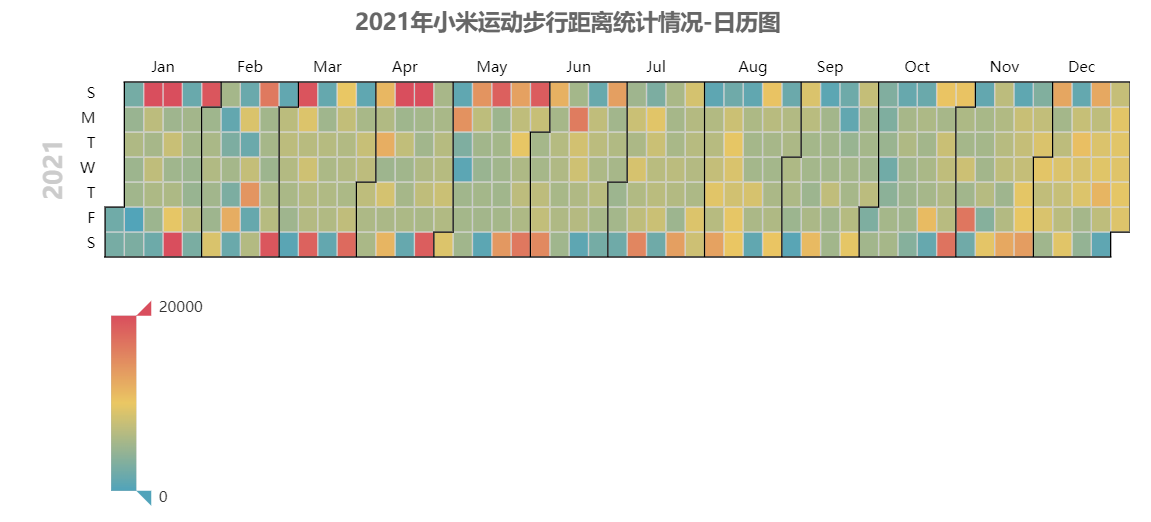
Using the visual mapping configuration item, you can more accurately filter out the data in the specified interval.
3. Statistics of Xiaomi exercise calorie consumption in 2021 - Calendar chart
Here's a gif demo.
4. Statistics of Xiaomi sports data in 2021 - broken line chart
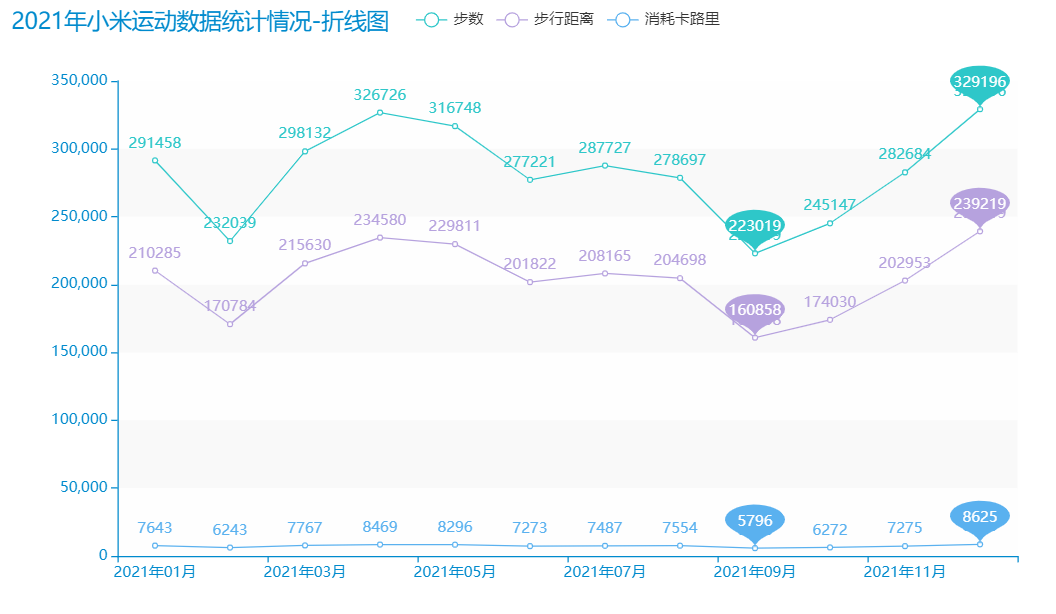
This line chart counts the monthly steps, walking distance and calorie consumption by month. It can be seen that the three data are in direct proportion, of which the amount of exercise is less in September and the most in December.
4, Source code
runner_data_analysis.py (motion data analysis)
from pyecharts import options as opts
from pyecharts.charts import Calendar,Line
from pyecharts.globals import ThemeType

"""
Get my motion data from csv Read in, use calendar chart to display daily steps, and use line chart to display multiple data
"""
class Sport_Data_Analysis:
    def __init__(self):
        self.csv_file="./my_data.csv"

    def read_csv(self):
        with open(self.csv_file,'r',encoding="utf-8-sig") as f:
            data=f.readlines()
            return data

    def data_format(self,src_data):
        """
        Yes, read in csv Organize the data,
        :param src_data:
        :return:
        """
        data_list=[]
        for line in src_data:
            item={}
            item['date']=line.split(",")[0]
            item['steps']=line.split(",")[1]
            item['distance']=line.split(",")[2]
            item['calories']=line.split(",")[-1].rstrip()
            data_list.append(item)
        return data_list

    def draw_steps_calendar(self,data):
        """
        Draw calendar chart
        # The label content formatter supports two forms: String template and callback function. The string returned by string template and callback function supports line wrapping.
        # String template variables are:
        # {a} : series name.
        # {b} : data name.
        # {c} : data value.
        :param data:
        :param type_:
        :return:
        """
        c = (
            Calendar(opts.InitOpts(
                page_title=f"2021 Statistics of millet movement steps in-Calendar chart",  # Page title
                theme=ThemeType.MACARONS,  # Use your own theme

            ))
                .add("", data, calendar_opts=opts.CalendarOpts(range_="2021")  # Select the calendar chart to display the year 2021
                     )
                .set_global_opts(
                title_opts=opts.TitleOpts(title=f"2021 Statistics of millet movement steps in-Calendar chart",pos_left='center'),  # Chart title
                tooltip_opts=opts.TooltipOpts(is_show=True, axis_pointer_type="cross", trigger="item",
                                              formatter="{c}step"),
                visualmap_opts=opts.VisualMapOpts(
                    max_=30000,
                    min_=100,
                    orient="horizontal",
                    is_piecewise=True,
                    pos_top="230px",
                    pos_left="100px",
                ),
            ).render(f"2021 Statistics of millet movement steps in-Calendar chart.html")
        )

    def draw_calories_calendar(self,data,type_,max_,unit):
        c = (
            Calendar(opts.InitOpts(
                page_title=f"2021 Millet movement in{type_}Statistics-Calendar chart",  # Page title
                theme=ThemeType.WALDEN,  # Use your own theme

            ))
                .add("", data, calendar_opts=opts.CalendarOpts(range_="2021")  # Select the calendar chart to display the year 2021
                     )
                .set_global_opts(
                title_opts=opts.TitleOpts(title=f"2021 Millet movement in{type_}Statistics-Calendar chart",pos_left='center'),  # Chart title
                tooltip_opts=opts.TooltipOpts(is_show=True, axis_pointer_type="cross", trigger="item",
                                              formatter="{c}"+unit),
                visualmap_opts=opts.VisualMapOpts(
                    max_=max_,
                    min_=0,
                    orient="vertical",
                    is_piecewise=False,
                    pos_top="230px",
                    pos_left="80px",
                ),
            ).render(f"2021 Millet movement in{type_}Statistics-Calendar chart.html")
        )

    def get_fmt_data(self,data):
        """
        Count the number of steps, walking distance and calories consumed by month
        :param data:
        :return:
        """
        data_item={}
        steps_item = {}
        calories_item = {}
        miles_item = {}
        for d in data:
            date=d["date"]
            steps=d['steps']
            distance=d['distance']
            calories=d['calories']
            month=date.split('-')[1]
            if "2021 year" + month +"month"  in steps_item.keys():
                steps_item["2021 year" + month +"month"]+=int(steps)
            else:
                steps_item["2021 year" + month +"month"]=0
            if "2021 year" + month +"month"in miles_item.keys():
                miles_item["2021 year" + month +"month"] += int(distance)
            else:
                miles_item["2021 year" + month +"month"] = 0
            if "2021 year" + month +"month" in calories_item.keys():
                calories_item["2021 year" + month +"month"] += int(calories)
            else:
                calories_item["2021 year" + month +"month"] = 0
        data_item['steps_item']=steps_item
        data_item['miles_item']=miles_item
        data_item['calories_item']=calories_item
        return data_item

    def draw_line(self,data):
        step_x_data=list(data['steps_item'].keys())
        step_y_data=list(data['steps_item'].values())
        mile_y_data=list(data['miles_item'].values())
        calorie_y_data=list(data['calories_item'].values())
        l = (
            Line(opts.InitOpts(
                page_title=f"2021 Statistics of Xiaomi sports data in-Line chart.html",theme=ThemeType.MACARONS,))
                .add_xaxis(xaxis_data=step_x_data)
                .add_yaxis(
                "Number of steps",
                y_axis=step_y_data,
                markpoint_opts=opts.MarkPointOpts(data=[opts.MarkPointItem(type_="max",symbol_size =[80,40]),opts.MarkPointItem(type_="min",symbol_size =[80,40])]),
                tooltip_opts=opts.TooltipOpts(is_show=True, axis_pointer_type="cross", trigger="item",
                                              formatter="{a}<br>{c}step" ),
            )
                .add_yaxis(
                f"Walking distance",
                y_axis=mile_y_data,
                markpoint_opts=opts.MarkPointOpts(
                    data=[opts.MarkPointItem(type_="max",symbol_size =[80,40]), opts.MarkPointItem(type_="min",symbol_size =[80,40])]),
                tooltip_opts=opts.TooltipOpts(is_show=True, axis_pointer_type="cross", trigger="item",
                                              formatter="{a}<br>{c}rice" ),

            ).add_yaxis(
                f"Burn calories",
                y_axis=calorie_y_data,
                markpoint_opts=opts.MarkPointOpts(data=[opts.MarkPointItem(type_="max",symbol_size =[80,40]),opts.MarkPointItem(type_="min",symbol_size =[80,40])]),
                tooltip_opts=opts.TooltipOpts(is_show=True, axis_pointer_type="cross", trigger="item",
                                              formatter="{a}<br>{c}Kilocalorie"),
            )
                .set_global_opts(title_opts=opts.TitleOpts(title=f"2021 Statistics of Xiaomi sports data in-Line chart"))
                .render(f"2021 Statistics of Xiaomi sports data in-Line chart.html")
        )

if __name__ == '__main__':
    sport=Sport_Data_Analysis()
    data=sport.read_csv()
    data_list=sport.data_format(data[1:])#Remove field name
    steps_data=[[s["date"],s["steps"]] for s in data_list]
    sport.draw_steps_calendar(steps_data)
    calories_data=[[s["date"],s["calories"]] for s in data_list]
    sport.draw_calories_calendar(calories_data,"Calorie consumption",800,'Kilocalorie')
    miles_data=[[s["date"],s["distance"]] for s in data_list]
    sport.draw_calories_calendar(miles_data,"Walking distance",20000,'rice')
    line_data_item=sport.get_fmt_data(data_list)
    sport.draw_line(line_data_item)
5, Summary
This time, we used pyecarts to draw several ecarts diagrams, which visually displayed my 2021 steps, movement distance, energy consumption and other data. The display results were in line with expectations, in line with normal exercise habits, and the amount of code was not large. If you like these echarts, you can go to LAN Zuoyun Download. What are the deficiencies in ideas and codes? You are welcome to correct and criticize! I think it's OK. I can praise it.