Recently, the author learned some common sense related to "driving" and found that if the driver's driver's license expires, he must submit physical examination information before applying for license renewal, which requires the driver to go to a nearby hospital for physical examination.
Considering that not all hospitals support driver physical examination, drivers need to know which hospitals are "effective" in advance.
Taking Beijing as an example, this note attempts to help drivers find the nearest one in each "effective" hospital for physical examination, and visualize the relative distance between each hospital and the driver.
catalogue
Part 1: data preprocessing and analysis
Step 1: query latitude and longitude
Step 2: calculate relative distance
Part 2: data visualization and analysis
Part 1: data preprocessing and analysis
Click to jump to the target website: Information of Beijing driver physical examination hospital in 2021
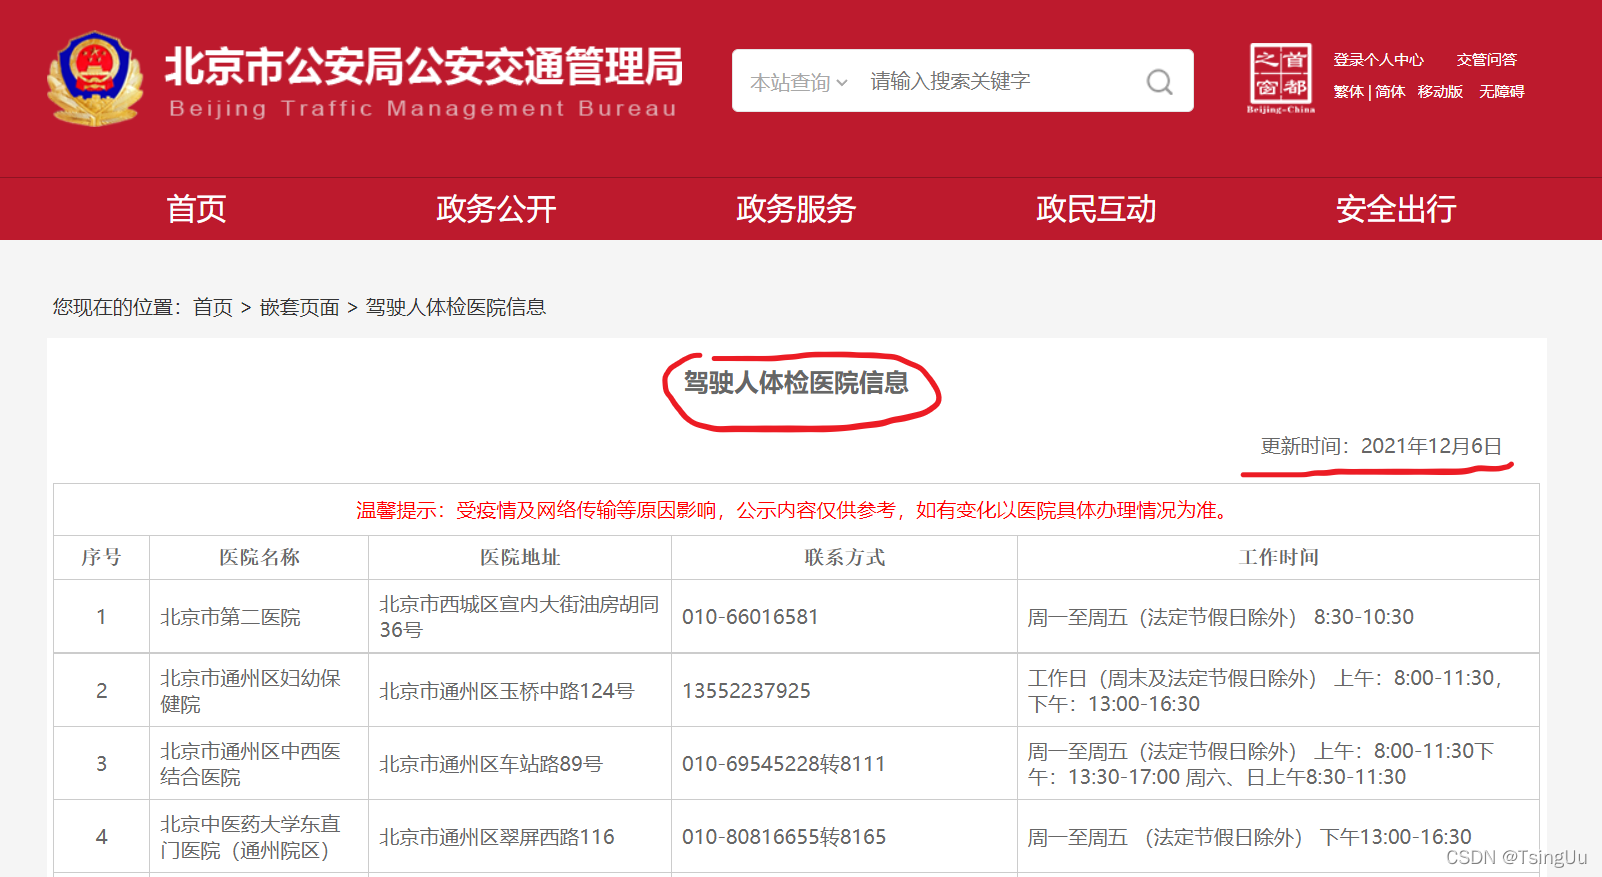
In the web page above, the traffic management bureau provides 223 hospital addresses, relevant contact information, working hours and other information, which are very detailed. But if we want to know which hospital is closest to the driver, we must "quantitative analysis", that is, calculation.
To calculate the distance, we must know the calculation principle or formula and have the parameters required for calculation. I think since the amount to be calculated is the distance between two points on the map, it is bound to be related to the longitude and latitude of each location. Therefore, we must query the longitude and latitude of each hospital.
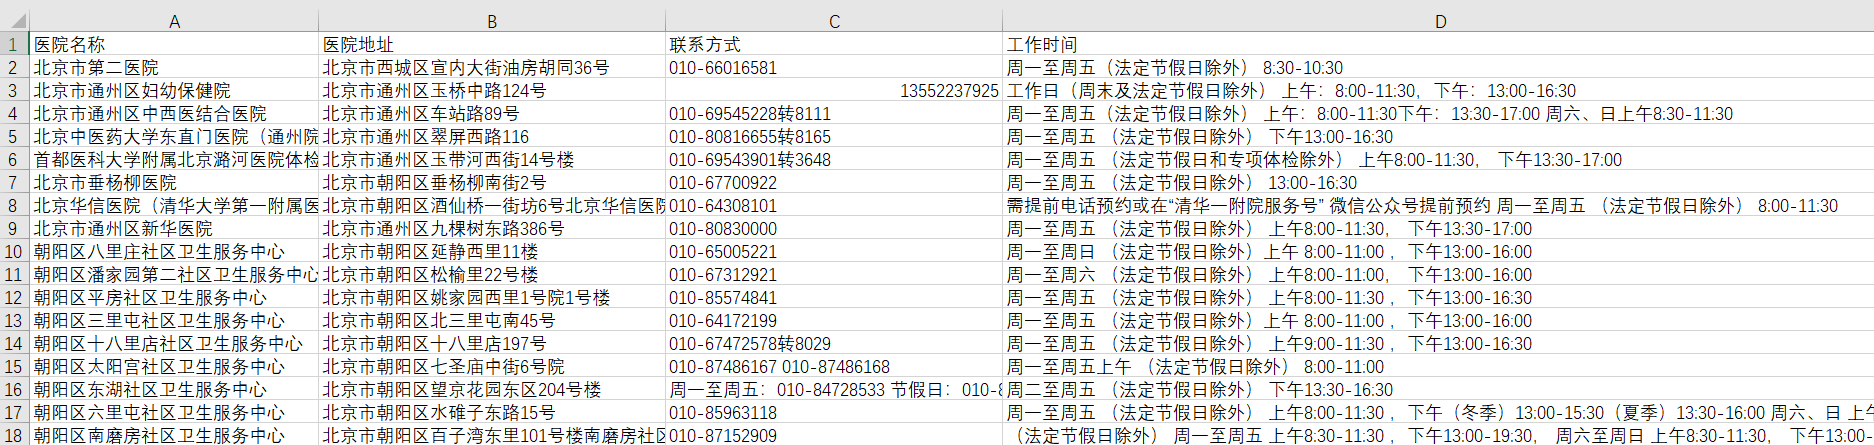
Of course, before starting all the above work, we must first store the basic information of these 223 hospitals in csv format table, which is convenient for us to use data structurally.
Here I think of two ways: one is to copy all the information directly from the web page and paste it into csv table; The other is to store the target data after parsing the web page through web crawler csv table.
Personally, I think the second method is more universal, because when the amount of information is huge (big data), if we copy and paste again, "the amount of work" is too large, but we get half the result with twice the effort.
However, as long as you try, you will find that this website is not so easy to crawl, and the network security measures of the Traffic Management Bureau are still good. Therefore, the crawling process will involve Reverse Engineering (decryption and encryption), which is certainly not the focus of our work this time. Moreover, the total amount of data is small, so we can copy and paste directly!
The form file might as well be named: Beijing driver physical examination hospital information csv
Step 1: query latitude and longitude
Since longitude and latitude involve the location information of a certain place on the map, it is necessary to use "navigation satellite".
Of course, we certainly can't control the satellite, so we need to help "Baidu map" and apply for a free API for developer operation.
Baidu map open platform It can help us query longitude and latitude (create an access application in the "console", that is, AK, and get the access key).

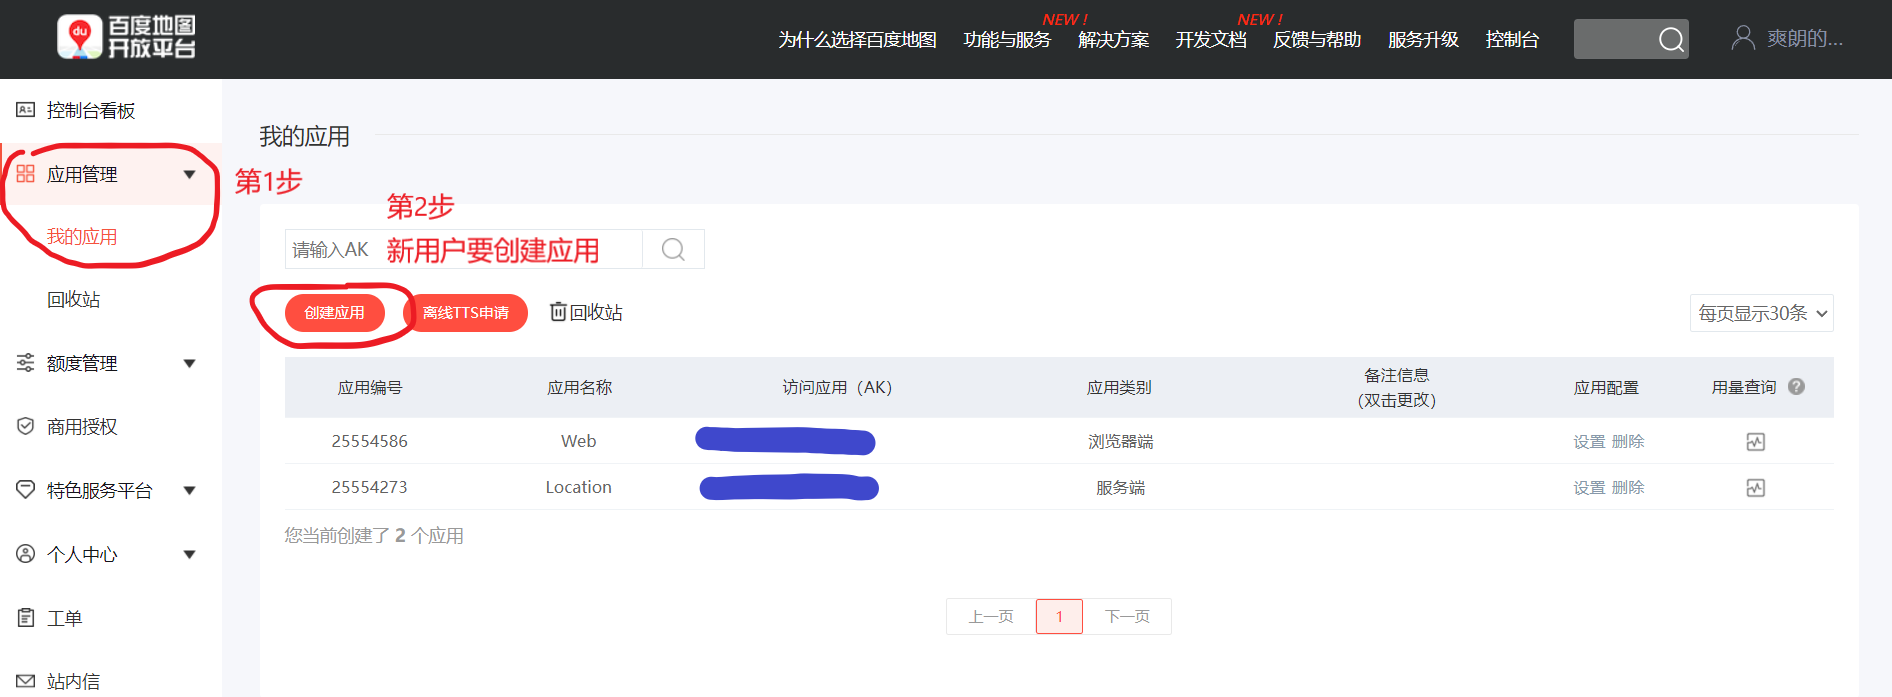
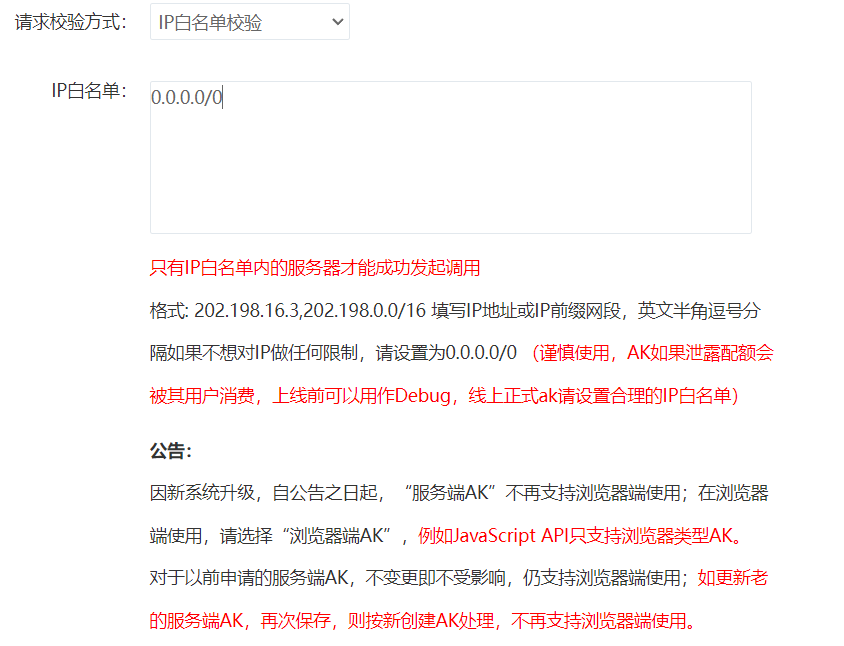
There are relevant options in the "create application" interface. Select the appropriate options according to your needs. This note involves two: server side and browser side.
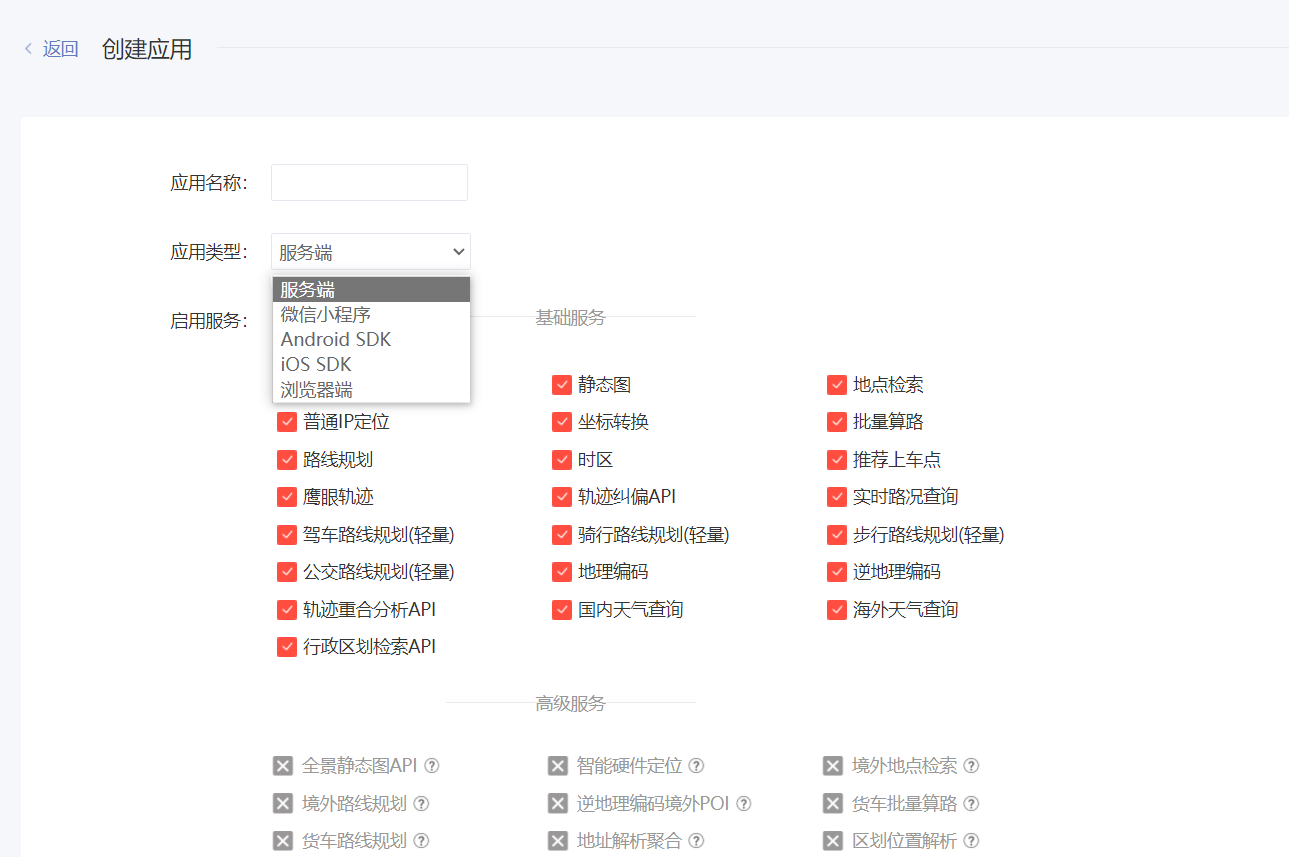
There is a configuration item "IP whitelist" under "create application". Generally, if it is only for learning, the server side is set to 0.0.0.0/0 and the browser side is set to *.
AK can be obtained after successful creation. We need it when querying longitude and latitude.
# Import related libraries
import requests
import json

# Define get_ The ll() function obtains the longitude and latitude of the target location
def get_ll(x):
    url = f"http://api. map. baidu. com/geocoding/v3/? Address = {x} & output = JSON & AK = fill in your own AK & callback = showlocation here“
    Post_data = {'address': x}
    se = requests.session()
    Text = se.post(url, data=Post_data).text.replace("'", '"').replace('/ ', '/')[27:-1]
    jsonValue = json.loads(Text)
    if('result' in jsonValue):
        return [jsonValue['result']['location']['lng'], jsonValue['result']['location']['lat']]
    else:
        return ' '
Let's check the correctness of this function. The test idea is as follows: we input the parameter "Beijing University of Posts and Telecommunications" to the function to check whether the obtained longitude and latitude are roughly equivalent to those on the map (because there may be more than one place with the same name on the map).
The operation result of the function is as follows:

It can be seen that the longitude and latitude (coordinates) of Beijing University of Posts and telecommunications are: [116.36471727747563, 39.96538691453649]
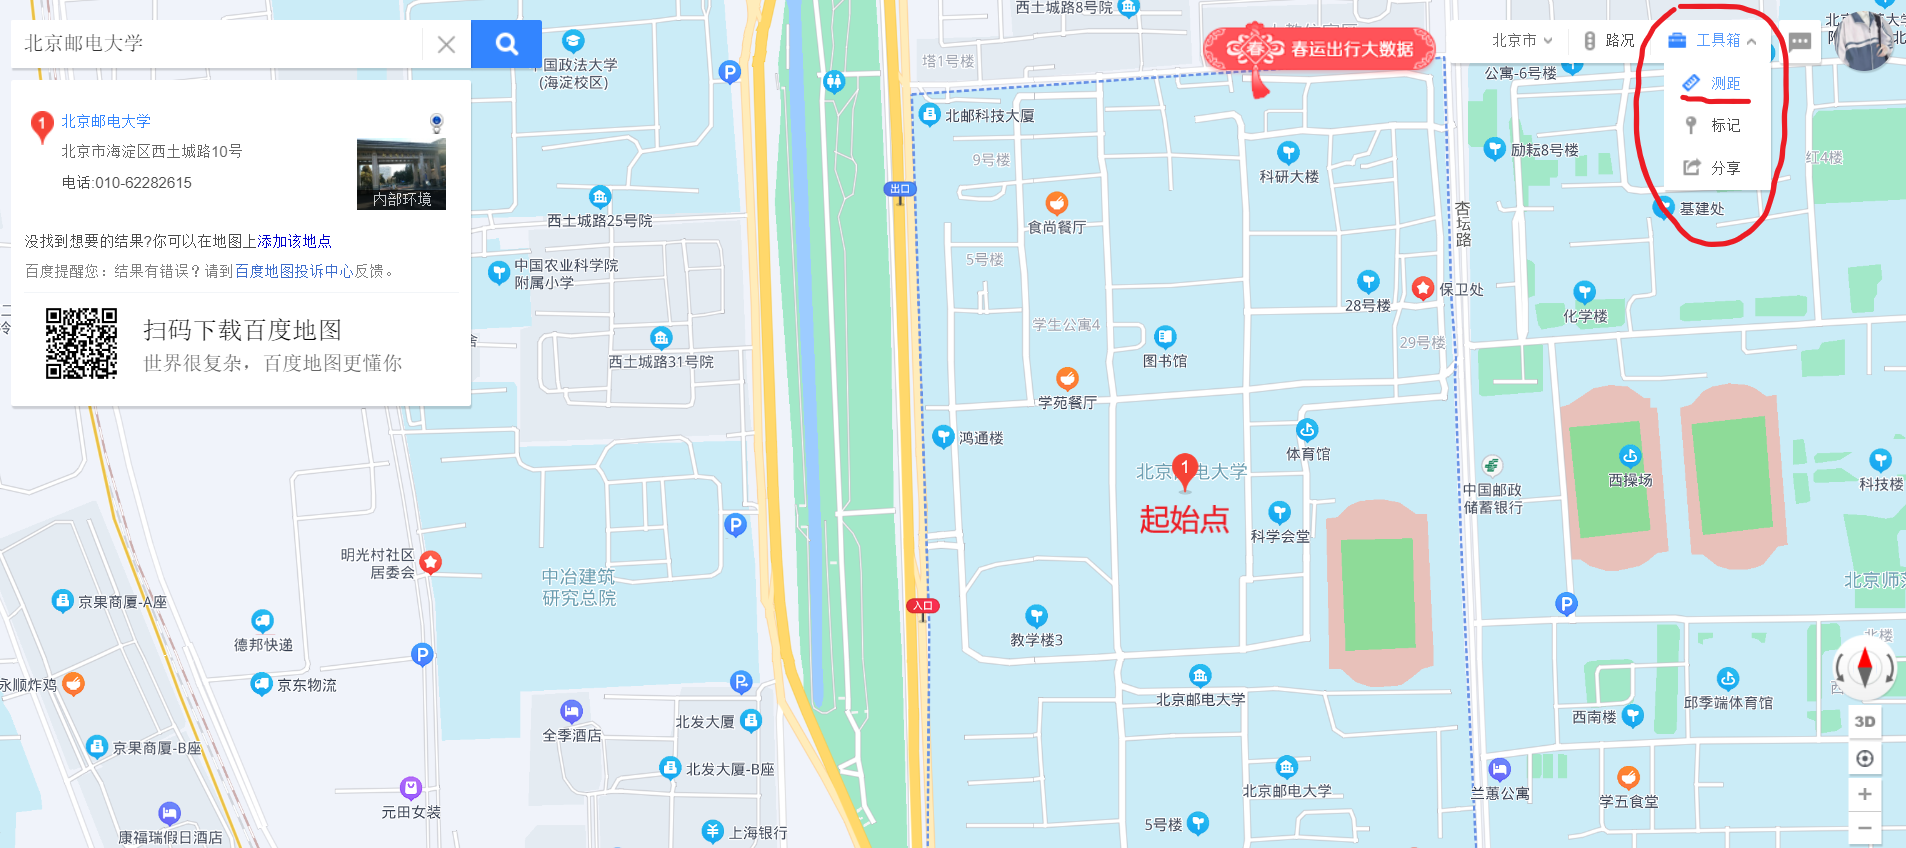
Test the correctness of longitude and latitude of Beijing University of Posts and Telecommunications: open Baidu map picking coordinate system , turn on the coordinate inverse search, input the obtained longitude and latitude, and find that it is indeed Beijing University of Posts and telecommunications.
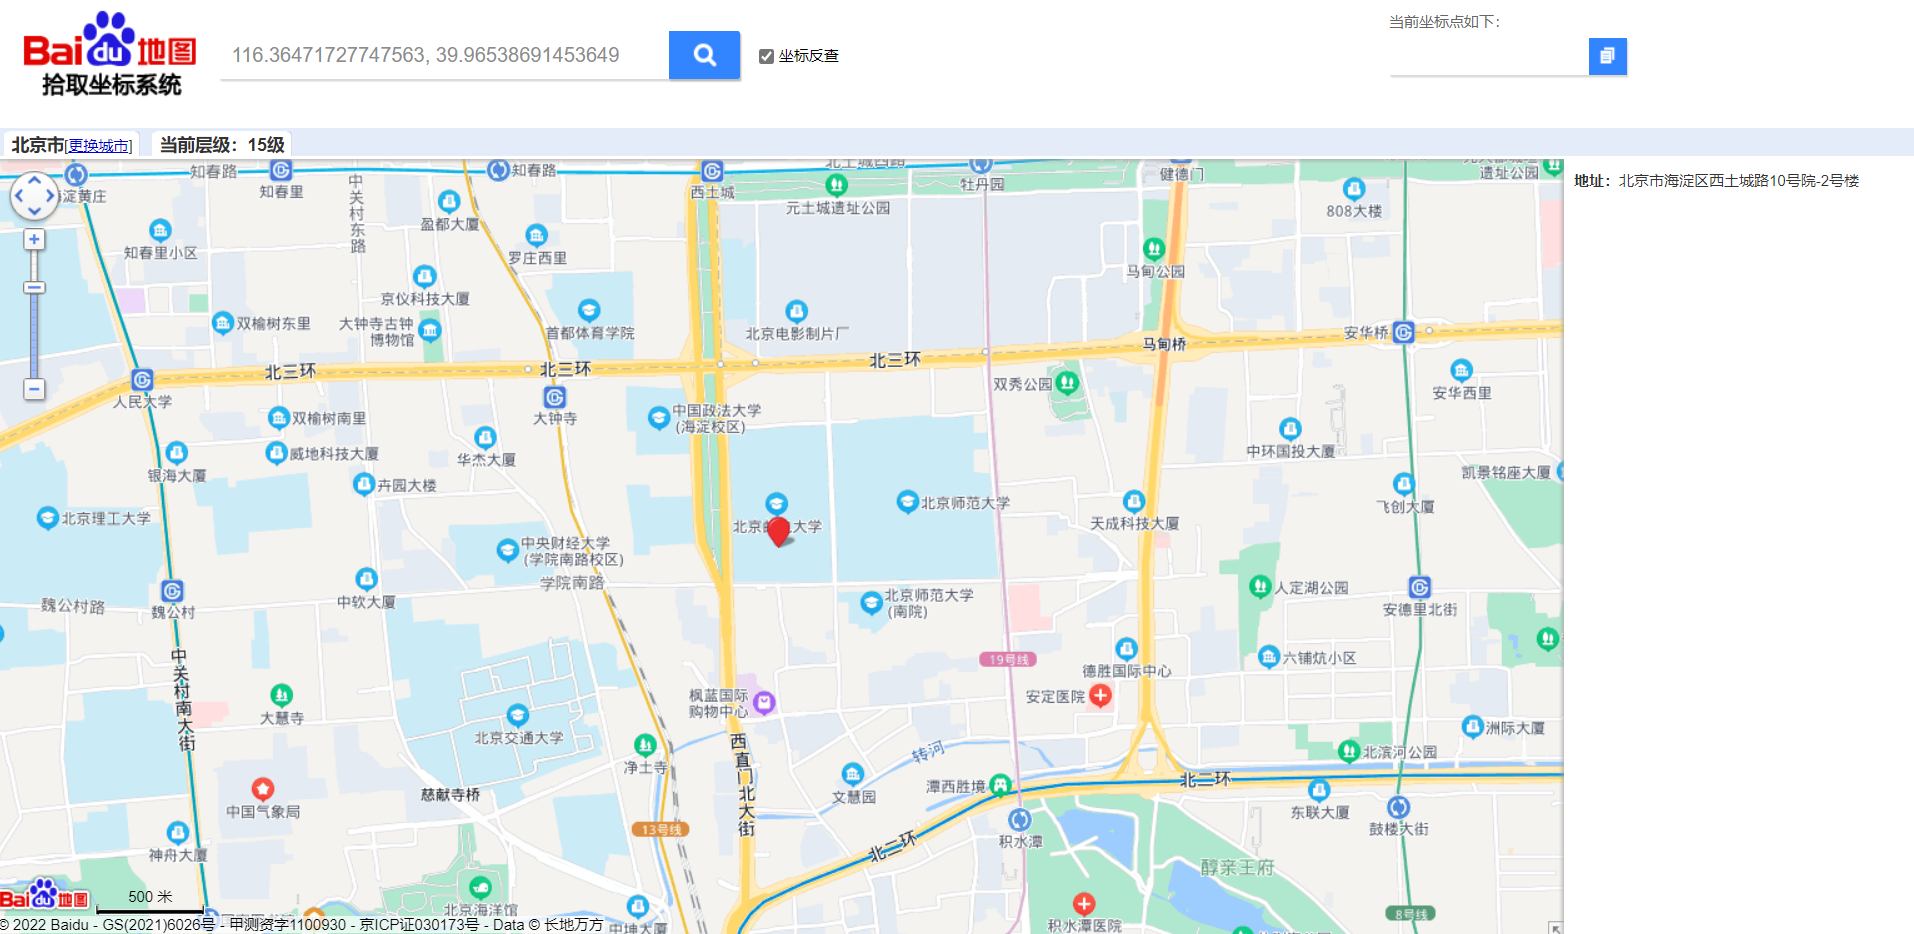
😀 Facts have proved that the coordinate longitude and latitude are basically the same, and our program has no problem.
Before we officially start to calculate the relative distance, we need to calculate the relative distance according to get_ The LL () function obtains the longitude and latitude of 223 hospitals respectively. At this time, you may ask, do I have to "enter" the hospital name into the function one by one?
Logically speaking, it is, but considering the large number of hospitals and the long names of some hospitals, it will be very tiring.
In fact, we can let the computer help us complete this mechanically repeated behavior.
Some students who have studied C language may be eager to try now, because it is easy to solve this problem. A circular statement can be done. However, from the perspective of the beauty of the code and the simplicity of the algorithm, it seems that programmers are "stupid".
At this time, it can be reflected that we organize the data into The advantages of csv tables. Considering Python's unique "index slicing" function, the problem becomes very simple if these data are uniformly structured and encapsulated.
This is much like taking fat house happy water from the refrigerator. You can take one soda, that is, close the refrigerator door once, and repeat it 223 times. Naturally, you can also think about the 223 bottles of soda to take first, then take them out at one time, and then close the refrigerator door. With "index slice", we can "take multiple at a time"!
Realize the unified processing of structured data in the table, and we can import it Pandas Library, which is one of the most commonly used third-party libraries for data analysis.
Then start the following operations ↓
# Import pandas Library
import pandas as pd
# Read table information
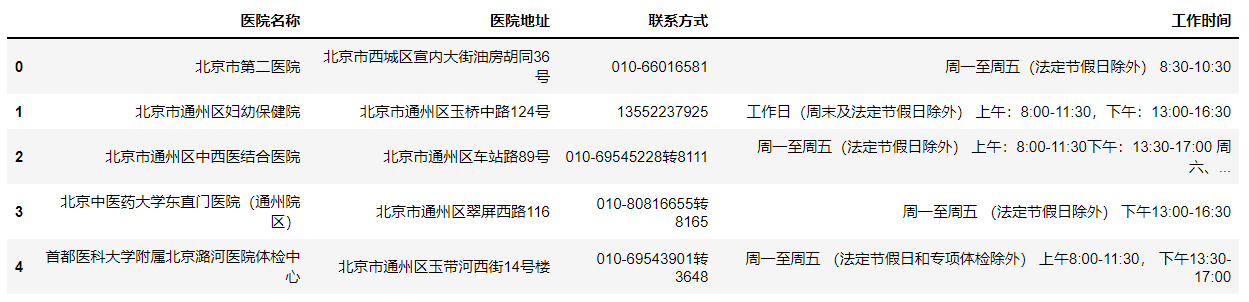
df = pd.read_csv("Beijing driver physical examination hospital information.csv")
# View field information
df.head()The output results are as follows:
"Normalization" processing:
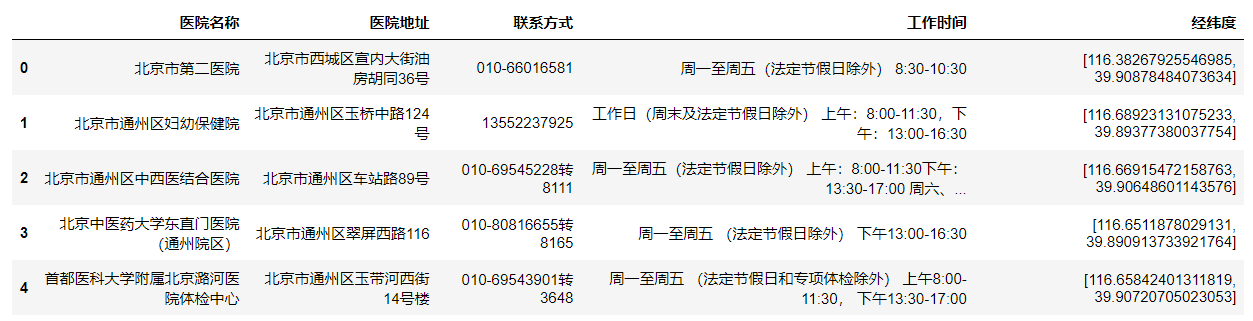
# Apply the information of the "hospital address" field to get respectively_ Ll() function, get the information of the new field "longitude and latitude" and write it to df
# The initial operation takes about 20 s
df["Longitude and latitude"] = df["Hospital address"].apply(get_ll)  # There is a "big pit" here: if the field name is typed with 'longitude and latitude' and 'hospital address' (single quotation mark), JSONDecodeError will be raised!
df.head()
The comments in the code snippet should be noticed, otherwise it will make you difficult. The operation results are as follows:
Step 2: calculate relative distance
How to calculate the distance between the two places through longitude and latitude information?
As we all know, the equatorial radius of the earth is 6378 kilometers, the polar radius is 6356 kilometers, and the average radius is 6371 kilometers, so it is not a perfect sphere.
But we don't want to get very accurate results here, just to facilitate the driver's decision-making, so as long as we simplify the earth into a sphere, we can use mathematical formulas to calculate the approximate distance between the two places.
The question is, what does this mathematical formula look like?
Through searching, I found a very old but simple method—— Semi positive vector formula (Haversine formula).
The specific mathematical derivation will not be repeated here.
Through the above operations, we have obtained the longitude and latitude corresponding to 223 hospitals. Next, we need to define a function to calculate the relative distance. Similarly, we first calculate the relative distance between the preset two points.
In the code below, we preset the coordinates of two locations: "Beijing University of Posts and Telecommunications" and "National Palace Museum".
# Import math library to facilitate mathematical calculation
from math import radians, cos, sin, asin, sqrt

start, end = "Beijing University of Posts and Telecommunications", "the Palace Museum"
start_address, end_address = get_ll("Beijing University of Posts and Telecommunications"), get_ll("the Palace Museum")  # Get the longitude and latitude of "Beijing University of Posts and Telecommunications" (starting point) and "Palace Museum" (destination)

def get_address_distance(ll):
    lon1, lat1, lon2, lat2 = map(radians, [start_address[0],start_address[1],ll[0],ll[1]])
    # haversine formula
    dlon = lon2 - lon1  # Longitude difference
    dlat = lat2 - lat1  # Latitude difference
    # definition: θ =  d / r, where "distance radius ratio" θ” It is "theta", "connecting distance d between two points" is "dis", and "earth average radius r" is "rad"
    hav_theta = sin(dlat/2)**2 + cos(lat1) * cos(lat2) * sin(dlon/2)**2  # θ Seminormal vector of
    theta = 2 * asin(sqrt(hav_theta))  # θ
    rad = 6371  # r
    dis = round(theta * rad, 2)  # d
    return dis

ver = get_address_distance(end_address)  # Define the verification variable ver
print(""{}"And“{}"The relative distance between is:{}kilometre".format(start, end, ver))  # Format output
The output result is:
The relative distance between "Beijing University of Posts and Telecommunications" and "Palace Museum" is 5.65 kilometers
Similarly, here we also have a verification method.
Test the rationality of the relative distance between "Beijing University of Posts and Telecommunications" and "National Palace Museum": open Baidu map web version , the distance between the two places can be measured by using the "ranging function" in the "toolbox".
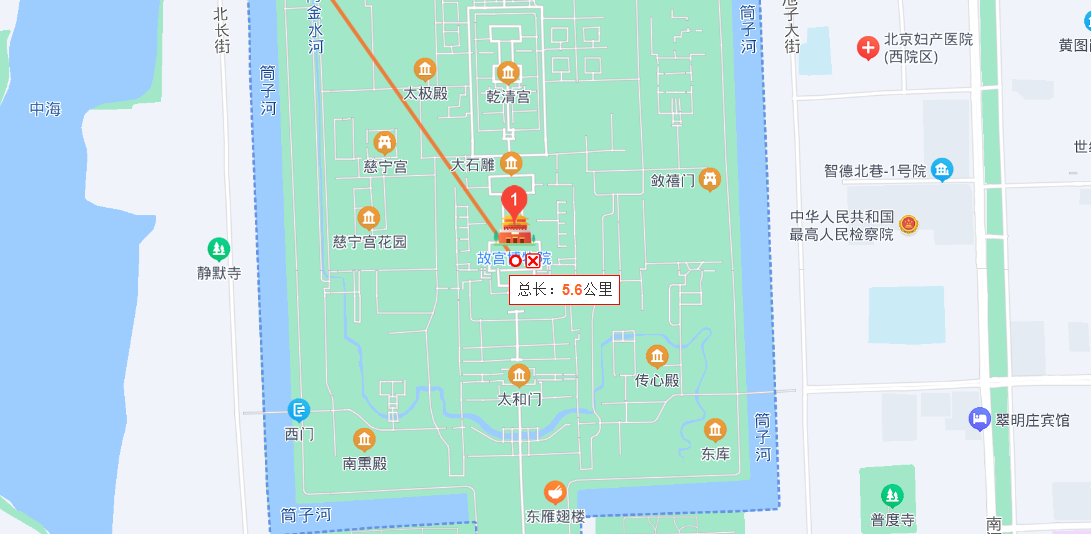
The result is: 5.6 km, which is only 50 meters away from our calculation result of 5.65 km.
😀 Facts have proved that the relative distance between two points is basically the same, and our program has no problem.
Then, the function defined above can be applied to calculate the relative distance between each hospital and the driver!
Let's suppose I'm the "old driver" who needs a physical examination to change his license 👴, Now I live in Beiyou, so I have the following operations ↓
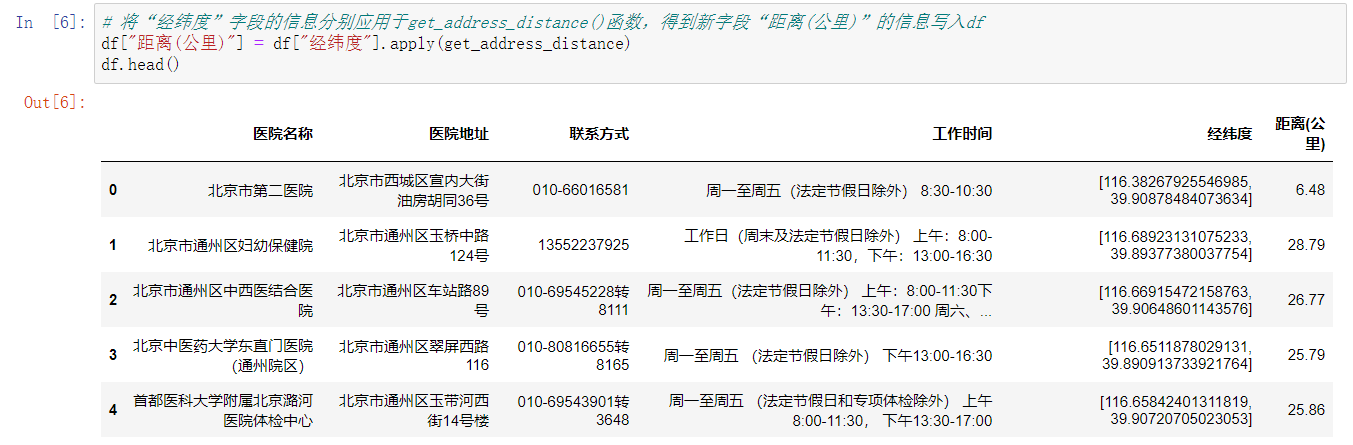
# Apply the information of the latitude and longitude field to get respectively_ address_ Distance() function, get the information of the new field "distance (km)" and write it to df
df["distance(kilometre)"] = df["Longitude and latitude"].apply(get_address_distance)
df.head()
Finally, the nearest hospital and its related information can be determined by sorting the data of df from small to large.
df.sort_values(by = ["distance(kilometre)"]).head()
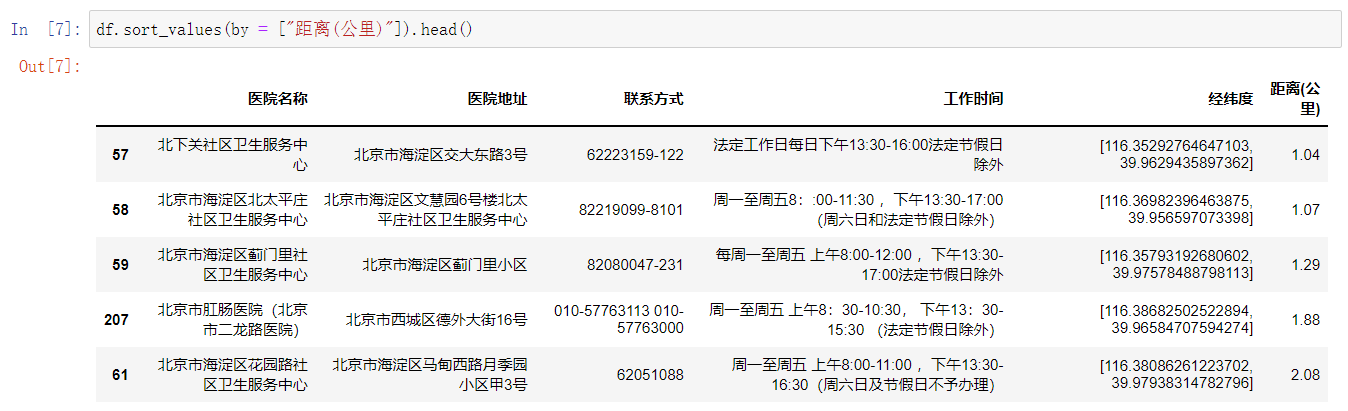
It can be seen from the above that the nearest driver physical examination hospital to me is "Beixiaguan community health service center", which is only 1.04 kilometers away. Of course, "Beitaipingzhuang community health service center, Haidian District, Beijing" is also very close to me, only 1.07 kilometers away.
In this regard, I can only say: 😋 As soon as the coin is tossed, the answer is known!
Part 2: data visualization and analysis
As an "old driver", I naturally don't want to stare at these data in the form. (is there a possibility 😏) Because I'm old, I have a hard time looking at these figures. I'm not careful 😂. At this time, we need to use images to more intuitively reflect how far 223 hospitals are from me.
Since the visualization file generated by Pyecharts supports interaction, the name and relative distance of the hospital will appear when the mouse moves to each passing point, so Pyecharts library is used for data visualization.
# To import relevant libraries, first use Geo visualization, which is characterized by "given coordinate points and clear visualization results"
import pyecharts
from pyecharts import options as opts
from pyecharts.charts import Geo
from pyecharts.globals import ThemeType
# Obtain coordinate point data for subsequent Geo visualization
data_pair = [(df.iloc[i]["Hospital name"], df.iloc[i]["distance(kilometre)"])
for i in range(len(df))]
# Initialize configuration Geo
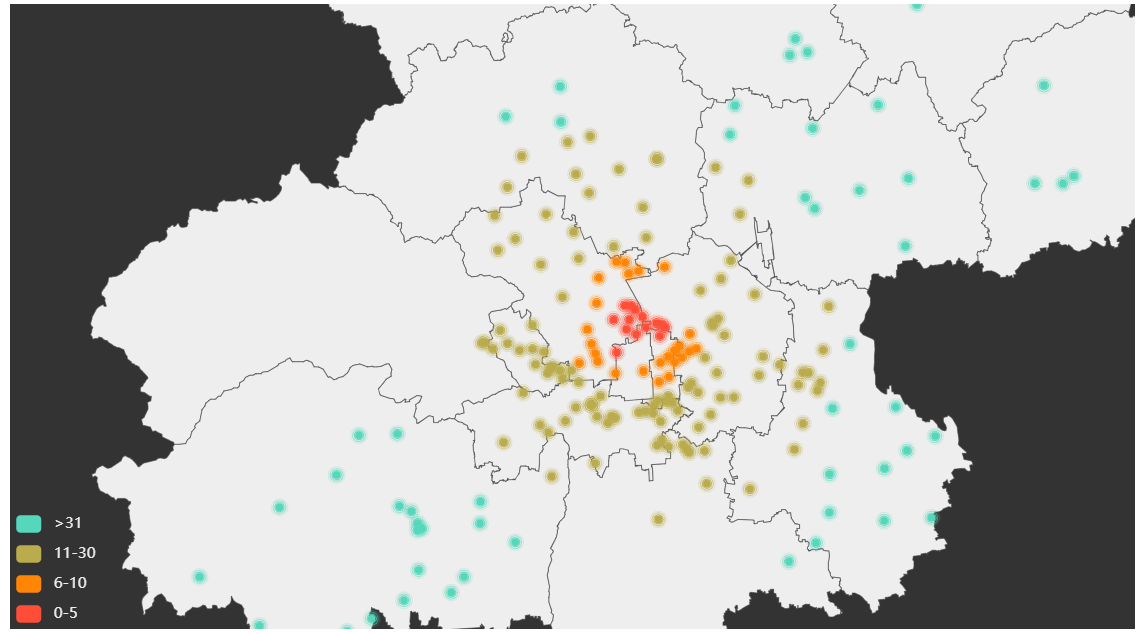
geo = Geo(init_opts=opts.InitOpts(theme=ThemeType.DARK))
geo.add_schema(maptype="Beijing") # Select the map of "Beijing"
# Get coordinate point data in json format
for idx, row in df.iterrows():
geo.add_coordinate(row["Hospital name"], row["Longitude and latitude"][0], row["Longitude and latitude"][1])
# Adding drawing elements to Geo images
geo.add('', data_pair, symbol_size=6,
itemstyle_opts=opts.ItemStyleOpts(color="blue")) # Font settings
geo.set_series_opts(label_opts=opts.LabelOpts(is_show=False), type="effectScatter") # Label settings
geo.set_global_opts(visualmap_opts=opts.VisualMapOpts(),
title_opts=opts.TitleOpts(title="Beijing driver physical examination hospital information")) # Title Setting
geo.set_global_opts(
visualmap_opts=opts.VisualMapOpts(max_=50,
is_piecewise=True,
pieces=[
{"max": 200, "min": 31,
"label": ">31", "color": "#54D7BA"},
{"max": 30, "min": 11,
"label": "11-30", "color": "#BAAB4C"},
{"max": 10, "min": 6, "label": "6-10",
"color": "#FF8605"},
{"max": 5, "min": 0, "label": "0-5",
"color": "#FF4E38"}
]
)) # Visual mapping key settings
geo.render_notebook() # The image is dynamically rendered in JupyterNotebook. Since BMap visualization will be used later, it will not be rendered to html fileIf your environment is not JupyterNotebook, you can use Geo render_ Replace notebook () with geo Render ("your file name. html"), so you can access a web page image through your browser.
The running results in JupyterNotebook are as follows:
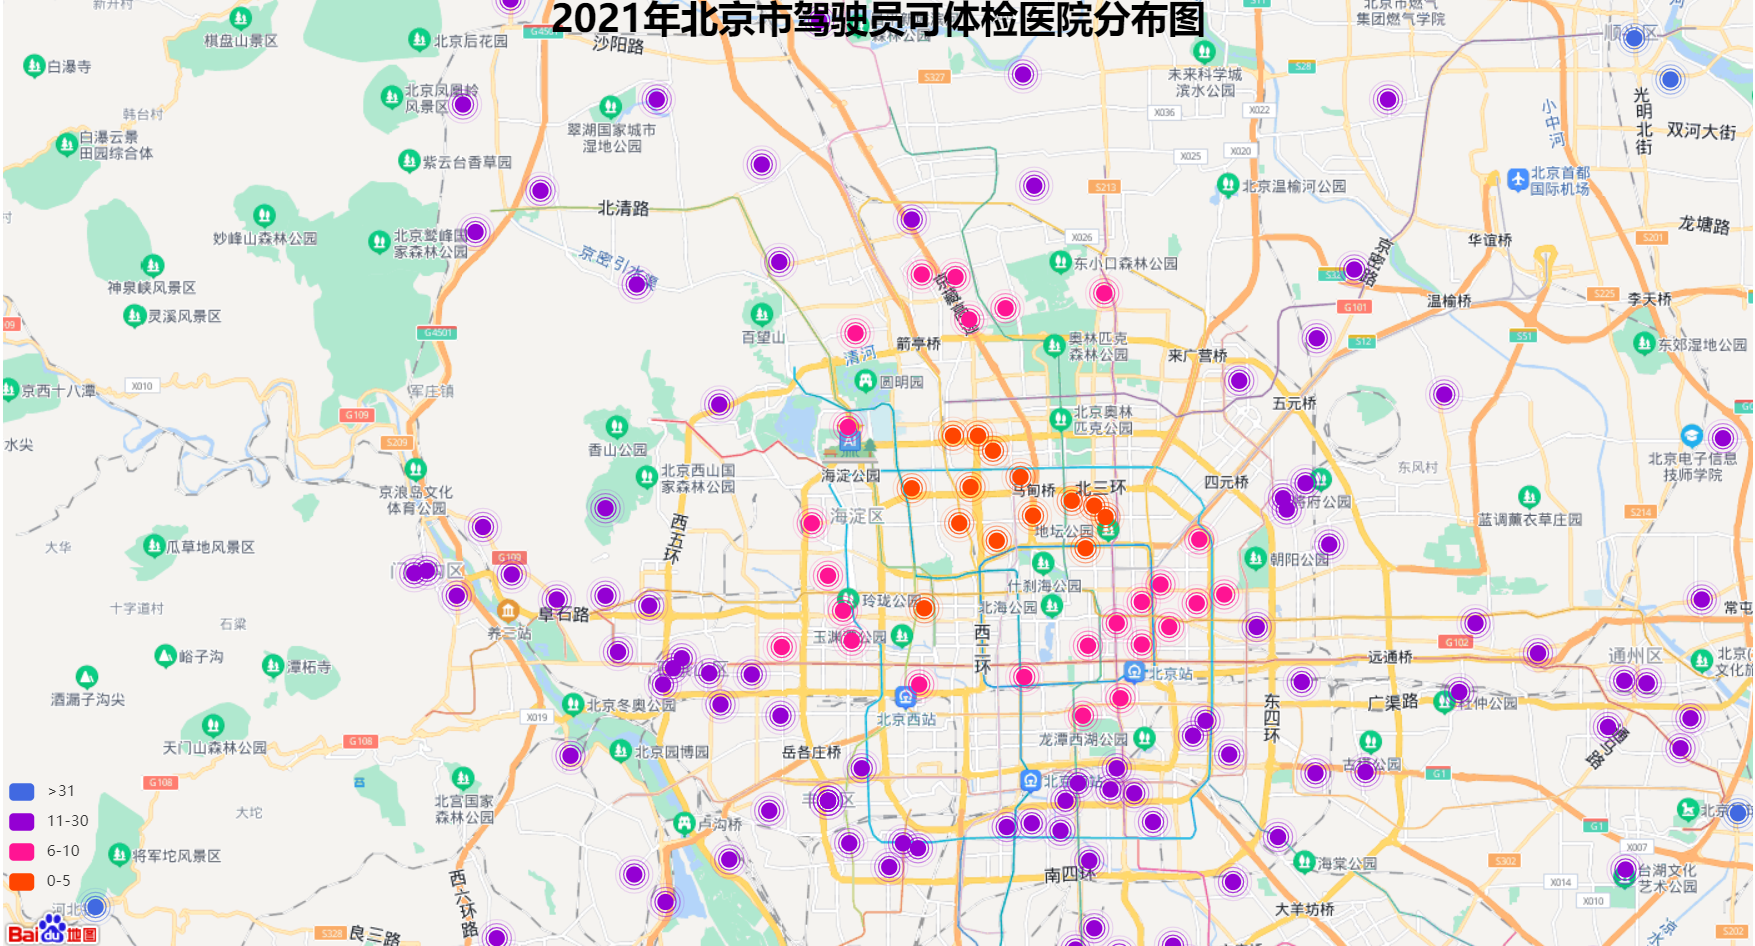
Of course, if you think this map style is not beautiful enough or the information above is not comprehensive enough, you can call Baidu map API and use BMap module under Pyecharts. Code examples are as follows:
# Baidu map BMap library is used for visualization. The visualization method is characterized by "comprehensive map information and better interactivity"
from pyecharts.charts import BMap

data_pair = [(df.iloc[i]["Hospital name"], df.iloc[i]["distance(kilometre)"])
             for i in range(len(df))]

# Initialize configuration BMap image
bmap = BMap(init_opts=opts.InitOpts(width="1400px", height="800px", page_title="2021 Distribution map of drivers' physical examination hospitals in Beijing in",))
bmap.add_schema(
        baidu_ak="npEaMRN8IPbvsWzjwaECRu2D0owHnex5",  # Own AK. Note that the type is "browser" instead of "server"
        center=get_ll("Beijing University of Posts and Telecommunications"),
        zoom=15,  # The smaller the size of the map, the wider the field of vision, but the fewer visible coordinate points
        is_roam=True,  # Turn on mouse zoom and pan walk
)  # Call Baidu map API

# Add image element
bmap.add(
        '',
        data_pair=data_pair,
        symbol_size=13,
        itemstyle_opts=opts.ItemStyleOpts(color="blue")
)  # Font settings

# Image series settings
bmap.set_series_opts(label_opts=opts.LabelOpts(is_show=False),
                     type='effectScatter'
                    )  # Label settings
bmap.set_global_opts(
        visualmap_opts=opts.VisualMapOpts(max_=50,
                                          is_piecewise=True,
                                          pos_bottom=60,
                                          pieces=[
                                              {"max": 200, "min": 31,
                                               "label": ">31", "color": "#4169E1"},
                                              {"max": 30, "min": 11,
                                                      "label": "11-30", "color": "#9400D3"},
                                              {"max": 10, "min": 6, "label": "6-10",
                                                      "color": "#FF1493"},
                                              {"max": 5, "min": 0, "label": "0-5",
                                               "color": "#FF4500"}
                                          ]
                                         ),  # Visual mapping key settings
        title_opts=opts.TitleOpts(title="2021 Distribution map of drivers' physical examination hospitals in Beijing in",
                                  title_link="http://jtgl.beijing.gov.cn/jgj/qtym/1734494/index.html",pos_left="center",
                                  pos_top=20,
                                  title_textstyle_opts=opts.TextStyleOpts(color="#000000", font_size=30)
                                )  # Title Setting
                    )

# render the image to html file to view dynamic images in the browser
bmap.render("Distribution of physical examination hospitals for drivers in Beijing.html")
After the program runs, an HTML file will be generated, which can be accessed through the browser to view the dynamic image.
There are many methods for data visualization. Pyechards, a third-party library of Python, is just one of them. Usually, we also use third-party libraries such as Matplotlib and Seaborn for data visualization.
In addition, some non programming tools can also realize data visualization, such as Echarts.
Write at the end
"Visualization", as the "window" of data and human interaction, has become one of the skills that everyone must know in the era of big data. I believe that in the near future, Chinese "dolls" can skillfully use computers for data visualization! 😊
This is the end of the writing. By exploring this sudden "fantasy", I learned a "lazy" way of "old driver". I will go to the nearest hospital for the next physical examination 😛.
Although the notes are not long, they did help me review the syntax of Pyecharts map visualization (one thing to say, the "user manual" on Pyecharts official website speaks the syntax very comprehensively).
Of course, "grammar" learning is only a link of "visual" learning. The most important thing is to improve your "appreciation" ability, strive to "trust, expressiveness and elegance" of visual results, and guide program design with aesthetic thinking.