Circular Packing
Circular Packing can nest groups of circles together to show the hierarchical relationship of data. This paper mainly realizes the drawing of circular nested graph based on circlify. The circlify package is implemented by Python. The official open source address is at: circlify
You can install circlify using the following code:
pip install circlify
This paper mainly refers to circlify and circular-packing
1 drawing of circular nested drawing with first level hierarchy
circlify can work without a hierarchy, that is, there is only a set of numeric variables, and each variable will be displayed as a circle. Note that the package only calculates the position and size of each circle. When finished, matplotlib is used to make the chart itself. In addition, the circle library also provides a bubbles() function to complete all drawing functions. But it doesn't provide a lot of customization, so matplotlib is a better drawing choice here.
1.1 drawing data and circlify calculation
The basic circular nested graph based on one-level hierarchy only needs two columns of data frames. The first column provides the name of each item (for marking). The second column provides the value of the item. It controls the size of the circle.
import pandas as pd
df = pd.DataFrame({
    'Name': ['A', 'B', 'C', 'D', 'E', 'F'],
    'Value': [10, 2, 23, 87, 12, 65]
})
df
| Name | Value | |
|---|---|---|
| 0 | A | 10 |
| 1 | B | 2 |
| 2 | C | 23 |
| 3 | D | 87 |
| 4 | E | 12 |
| 5 | F | 65 |
In a basic circular nested diagram with a one-level hierarchy, each entity of the dataset is represented by a circle. The size of the circle is proportional to the value it represents. The hardest part of the job is to calculate the position and size of each circle. Fortunately, the circlify library provides a function that circlify() evaluates. Import it as a drawing.
The input parameters of the calculation function are as follows:
- data: (required) a list of positive values sorted from large to small
- show_enclosure: (optional) a Boolean value indicating whether to add a minimum enclosing circle outside all circles (False by default)
- target_enclosure: (optional) parameter information of the minimum enclosing circle (the default is unit circle (0, 0, 1))
# import the circlify library
# Import library
import circlify

# compute circle positions:
# Calculate the position of the circle
# circle is a list
circles = circlify.circlify(
    df['Value'].tolist(),
    show_enclosure=False,
    target_enclosure=circlify.Circle(x=0, y=0, r=1)
)
# Output the information of one of the circles to be drawn, X and y are the coordinates of the center of the circle, and level is the drawing level
circles[0]
Circle(x=-0.44578608966292743, y=0.537367020215489, r=0.08132507760370634, level=1, ex={'datum': 2})
1.2 drawing
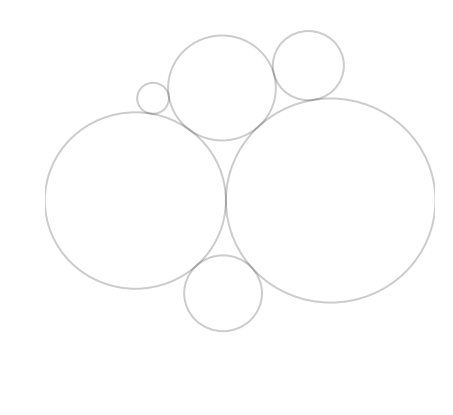
1.2.1 basic drawing
After calculating the data through circlify, the circular nested diagram of the foundation is drawn as follows.
# import libraries
import circlify
import matplotlib.pyplot as plt

# Create just a figure and only one subplot
# Set image size
fig, ax = plt.subplots(figsize=(7,7))

# Remove axes
# Set matplotlib not to display axes
ax.axis('off')

# Find axis boundaries
# Find axis boundaries
lim = max(
    max(
        abs(circle.x) + circle.r,
        abs(circle.y) + circle.r,
    )
    for circle in circles
)
plt.xlim(-lim, lim)
plt.ylim(-lim, lim)

# print circles
# Draw a circle
for circle in circles:
    x, y, r = circle
    # fill indicates that the circle is not filled
    ax.add_patch(plt.Circle((x, y), r, alpha=0.2, linewidth=2, fill=False))
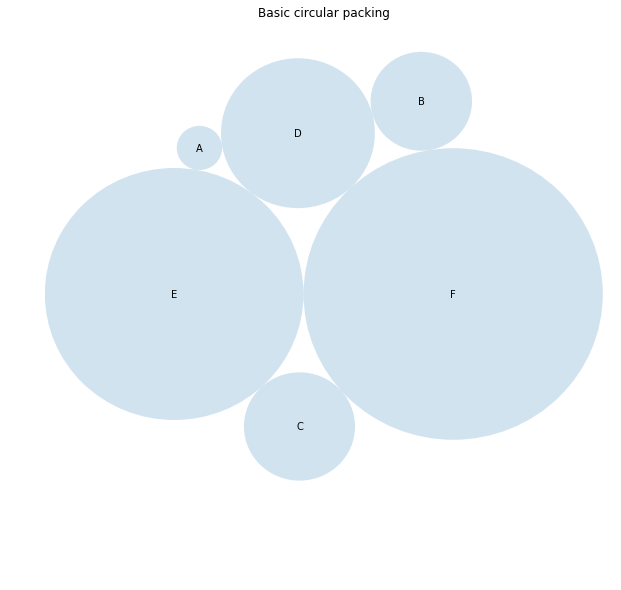
1.2.2 visual adjustment
Let's do something more beautiful and insightful from here. We'll add a title, color the circle and label it:
# import libraries
import circlify
import matplotlib.pyplot as plt

# Create just a figure and only one subplot
fig, ax = plt.subplots(figsize=(10,10))

# Title
# Add title
ax.set_title('Basic circular packing')

# Remove axes
ax.axis('off')

# Find axis boundaries
lim = max(
    max(
        abs(circle.x) + circle.r,
        abs(circle.y) + circle.r,
    )
    for circle in circles
)
plt.xlim(-lim, lim)
plt.ylim(-lim, lim)

# list of labels
# Add label
labels = df['Name']

# print circles
for circle, label in zip(circles, labels):
    x, y, r = circle
    ax.add_patch(plt.Circle((x, y), r, alpha=0.2, linewidth=2))
    # Add label
    plt.annotate(
          label,
          (x,y ) ,
          va='center',
          ha='center'
     )
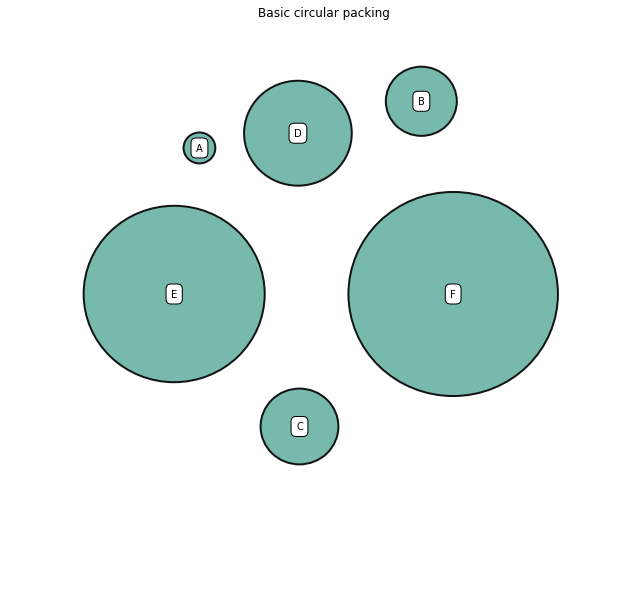
1.2.3 space setting between circles
You can easily add spacing between circles. You only need to provide the percentage of radius parameter to add_patch() (70% here).
# Create just a figure and only one subplot
fig, ax = plt.subplots(figsize=(10,10))

# Title
ax.set_title('Basic circular packing')

# Remove axes
ax.axis('off')

# Find axis boundaries
lim = max(
    max(
        abs(circle.x) + circle.r,
        abs(circle.y) + circle.r,
    )
    for circle in circles
)
plt.xlim(-lim, lim)
plt.ylim(-lim, lim)

# list of labels
labels = df['Name']

# print circles
for circle, label in zip(circles, labels):
    x, y, r = circle
    # facecolor sets the fill color of the circle and edgecolor sets the border color
    ax.add_patch(plt.Circle((x, y), r*0.7, alpha=0.9, linewidth=2, facecolor="#69b2a3", edgecolor="black"))
    # boxstyle sets the border shape and pad sets the border fill
    plt.annotate(label, (x,y ) ,va='center', ha='center', bbox=dict(facecolor='white', edgecolor='black', boxstyle='round', pad=.5))
2 drawing of circular nested graph with multi-level
The following explains how to build a circular nested graph with multiple hierarchies. It uses the circle library to calculate the circular position and uses matplotlib to render graphics.
2.1 drawing data and circlify calculation
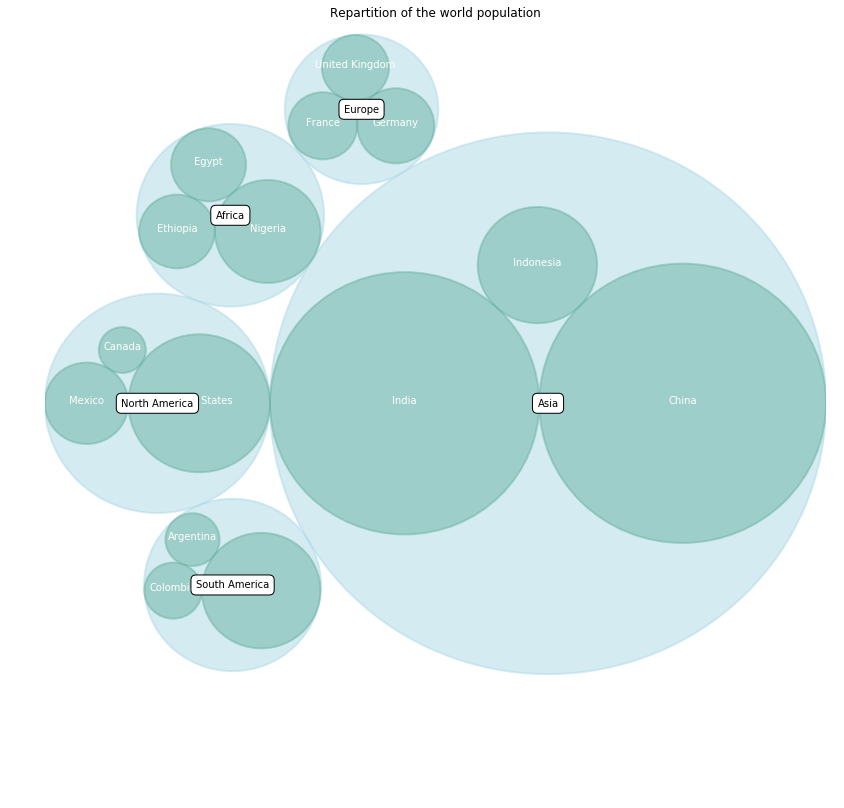
This example considers a hierarchical dataset. The world is divided by continents. The mainland is divided by country. Each country has a value (population size). Our goal is to represent each country as a circle whose size is proportional to its population. Let's create a dataset:
data = [{'id': 'World', 'datum': 6964195249, 'children' : [
              {'id' : "North America", 'datum': 450448697,
                   'children' : [
                     {'id' : "United States", 'datum' : 308865000},
                     {'id' : "Mexico", 'datum' : 107550697},
                     {'id' : "Canada", 'datum' : 34033000}
                   ]},
              {'id' : "South America", 'datum' : 278095425,
                   'children' : [
                     {'id' : "Brazil", 'datum' : 192612000},
                     {'id' : "Colombia", 'datum' : 45349000},
                     {'id' : "Argentina", 'datum' : 40134425}
                   ]},
              {'id' : "Europe", 'datum' : 209246682,
                   'children' : [
                     {'id' : "Germany", 'datum' : 81757600},
                     {'id' : "France", 'datum' : 65447374},
                     {'id' : "United Kingdom", 'datum' : 62041708}
                   ]},
              {'id' : "Africa", 'datum' : 311929000,
                   'children' : [
                     {'id' : "Nigeria", 'datum' : 154729000},
                     {'id' : "Ethiopia", 'datum' : 79221000},
                     {'id' : "Egypt", 'datum' : 77979000}
                   ]},
              {'id' : "Asia", 'datum' : 2745929500,
                   'children' : [
                     {'id' : "China", 'datum' : 1336335000},
                     {'id' : "India", 'datum' : 1178225000},
                     {'id' : "Indonesia", 'datum' : 231369500}
                   ]}
    ]}]

data
[{'id': 'World',
  'datum': 6964195249,
  'children': [{'id': 'North America',
    'datum': 450448697,
    'children': [{'id': 'United States', 'datum': 308865000},
     {'id': 'Mexico', 'datum': 107550697},
     {'id': 'Canada', 'datum': 34033000}]},
   {'id': 'South America',
    'datum': 278095425,
    'children': [{'id': 'Brazil', 'datum': 192612000},
     {'id': 'Colombia', 'datum': 45349000},
     {'id': 'Argentina', 'datum': 40134425}]},
   {'id': 'Europe',
    'datum': 209246682,
    'children': [{'id': 'Germany', 'datum': 81757600},
     {'id': 'France', 'datum': 65447374},
     {'id': 'United Kingdom', 'datum': 62041708}]},
   {'id': 'Africa',
    'datum': 311929000,
    'children': [{'id': 'Nigeria', 'datum': 154729000},
     {'id': 'Ethiopia', 'datum': 79221000},
     {'id': 'Egypt', 'datum': 77979000}]},
   {'id': 'Asia',
    'datum': 2745929500,
    'children': [{'id': 'China', 'datum': 1336335000},
     {'id': 'India', 'datum': 1178225000},
     {'id': 'Indonesia', 'datum': 231369500}]}]}]
Then we need to use circle () to calculate the position of the circle representing each country and continent, as well as their radius.
# import the circlify library
import circlify

# Compute circle positions thanks to the circlify() function
# calculation
circles = circlify.circlify(
    data,
    show_enclosure=False,
    target_enclosure=circlify.Circle(x=0, y=0, r=1)
)
circles
[Circle(x=0.0, y=0.0, r=1.0, level=1, ex={'id': 'World', 'datum': 6964195249, 'children': [{'id': 'North America', 'datum': 450448697, 'children': [{'id': 'United States', 'datum': 308865000}, {'id': 'Mexico', 'datum': 107550697}, {'id': 'Canada', 'datum': 34033000}]}, {'id': 'South America', 'datum': 278095425, 'children': [{'id': 'Brazil', 'datum': 192612000}, {'id': 'Colombia', 'datum': 45349000}, {'id': 'Argentina', 'datum': 40134425}]}, {'id': 'Europe', 'datum': 209246682, 'children': [{'id': 'Germany', 'datum': 81757600}, {'id': 'France', 'datum': 65447374}, {'id': 'United Kingdom', 'datum': 62041708}]}, {'id': 'Africa', 'datum': 311929000, 'children': [{'id': 'Nigeria', 'datum': 154729000}, {'id': 'Ethiopia', 'datum': 79221000}, {'id': 'Egypt', 'datum': 77979000}]}, {'id': 'Asia', 'datum': 2745929500, 'children': [{'id': 'China', 'datum': 1336335000}, {'id': 'India', 'datum': 1178225000}, {'id': 'Indonesia', 'datum': 231369500}]}]}),
 Circle(x=-0.1891573044970616, y=0.7725949609994359, r=0.1964724487306323, level=2, ex={'id': 'Europe', 'datum': 209246682, 'children': [{'id': 'Germany', 'datum': 81757600}, {'id': 'France', 'datum': 65447374}, {'id': 'United Kingdom', 'datum': 62041708}]}),
 Circle(x=-0.5193811141243917, y=-0.4774793174718824, r=0.22650056519090414, level=2, ex={'id': 'South America', 'datum': 278095425, 'children': [{'id': 'Brazil', 'datum': 192612000}, {'id': 'Colombia', 'datum': 45349000}, {'id': 'Argentina', 'datum': 40134425}]}),
 Circle(x=-0.5250482991363239, y=0.4940564718994228, r=0.23988342689140008, level=2, ex={'id': 'Africa', 'datum': 311929000, 'children': [{'id': 'Nigeria', 'datum': 154729000}, {'id': 'Ethiopia', 'datum': 79221000}, {'id': 'Egypt', 'datum': 77979000}]}),
 Circle(x=-0.7117329289789401, y=0.0, r=0.28826707102105975, level=2, ex={'id': 'North America', 'datum': 450448697, 'children': [{'id': 'United States', 'datum': 308865000}, {'id': 'Mexico', 'datum': 107550697}, {'id': 'Canada', 'datum': 34033000}]}),
 Circle(x=0.28826707102105975, y=0.0, r=0.7117329289789401, level=2, ex={'id': 'Asia', 'datum': 2745929500, 'children': [{'id': 'China', 'datum': 1336335000}, {'id': 'India', 'datum': 1178225000}, {'id': 'Indonesia', 'datum': 231369500}]}),
 Circle(x=-0.8015572298502232, y=0.13991165332617728, r=0.06017798041665636, level=3, ex={'id': 'Canada', 'datum': 34033000}),
 Circle(x=-0.6218965087862706, y=-0.35827194898537407, r=0.06927524011838612, level=3, ex={'id': 'Argentina', 'datum': 40134425}),
 Circle(x=-0.6715240632168605, y=-0.49229197511777817, r=0.07363823567480635, level=3, ex={'id': 'Colombia', 'datum': 45349000}),
 Circle(x=-0.20484950837730978, y=0.8820383650518233, r=0.08590977893113161, level=3, ex={'id': 'United Kingdom', 'datum': 62041708}),
 Circle(x=-0.2883116431566897, y=0.7291956444670085, r=0.08823620918716854, level=3, ex={'id': 'France', 'datum': 65447374}),
 Circle(x=-0.5807524341097545, y=0.6266527390697123, r=0.09606159016055799, level=3, ex={'id': 'Egypt', 'datum': 77979000}),
 Circle(x=-0.6616477217438194, y=0.4515509451194898, r=0.09682357206293761, level=3, ex={'id': 'Ethiopia', 'datum': 79221000}),
 Circle(x=-0.10145547990466931, y=0.7291956444670085, r=0.09861995406485186, level=3, ex={'id': 'Germany', 'datum': 81757600}),
 Circle(x=-0.8930220906231182, y=0.0, r=0.1069779093768817, level=3, ex={'id': 'Mexico', 'datum': 107550697}),
 Circle(x=-0.42950888228212775, y=0.4515509451194898, r=0.13531526739875396, level=3, ex={'id': 'Nigeria', 'datum': 154729000}),
 Circle(x=-0.44612447532083954, y=-0.49229197511777817, r=0.15176135222121462, level=3, ex={'id': 'Brazil', 'datum': 192612000}),
 Circle(x=0.2610622289123354, y=0.3631857971321717, r=0.15273517341003195, level=3, ex={'id': 'Indonesia', 'datum': 231369500}),
 Circle(x=-0.6047550196020585, y=0.0, r=0.18128916164417805, level=3, ex={'id': 'United States', 'datum': 308865000}),
 Circle(x=-0.07879852383709784, y=0.0, r=0.34466733412078254, level=3, ex={'id': 'India', 'datum': 1178225000}),
 Circle(x=0.6329344051418423, y=0.0, r=0.3670655948581576, level=3, ex={'id': 'China', 'datum': 1336335000})]
2.2 drawing
# import libraries
import circlify
import matplotlib.pyplot as plt

# Create just a figure and only one subplot
fig, ax = plt.subplots(figsize=(14,14))

# Title
ax.set_title('Repartition of the world population')

# Remove axes
ax.axis('off')

# Find axis boundaries
lim = max(
    max(
        abs(circle.x) + circle.r,
        abs(circle.y) + circle.r,
    )
    for circle in circles
)
plt.xlim(-lim, lim)
plt.ylim(-lim, lim)

# Print circle the highest level (continents):
# Print the highest level circle, that is, the continent in the data. The level of this part of the circle is 3
for circle in circles:
    if circle.level != 2:
      continue
    x, y, r = circle
    ax.add_patch( plt.Circle((x, y), r, alpha=0.5, linewidth=2, color="lightblue"))

# Print the next high-level circle, that is, the country in the data. The level of this part of the circle is 2
for circle in circles:
    if circle.level != 3:
      continue
    x, y, r = circle
    label = circle.ex["id"]
    ax.add_patch( plt.Circle((x, y), r, alpha=0.5, linewidth=2, color="#69b3a2"))
    # Draw the name of the country
    plt.annotate(label, (x,y ), ha='center', color="white")

# Print labels for the continents
# Draw the labels of the continents
for circle in circles:
    if circle.level != 2:
      continue
    x, y, r = circle
    label = circle.ex["id"]
    plt.annotate(label, (x,y ) ,va='center', ha='center', bbox=dict(facecolor='white', edgecolor='black', boxstyle='round', pad=.5))
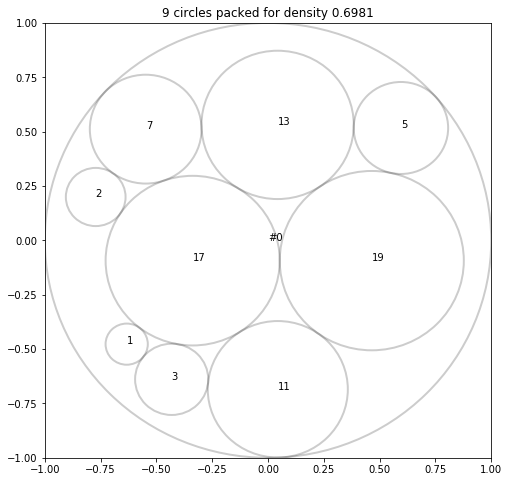
3. Circlify has its own drawing function
If you just want to see how the data is, you can use the self-contained drawing function bubbles of circle, but you can't customize the graphics. The advantage of the bubbles function of circle is that you don't need to draw circles layer by layer with matplotlib.
First level drawing
from pprint import pprint as pp
import circlify
# Define circle
# show_enclosure=True Indicates that the outer circle is displayed, that is, the circle in the result#0
circles = circlify.circlify([19, 17, 13, 11, 7, 5, 3, 2, 1], show_enclosure=True)
# Beautify output
pp(circles)

# Show results
circlify.bubbles(circles)
[Circle(x=0.0, y=0.0, r=1.0, level=0, ex=None),
 Circle(x=-0.633232604611031, y=-0.47732413442115296, r=0.09460444572843042, level=1, ex={'datum': 1}),
 Circle(x=-0.7720311587589236, y=0.19946176418549022, r=0.13379089020993573, level=1, ex={'datum': 2}),
 Circle(x=-0.43168871955473165, y=-0.6391381648617572, r=0.16385970662353394, level=1, ex={'datum': 3}),
 Circle(x=0.595447603036083, y=0.5168251295666467, r=0.21154197162246005, level=1, ex={'datum': 5}),
 Circle(x=-0.5480911056188739, y=0.5115139053491098, r=0.2502998363185337, level=1, ex={'datum': 7}),
 Circle(x=0.043747233552068686, y=-0.6848366902134195, r=0.31376744998074435, level=1, ex={'datum': 11}),
 Circle(x=0.04298737651230445, y=0.5310431146935967, r=0.34110117996070605, level=1, ex={'datum': 13}),
 Circle(x=-0.3375943908160698, y=-0.09326467617622711, r=0.39006412239133215, level=1, ex={'datum': 17}),
 Circle(x=0.46484095011516874, y=-0.09326467617622711, r=0.4123712185399064, level=1, ex={'datum': 19})]
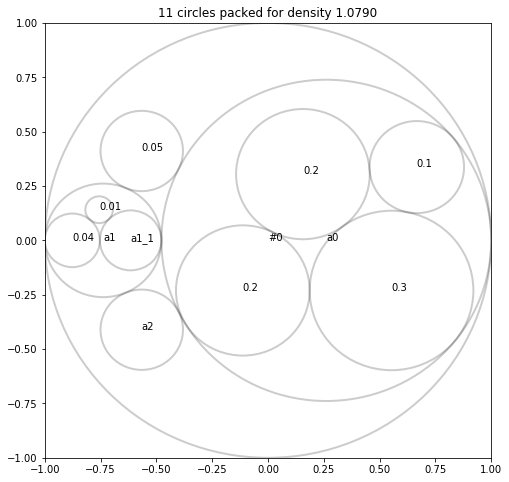
Multilevel drawing
from pprint import pprint as pp
import circlify
data = [
        0.05, {'id': 'a2', 'datum': 0.05},
        {'id': 'a0', 'datum': 0.8, 'children': [0.3, 0.2, 0.2, 0.1], },
        {'id': 'a1', 'datum': 0.1, 'children': [
            {'id': 'a1_1', 'datum': 0.05}, {'datum': 0.04}, 0.01],
        },
    ]
circles = circlify.circlify(data, show_enclosure=True)
pp(circles)

# Show results
circlify.bubbles(circles)
[Circle(x=0.0, y=0.0, r=1.0, level=0, ex=None),
 Circle(x=-0.5658030759977484, y=0.4109778665114514, r=0.18469903125906464, level=1, ex={'datum': 0.05}),
 Circle(x=-0.5658030759977484, y=-0.4109778665114514, r=0.18469903125906464, level=1, ex={'id': 'a2', 'datum': 0.05}),
 Circle(x=-0.7387961250362587, y=0.0, r=0.2612038749637415, level=1, ex={'id': 'a1', 'datum': 0.1, 'children': [{'id': 'a1_1', 'datum': 0.05}, {'datum': 0.04}, 0.01]}),
 Circle(x=0.2612038749637414, y=0.0, r=0.7387961250362586, level=1, ex={'id': 'a0', 'datum': 0.8, 'children': [0.3, 0.2, 0.2, 0.1]}),
 Circle(x=-0.7567888163564135, y=0.1408782365133844, r=0.0616618704777984, level=2, ex={'datum': 0.01}),
 Circle(x=-0.8766762590444033, y=0.0, r=0.1233237409555968, level=2, ex={'datum': 0.04}),
 Circle(x=-0.6154723840806618, y=0.0, r=0.13788013400814464, level=2, ex={'id': 'a1_1', 'datum': 0.05}),
 Circle(x=0.6664952237042414, y=0.33692908734605553, r=0.21174557028487648, level=2, ex={'datum': 0.1}),
 Circle(x=-0.1128831469183017, y=-0.23039288135707192, r=0.29945345726929773, level=2, ex={'datum': 0.2}),
 Circle(x=0.1563193680487183, y=0.304601976765483, r=0.29945345726929773, level=2, ex={'datum': 0.2}),
 Circle(x=0.5533243963620487, y=-0.23039288135707192, r=0.3667540860110527, level=2, ex={'datum': 0.3})]