Preface
The text and pictures of the article are from the Internet, only for learning and communication, and do not have any commercial use. The copyright belongs to the original author. If you have any questions, please contact us in time for handling.
Author: Luo Zhaocheng
PS: if you need Python learning materials, you can click the link below to get them by yourself
http://note.youdao.com/noteshare?id=3054cce4add8a909e784ad934f956cef
Get cat eye interface data
As a long-term stay at home programmer, it is easy to grasp all kinds of packages. View the original code mode in Chrome, and you can see the interface clearly. The interface address is:
http://m.maoyan.com/mmdb/comments/movie/1208282.json?_v_=yes&offset=15
In Python, we can easily use request to send network requests and get the returned results:
1 def getMoveinfo(url):
2     session = requests.Session()
3     headers = {
4         "User-Agent": "Mozilla/5.0 (iPhone; CPU iPhone OS 11_0 like Mac OS X)"
5     }
6     response = session.get(url, headers=headers)
7     if response.status_code == 200:
8         return response.text
9     return None
According to the above request, we can get the return data of this interface. There is a lot of information about the data content, but there is a lot of information we don't need. First, let's take a look at the overall data returned:
1 { 2 "cmts":[ 3 { 4 "approve":0, 5 "approved":false, 6 "assistAwardInfo":{ 7 "avatar":"", 8 "celebrityId":0, 9 "celebrityName":"", 10 "rank":0, 11 "title":"" 12 }, 13 "authInfo":"", 14 "cityName":"Guiyang", 15 "content":"It's a movie that you have to watch to borrow money.", 16 "filmView":false, 17 "id":1045570589, 18 "isMajor":false, 19 "juryLevel":0, 20 "majorType":0, 21 "movieId":1208282, 22 "nick":"nick", 23 "nickName":"nickName", 24 "oppose":0, 25 "pro":false, 26 "reply":0, 27 "score":5, 28 "spoiler":0, 29 "startTime":"2018-11-22 23:52:58", 30 "supportComment":true, 31 "supportLike":true, 32 "sureViewed":1, 33 "tagList":{ 34 "fixed":[ 35 { 36 "id":1, 37 "name":"Praise" 38 }, 39 { 40 "id":4, 41 "name":"Ticket purchase" 42 } 43 ] 44 }, 45 "time":"2018-11-22 23:52", 46 "userId":1871534544, 47 "userLevel":2, 48 "videoDuration":0, 49 "vipInfo":"", 50 "vipType":0 51 } 52 ] 53 } 54
With so much data, we are only interested in the following fields:
nickName, cityName, content, startTime, score
Next, we will do some important data processing, and analyze the required fields from the JSON data we get:
 1 def parseInfo(data):
 2     data = json.loads(html)['cmts']
 3     for item in data:
 4         yield{
 5             'date':item['startTime'],
 6             'nickname':item['nickName'],
 7             'city':item['cityName'],
 8             'rate':item['score'],
 9             'conment':item['content']
10         }
After we get the data, we can start data analysis. However, in order to avoid frequent data requests from cat's eyes, the data needs to be stored. Here, SQLite3 is used by the author, which is put into the database for more convenient subsequent processing. The code to store the data is as follows:
 1 def saveCommentInfo(moveId, nikename, comment, rate, city, start_time)
 2     conn = sqlite3.connect('unknow_name.db')
 3     conn.text_factory=str
 4     cursor = conn.cursor()
 5     ins="insert into comments values (?,?,?,?,?,?)"
 6     v = (moveId, nikename, comment, rate, city, start_time)
 7     cursor.execute(ins,v)
 8     cursor.close()
 9     conn.commit()
10     conn.close()
data processing
Because the database is used for data storage, we can directly use SQL to query the desired results, such as commenting on the top five cities:
SELECT city, count(*) rate_count FROM comments GROUP BY city ORDER BY rate_count DESC LIMIT 5
The results are as follows:
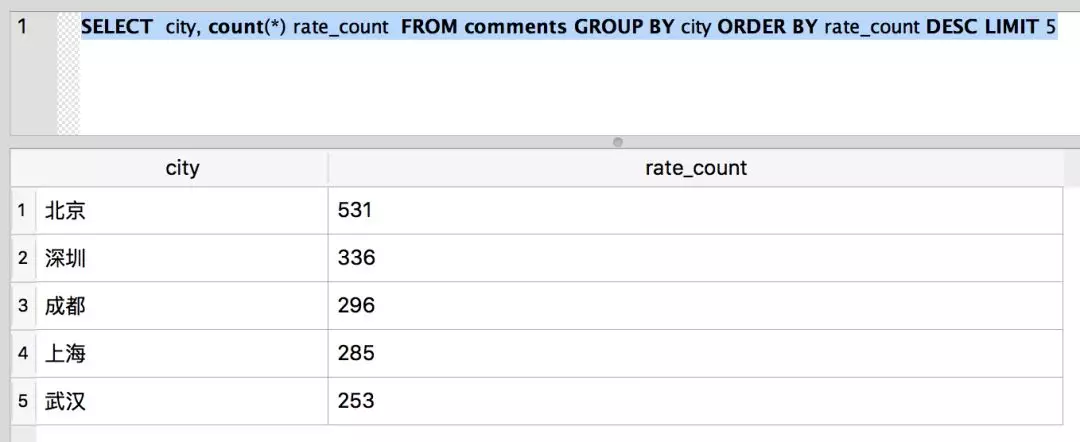
From the above data, we can see that there are the most comments from Beijing.
In addition, more SQL statements can be used to query the desired results. For example, the number and proportion of each score. If I am interested, I can try to query the data, which is so simple.
In order to better display the data, we use the Pyecharts library to visualize the data.
According to the data obtained from the cat's eye, according to the geographical location, Pyecharts is directly used to display the data on the map of China:
1 data = pd.read_csv(f,sep='{',header=None,encoding='utf-8',names=['date','nickname','city','rate','comment']) 2 city = data.groupby(['city']) 3 city_com = city['rate'].agg(['mean','count']) 4 city_com.reset_index(inplace=True) 5 data_map = [(city_com['city'][i],city_com['count'][i]) for i in range(0,city_com.shape[0])] 6 geo = Geo("GEO Geographical location analysis",title_pos = "center",width = 1200,height = 800) 7 while True: 8 try: 9 attr,val = geo.cast(data_map) 10 geo.add("",attr,val,visual_range=[0,300],visual_text_color="#fff", 11 symbol_size=10, is_visualmap=True,maptype='china') 12 13 except ValueError as e: 14 e = e.message.split("No coordinate is specified for ")[1] 15 data_map = filter(lambda item: item[0] != e, data_map) 16 else : 17 break 18 geo.render('geo_city_location.html')
Note: in the data map provided by Pyecharts, some cities in the cat's eye data can't find corresponding slaves, so in the code, GEO added the wrong cities, and we deleted them directly, filtering out a lot of data.
With Python, the following map is simply generated: 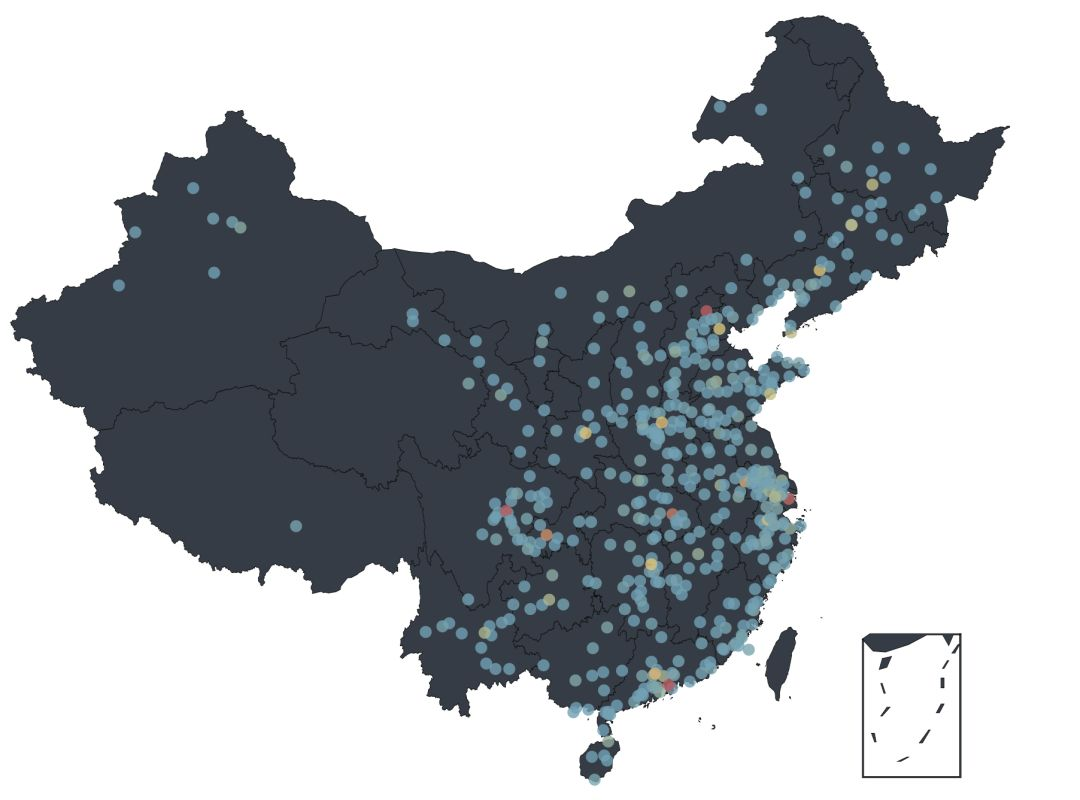
From the visual data, we can see that the people who watch movies and comment are mainly distributed in the east of China, and Beijing, Shanghai, Chengdu and Shenzhen are the most. Although we can see a lot of data from the graph, it is not intuitive enough. If we want to see the distribution of each province / City, we need to further process the data.
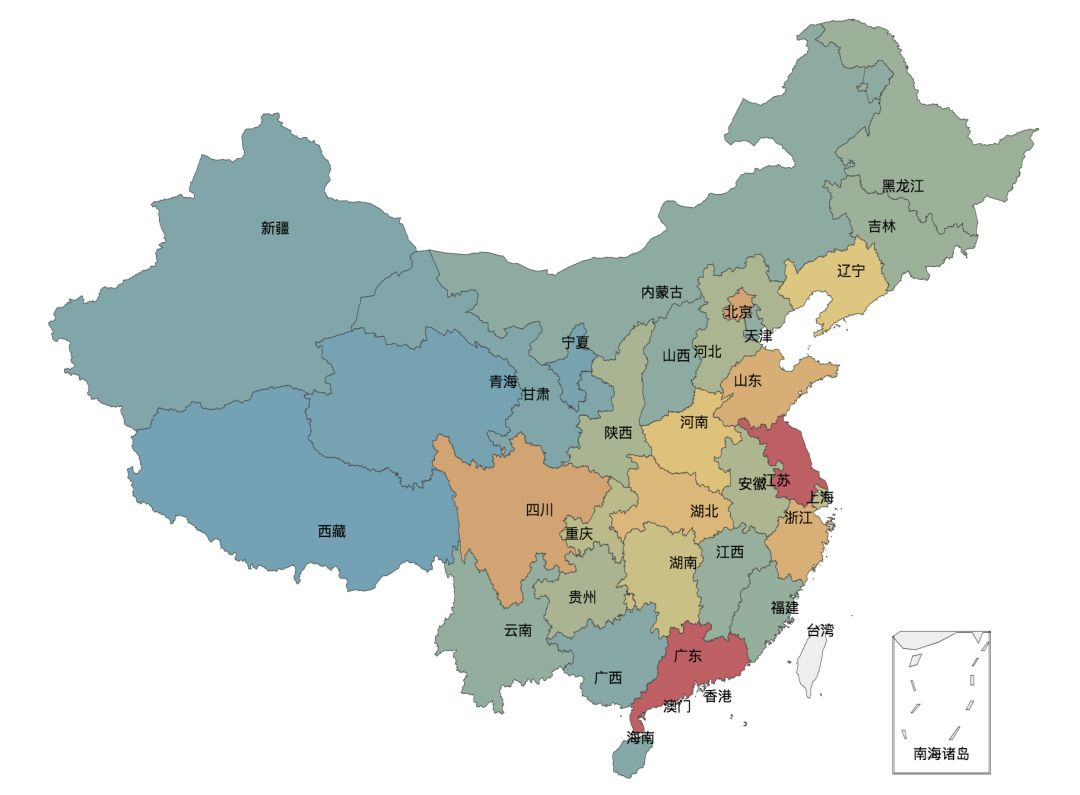
In the data obtained from the cat's eye, the city contains the data of the county seat, so it is necessary to make a conversion of the data obtained, convert all the county seats to the corresponding provinces and cities, and then add the number of comments of the same province and city to get the final result.
 1 data = pd.read_csv(f,sep='{',header=None,encoding='utf-8',names=['date','nickname','city','rate','comment'])
 2 city = data.groupby(['city'])
 3 city_com = city['rate'].agg(['mean','count'])
 4 city_com.reset_index(inplace=True)
 5 fo = open("citys.json",'r')
 6 citys_info = fo.readlines()
 7 citysJson = json.loads(str(citys_info[0]))
 8 data_map_all = [(getRealName(city_com['city'][i], citysJson),city_com['count'][i]) for i in range(0,city_com.shape[0])]
 9 data_map_list = {}
10 for item in data_map_all:
11     if data_map_list.has_key(item[0]):
12         value = data_map_list[item[0]]
13         value += item[1]
14         data_map_list[item[0]] = value
15     else:
16         data_map_list[item[0]] = item[1]
17 data_map = [(realKeys(key), data_map_list[key] ) for key in data_map_list.keys()]
18 def getRealName(name, jsonObj):
19     for item in jsonObj:
20         if item.startswith(name) :
21             return jsonObj[item]
22     return name
23 def realKeys(name):
24     return name.replace(u"province", "").replace(u"city", "")
25                .replace(u"Hui Autonomous Region", "").replace(u"Uygur Autonomous Region", "")
26                .replace(u"Zhuang Autonomous Region", "").replace(u"Autonomous Region", "")
After the above data processing, use the map provided by Pyecharts to generate a map displayed by province / City:
 1 def generateMap(data_map):
 2     map = Map("Number of city reviews", width= 1200, height = 800, title_pos="center")
 3     while True:
 4         try:
 5             attr,val = geo.cast(data_map)
 6             map.add("",attr,val,visual_range=[0,800],
 7                     visual_text_color="#fff",symbol_size=5,
 8                     is_visualmap=True,maptype='china',
 9                     is_map_symbol_show=False,is_label_show=True,is_roam=False,
10                     )
11         except ValueError as e:
12             e = e.message.split("No coordinate is specified for ")[1]
13             data_map = filter(lambda item: item[0] != e, data_map)
14         else :
15             break
16     map.render('city_rate_count.html')
Of course, we can also visualize the number of people in each score. This place uses histogram to display:
 1 data = pd.read_csv(f,sep='{',header=None,encoding='utf-8',names=['date','nickname','city','rate','comment'])
 2 # Classification by score
 3 rateData = data.groupby(['rate'])
 4 rateDataCount = rateData["date"].agg([ "count"])
 5 rateDataCount.reset_index(inplace=True)
 6 count = rateDataCount.shape[0] - 1
 7 attr = [rateDataCount["rate"][count - i] for i in range(0, rateDataCount.shape[0])]
 8 v1 = [rateDataCount["count"][count - i] for i in range(0, rateDataCount.shape[0])]
 9 bar = Bar("Score quantity")
10 bar.add("Number",attr,v1,is_stack=True,xaxis_rotate=30,yaxix_min=4.2,
11         xaxis_interval=0,is_splitline_show=True)
12 bar.render("html/rate_count.html")
As shown in the figure below, in the data of cat's eye, the rate of five-star praise is more than 50%, which is much better than that of 34.8% on Douban.

From the above data of audience distribution and rating, we can see that audience friends still like this play very much. Previously, we got the audience's comment data from the cat's eye. Now, the author will segment the comments through jieba, and then make word cloud through Wordcloud to see the audience's overall evaluation of anonymous:
 1 data = pd.read_csv(f,sep='{',header=None,encoding='utf-8',names=['date','nickname','city','rate','comment'])
 2 comment = jieba.cut(str(data['comment']),cut_all=False)
 3 wl_space_split = " ".join(comment)
 4 backgroudImage = np.array(Image.open(r"./unknow_3.png"))
 5 stopword = STOPWORDS.copy()
 6 wc = WordCloud(width=1920,height=1080,background_color='white',
 7     mask=backgroudImage,
 8     font_path="./Deng.ttf",
 9     stopwords=stopword,max_font_size=400,
10     random_state=50)
11 wc.generate_from_text(wl_space_split)
12 plt.imshow(wc)
13 plt.axis("off")
14 wc.to_file('unknow_word_cloud.png')
Export:
 .
.