1. Classification of classification
Classification of classification? Yes, there are different kinds of classification, and it is often confused in the fields of mathematical modeling and machine learning.
First of all, let's talk about Supervised learning and Unsupervised learning. Does it mean that there are no teachers and Discipline Inspection Commission? almost. If there is a teacher, there will be a correct solution and a standard answer; If there is a Discipline Inspection Commission, it will set an example and negative teaching materials.
Supervised learning refers to that the sample data has given the correct Classification. Through learning the correctly classified sample data, we can summarize the laws, obtain knowledge and put it into application. Therefore, the sample data of supervised learning provides both eigenvalues and target values to learn the relationship between features and targets through regression and Classification. Regression is for continuous variables and continuous data, and Classification is for discrete variables and Boolean variables (0-1).
Unsupervised learning refers to that the sample data does not provide certain classification attributes, there is no teacher, and there is no standard answer. In the sample data, there is only the characteristic value of the sample without the target value. We can only explore and learn by ourselves through the characteristics of the sample data, and find and understand the similarity of objects through Clustering methods.
Therefore, when we talk about Classification, we sometimes refer to Classification and sometimes Clustering.
With supervised learning and teachers, there will be correct answers. Although there are sometimes fuzzy areas, generally speaking, there are judgment criteria and right and wrong. As long as it is inconsistent with the standard answer, it will be considered as wrong judgment.
Unsupervised learning is different. It can have different classification methods and different classification results. Usually, there are only relative good or bad, but no absolute right or wrong. Even the quality of the classification results is relative. We should comprehensively consider the actual needs and actual conditions in order to evaluate the quality of the classification results. Who can say that people should be divided into several categories? How can they be divided more reasonably?
2. Cluster analysis
2.1 classification of clustering
Clustering is to classify a large number of, multidimensional and unmarked sample data sets according to their own similarity from the perspective of data analysis. Large number refers to the large number of samples; Multidimensional means that each sample has many eigenvalues; Unmarked means that the sample data has no specified category attribute for each sample.
It should be noted that sometimes the sample data has one or more classification attributes, but that is not the Category attribute we want to study, so it will be called unsupervised learning. For example, each sample in the physical training data set has many characteristic data, including gender, age, weight, waist circumference, heart rate and blood pressure. Gender and age are obviously the attributes of the sample. We can also divide the sample set into male and female according to gender attributes. Of course, this is supervised learning; However, if we intend to study the relationship between the physiological changes of these samples and exercise, gender may not be the only classification attribute, or even the relevant attribute. In this sense, the classification attribute we want to classify is not given in the sample data.
As for the classification of clustering, it is aimed at the different research objects. Take the rows of the sample set as the object, investigate the similarity of the samples, and divide the sample set into several categories, which is called Q-type cluster analysis, which belongs to sample classification. Take the columns of the sample set as the object, investigate the correlation degree between each characteristic variable, and aggregate them into several categories according to the correlation of variables, which is called R-type cluster analysis, which belongs to factor analysis.
2.2 Q-type cluster analysis (sample clustering)
Q-type cluster analysis examines the similarity of samples and divides the sample set into several categories. We need to comprehensively consider the values or types of various characteristic variables of the sample, and find a classification method to divide the sample set into several categories, so that the samples of each category have great similarity and great difference with the samples of other categories. It is usually divided according to the distance between different samples. Those who are close are divided into one category, and those who are far away are divided into different categories, so as to achieve "similar and different".
According to similarity classification, we must first define what is similarity. For any two samples, it is easy to think of the distance between samples as an indicator of similarity. In one-dimensional space, the distance between two points is an absolute value: d(a,b)=abs[x(a)-x(b)]; The most familiar distance between two points in two-dimensional space is Euclid distance: d(a,b)=sqrt[(x1(a)-x1(b))**2+(x2(a)-x2(b))**2], and the Euclidean distance can also be extended to multi-dimensional space.
In addition to the Euclidean distance, there are other schemes to measure the sample spacing, such as Minkowski distance, Chebyshev distance, Mahalanobis distance, etc. The definition, formula and application conditions of these distances will not be introduced in detail in this paper. The world is rich and colorful, and the problems are diverse. For special problems, sometimes special solutions should be adopted according to their characteristics.
Furthermore, for the two groups of samples G1 and G2, it is also necessary to measure the degree of similarity between classes. Common methods include the shortest neighbor or single linkage method, the Farthest Neighbor or Complete Linkage Method, the Centroid Method, the Group Average Method, and the Sum of Squares Method.
In addition, when dealing with practical problems, the data should be standardized and normalized before calculating the distance, so as to solve the unified dimension and balanced weight between different features.
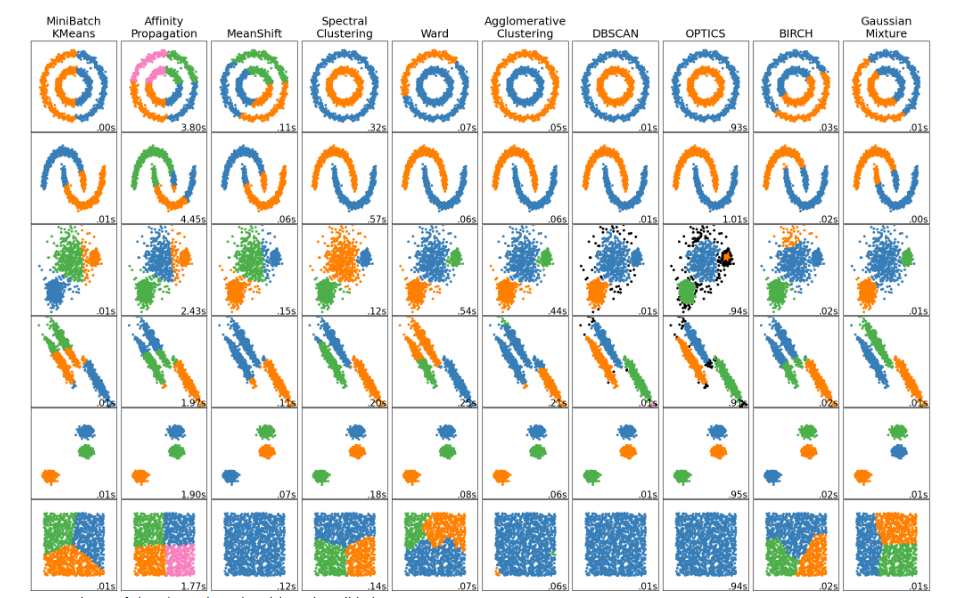
3. Clustering method in SKlearn
SKlearn toolkit provides a variety of clustering analysis algorithms: Prototype clustering method (Prototype), Density clustering method (Density), Hierarchical clustering method (Hierarchical), Model clustering (Model), etc. Prototype clustering methods include K-Means algorithm (K-Means), learning vector quantization algorithm (LVQ), Gaussian Mixture algorithm (Gaussian Mixture). See the table below for details.
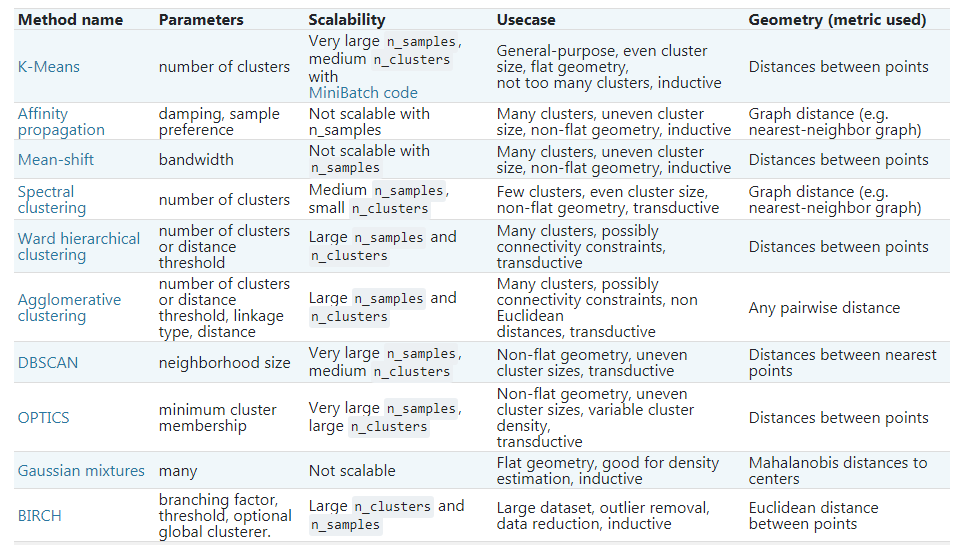
Why are there so many methods and algorithms? Because special problems need to adopt special solutions according to their characteristics. Look at the figure below, you can understand this sentence and what kinds of problems various algorithms are aimed at. SKlearn also provides more than ten clustering evaluation indicators, which will not be introduced in this paper.
4. K-Means clustering algorithm
K-means clustering algorithm is the most basic and widely used clustering algorithm, and it is also one of the fastest clustering algorithms.
4.1 principle and process
K-means clustering algorithm divides the sample data set into k classes with the goal of minimizing the error function.
The calculation process of K-means clustering algorithm is as follows:
- Set the initial value of the center of K categories;
- Calculate the distance from each sample to K centers and classify according to the nearest distance;
- Update the center of each category with the average value of samples in each category;
- Repeat the above steps until the termination conditions (number of iterations, least square error, change rate of cluster center point) are reached.
K-means clustering algorithm has the advantages of simple principle, simple algorithm, fast speed, excellent clustering effect and good scalability for large data sets. These advantages are especially beneficial to beginners and common problems. Its disadvantage is that it needs to give a k value, and its performance is not very good for some special cases (such as non convex clusters, special values and large differences in cluster sizes). What do you think of these shortcomings? There is a solution to the problem requiring a given value of K; As for the special situation, it has nothing to do with us.
4.2 use of K-means algorithm in sklearn
sklearn. cluster. Kmeans class is the specific implementation of K-means algorithm. See the official website for details: https://scikit-learn.org/stable/modules/generated/sklearn.cluster.KMeans.html#sklearn.cluster.KMeans
class sklearn.cluster.KMeans(n_clusters=8, *, init='k-means++', n_init=10, max_iter=300, tol=0.0001, precompute_distances='deprecated', verbose=0, random_state=None, copy_x=True, n_jobs='deprecated', algorithm='auto')
Main parameters of KMeans:
- n_clusters: int,default=8 K value, the default value is 8 for the given classification quantity.
- init: {K-means + +, 'random'} the selection method of the initial center. By default, 'K-means + +' is the optimization value, which can also be selected randomly or specified by yourself.
- n_init: int, default=10 run multiple times with different central initial values to reduce the impact of initial values on the algorithm. The default value is 10.
- max_iter: int, default=300 maximum iterations. The default value is 300.
- Algorithm: {"auto", "full", "elkan"}, default = "auto" algorithm selection, "full" is a classic EM algorithm, "elkan" can quickly process well-defined clusters, and the default value "auto" currently adopts "elkan".
Main attributes of KMeans:
- **clustercenters: * * coordinates of each cluster center
- labels_: Classification results of each sample
- inertia_: The sum of the distances from each point to the cluster center.
4.3 sklearn.cluster.KMeans usage instance
from sklearn.cluster import KMeans  # Import sklearn cluster. Kmeans class
import numpy as np
X = np.array([[1,2], [1,4], [1,0], [10,2], [10,4], [10,0]])
kmCluster = KMeans(n_clusters=2).fit(X)  # Establish the model and cluster, and set K=2
print(kmCluster.cluster_centers_)  # The coordinates of the center of each cluster are returned
#[[10., 2.], [ 1., 2.]]  # print displays the coordinates of the cluster center
print(kmCluster.labels_)  # Returns the classification result of the sample set
#[1, 1, 1, 0, 0, 0]  # print displays the classification results
print(kmCluster.predict([[0, 0], [12, 3]]))  # Predict and judge according to the clustering results of the model
#[1, 0]  # print displays the judgment result: which category does the sample belong to
The routine is very simple and detailed comments are given, so it is no longer interpreted. The core program is the following sentence:
kMeanModel = KMeans(n_clusters=2).fit(X)
4.4 improved algorithm for large sample set: Mini Batch K-Means
For the problems of huge sample set, such as sample size greater than 100000 and characteristic variable greater than 100, K-Means algorithm consumes a lot of speed and memory. SKlearn provides an improved algorithm Mini Batch K-Means for large sample sets, which does not use all sample data, but selects small sample sets for K-Means clustering and cyclic iteration each time. Although the performance of Mini Batch K-Means decreases slightly, it greatly improves the running speed and memory occupation.
class sklearn. cluster. The minibatchkmeans class is the specific implementation of the algorithm. See the official website for details: https://scikit-learn.org/stable/modules/generated/sklearn.cluster.MiniBatchKMeans.html#sklearn.cluster.MiniBatchKMeans
class sklearn.cluster.MiniBatchKMeans(n_clusters=8, *, init='k-means++', max_iter=100, batch_size=100, verbose=0, compute_labels=True, random_state=None, tol=0.0, max_no_improvement=10, init_size=None, n_init=3, reassignment_ratio=0.01)
The main parameters of MiniBatchKMeans are different from KMeans:
- batch_size: int, default=100 sample set size. The default value is 100.
Examples of Mini Batch K-Means usage are as follows:
from sklearn.cluster import MiniBatchKMeans # Import MiniBatchKMeans class
import numpy as np
X = np.array([[1,2], [1,4], [1,0], [4,2], [4,0], [4,4],
              [4,5], [0,1], [2,2],[3,2], [5,5], [1,-1]])
# fit on the whole data
mbkmCluster = MiniBatchKMeans(n_clusters=2,batch_size=6,max_iter=10).fit(X)
print(mbkmCluster.cluster_centers_) # The coordinates of the center of each cluster are returned
# [[3.96,2.41], [1.12,1.39]] # print display content
print(mbkmCluster.labels_)  # Returns the classification result of the sample set
#[1 1 1 0 0 0 0 1 1 0 0 1]  # print display content
print(mbkmCluster.predict([[0,0], [4,5]]))  # Predict and judge according to the clustering results of the model
#[1, 0]  # Display judgment result: which category does the sample belong to
5. K-means algorithm routine
5.1 problem description
-Cluster analysis case - Analysis of the development of general higher education in various regions of China. This problem and data come from: Si Shoukui and sun Zhaoliang, mathematical modeling algorithm and application (2nd Edition), National Defense Industry Press.
The original data of the question comes from China Statistical Yearbook, 1995 and China educational statistical yearbook, 1995, which gives 10 education development data of each region. There are great differences in the development of general higher education in various regions of China. Please cluster analyze the development of general higher education in various regions of China according to the data.
5.2 Python program
# Kmeans_sklearn_v1d.py
# K-Means cluster by scikit-learn for problem "education2015"
# v1.0d: K-Means clustering algorithm (SKlearn) solution: development of higher education in various regions - 2015 problem
# Date: May 10, 2021

#  -*- coding: utf-8 -*-
import numpy as np
import pandas as pd
from sklearn.cluster import KMeans, MiniBatchKMeans

# main program
def main():
    # Read data file
    readPath = "../data/education2015.xlsx"  # Address and file name of data file
    dfFile = pd.read_excel(readPath, header=0)  # First line header line
    dfFile = dfFile.dropna()  # Delete data with missing values
    # print(dfFile.dtypes)  # View df the data type of each column
    # print(dfFile.shape)  # View df the number of rows and columns
    print(dfFile.head())

    # Data preparation
    z_scaler = lambda x:(x-np.mean(x))/np.std(x)  # Define data normalization function
    dfScaler = dfFile[['x1','x2','x3','x4','x5','x6','x7','x8','x9','x10']].apply(z_scaler)  # data normalization
    dfData = pd.concat([dfFile[['region']], dfScaler], axis=1)  # Column level merge
    df = dfData.loc[:,['x1','x2','x3','x4','x5','x6','x7','x8','x9','x10']]  # Cluster analysis based on all 10 features
    # df = dfData.loc[:,['x1','x2','x7','x8','x9','x10']]  # After dimensionality reduction, six features were selected for cluster analysis
    X = np.array(df)  # Prepare sklearn cluster. Kmeans model data
    print("Shape of cluster data:", X.shape)

    # KMeans cluster analysis (sklearn.cluster.KMeans)
    nCluster = 4
    kmCluster = KMeans(n_clusters=nCluster).fit(X)  # Establish the model and cluster, and set K=2
    print("Cluster centers:\n", kmCluster.cluster_centers_)  # The coordinates of the center of each cluster are returned
    print("Cluster results:\n", kmCluster.labels_)  # Returns the classification result of the sample set

    # Sorting clustering results
    listName = dfData['region'].tolist()  # Convert the first column 'region' of dfData to listName
    dictCluster = dict(zip(listName,kmCluster.labels_))  # Associate listName with clustering results to form a dictionary
    listCluster = [[] for k in range(nCluster)]
    for v in range(0, len(dictCluster)):
        k = list(dictCluster.values())[v]  # The classification of the v-th city is k
        listCluster[k].append(list(dictCluster.keys())[v])  # Add City v to class k
    print("\n Cluster analysis results(Divided into{}class):".format(nCluster))  # Returns the classification result of the sample set
    for k in range(nCluster):
        print("The first {} Class:{}".format(k, listCluster[k]))  # Displays the results of class k

    return

if __name__ == '__main__':
    main()
5.3 program operation results
   region    x1   x2   x3    x4   x5   x6     x7    x8    x9    x10
0  Beijing 5.96  310  461  1557  931  319  44.36  2615  2.20  13631
1  Shanghai 3.39  234  308  1035  498  161  35.02  3052  0.90  12665
2  Tianjin 2.35  157  229   713  295  109  38.40  3031  0.86   9385
3  Shaanxi 1.35   81  111   364  150   58  30.45  2699  1.22   7881
4  Liaoning 1.50   88  128   421  144   58  34.30  2808  0.54   7733
Shape of cluster data: (30, 10)
Cluster centers:
 [[ 1.52987871  2.10479182  1.97836141  1.92037518  1.54974999  1.50344182
   1.13526879  1.13595799  0.83939748  1.38149832]
 [-0.32558635 -0.28230636 -0.28071191 -0.27988803 -0.28228409 -0.28494074
   0.01965142  0.09458383 -0.26439737 -0.31101153]
 [ 4.44318512  3.9725159   4.16079449  4.20994153  4.61768098  4.65296699
   2.45321197  0.4021476   4.22779099  2.44672575]
 [ 0.31835808 -0.56222029 -0.54985976 -0.52674552 -0.33003935 -0.26816609
  -2.60751756 -2.51932966  0.35167418  1.28278289]]
Cluster results:
 [2 0 0 1 1 1 1 1 1 1 1 1 1 1 1 1 1 1 1 1 1 1 1 1 3 1 1 1 1 3]

Cluster analysis results(Divided into 4 categories):
Class 0:['Shanghai', 'Tianjin']
Category 1:['Shaanxi', 'Liaoning', 'Jilin', 'Heilongjiang', 'Hubei', 'Jiangsu', 'Guangdong', 'Sichuan', 'Shandong', 'Gansu', 'Hunan', 'Zhejiang', 'Xinjiang', 'Fujian', 'Shanxi', 'Hebei', 'Anhui', 'Yunnan', 'Jiangxi', 'Hainan', 'Inner Mongolia', 'Henan', 'Guangxi', 'Ningxia', 'Guizhou']
Category 2:['Beijing']
Category 3:['Tibet', 'Qinghai']
Copyright description:
The case problem in this paper comes from: Si Shoukui, sun Zhaoliang, mathematical modeling algorithm and application (2nd Edition), National Defense Industry Press.
The content and routines of this article are original by the author and are not reprinted from books or online content.
Original works of YouCans
Copyright 2021 YouCans, XUPT
Crated: 2021-05-09