Excel is a powerful spreadsheet application running in Windows environment. An Excel spreadsheet is called a workbook, and a workbook is saved in a file with the extension. xlsx. Each workbook can contain multiple tables (worksheets) the table currently viewed by the user (or the last table viewed before closing) is called the active table. Each table has rows (numbers) and columns (letters)
Openpyxl module, a third-party module, allows Python programs to read and modify Excel. The following figure lists the functional matrix of other table processing. It can be seen that openpyxl is comprehensive, so I chose this third-party module as the learning object.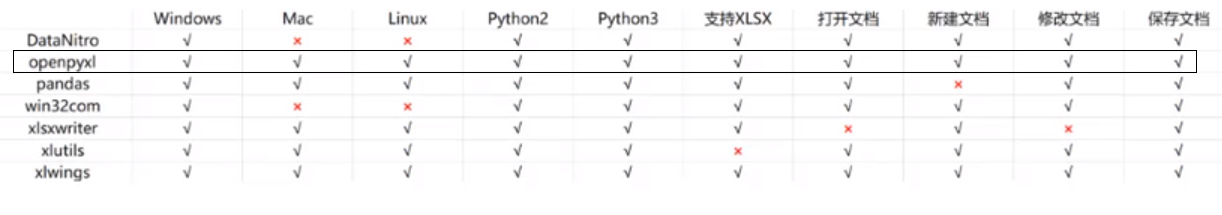
openpyxl processing Excel tables
Installing the module
pip install openpyxl#Light and loose
Read Excel document
- Open Excel document with openpyxl module
import openpyxl
wb=openpyxl.load_workbook('example.xlsx')
openpyxl.load_ The Workbook () function takes the file name and returns a value of the workbook data type. The workbook object represents the Excel file (that is, the Workbook)
Get sheet from Workbook
Each worksheet under the worksheet is represented by a worksheet object, which can be represented by the workbook variable.get_sheet_by_name() passes in the worksheet name string to get the current version of the workbook object ["worksheet name"]
import openpyxl
wb=openpyxl.load_workbook('example.xlsx')
sheet=wb["Sheet1"]   obtain Sheet1 Worksheet object
You can also use get_active_sheet() gets the active sheet object
worksheet.active Get active sheet object
worksheet.title , the title property gets the name of the sheet
sheet2=wb.active#Get activity table object
Get a list of all sheet names
wb.sheetnames#Get a list of all sheet names
Get cells from table
With the Worksheet object, you can access the Cell object by name
The Cell object has a value attribute, which generally contains the values saved in this Cell
Cell objects also have row, column, and coordinate properties
Worksheet[cell location]. Value ------------- return the saved value of cell
Worksheet[cell location]. Row ------------- return the row of cell
Worksheet[cell location]. Column ------------ return the column of the cell
Worksheet[cell location]. coordinate ------ return the location of the cell (row + column)
When calling the cell() method of the table, row and column can be represented by numbers. The integer of the first row / column is 1, not 0
sheet.cell(row=1,column=2).value()#This represents the B1 object of the table. Row 1, column 2 are equal to sheet['B1 ']
The size of the table can be determined by the following two functions
sheet.get_highest_row() ාthe max value of the table's row
sheet.get_highest_column() ා the max value of the worksheet's column
The above two functions and have been deleted. Now the way to get the value of max is
sheet.max_row
sheet.max_column
Switching between column letters and numbers
Alphanumeric, calling openpyxl.cell.column_index_from_string() function
Number to letter, calling openpyxl.cell.get_column_letter() function
from openpyxl.cell import get_column_letter,column_index_from_string
get_column_letter(1)
'A'
column_index_from_string('A')#Index from string
1
- Get rows and columns from table
You can slice a Worksheet object to get all Cell cell objects in a row, column, or rectangular area of a spreadsheet
Sample table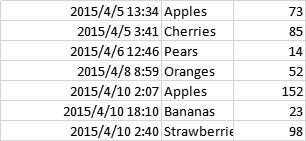
import openpyxl
wb=openpyxl.load_workbook('example.xlsx')
sheet=wb["Sheet1"]
for i in sheet['A1':'C3']:#section
    for n in i:
        print(n.coordinate,n.value)
    print("---next row----")
Results –
D:\recent\code\venv\Scripts\python.exe D:/recent/code/venv/XKCD.py
A1 2015-04-05 13:34:01.999997
B1 Apples
C1 73
---next row----
A2 2015-04-05 03:41:22.999998
B2 Cherries
C2 85
---next row----
A3 2015-04-06 12:46:50.999998
B3 Pears
C3 14
---next row----
Why do you need two layers of loops to print all cell values?
tuple(sheet['A1':'C3'])
Print results
((<Cell 'Sheet1'.A1>, <Cell 'Sheet1'.B1>, <Cell 'Sheet1'.C1>), (<Cell 'Sheet1'.A2>, <Cell 'Sheet1'.B2>, <Cell 'Sheet1'.C2>), (<Cell 'Sheet1'.A3>, <Cell 'Sheet1'.B3>, <Cell 'Sheet1'.C3>))
It is found that there are three tuples under the tuple, and each tuple inside represents a row
The first for loop gets the first row of three elements (< cell 'Sheet1'. A1 >, < cell 'Sheet1'. B1 >, < cell 'Sheet1'. C1 >)
The second for gets a single cell object under each row
Write to Excel document
openpyxl also provides methods for writing data, which means that programs can create and edit spreadsheet files
Create and save Excel documents
import openpyxl
wb=openpyxl.Workbook()

sheet=wb.active#Get activity table
sheet.title='box'#Worksheet rename
wb.save('bg.xlsx')#Save table
This creates a bg Workbook with a box worksheet under it
Create and delete worksheets
Create sheet create_sheet()
import openpyxl
wb=openpyxl.Workbook()
wb.create_sheet()#General pattern: create according to sheet1, sheet2, 3, 4
wb.create_sheet()
print(wb.sheetnames)
wb.create_sheet(index=0,title='dasheet')#Advanced mode: specify index location specify table name creation
print(wb.sheetnames)
The results are as follows
D:\recent\code\venv\Scripts\python.exe D:/recent/code/venv/biaoge.py
['Sheet', 'Sheet1', 'Sheet2']
['dasheet', 'Sheet', 'Sheet1', 'Sheet2']
Delete worksheetremove_ Sheet () method
#... followed by the above code
wb.remove(wb['dasheet'])
print(wb.sheetnames)
results of enforcement
['Sheet', 'Sheet1', 'Sheet2']
Write value to cell
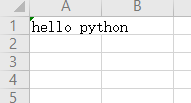
#Follow the above code
ws=wb['Sheet']
ws['A1']='hello python '
wb.save('hello.xlsx')
Set cell font style and type
Define cell font type and style to import openpyxl.styles The font module below, that is, font module. Font can pass in font name, font size, bold or italics
| Key parameters | data type | describe |
|---|---|---|
| name | character string | Font name, such as "Microsoft YaHei" |
| size | integer | font size |
| bold | Boolean | Bold or not |
| italic | Boolean | Italics or not |
from openpyxl.styles import Font
import openpyxl
wb=openpyxl.Workbook()
wb.create_sheet(index=0,title='Sheet1')
ws=wb['Sheet1']
ws['A1']='HELLO PYTHON'
ws['A1'].font=Font(size=50,bold=True)#Default font 50 bold
ws['A2']='HELLO PYTHON'
ws['A2'].font=Font(name='Microsoft YaHei ',size=50,bold=True)#YaHei 50 bold
wb.save('style.xlsx')
give the result as follows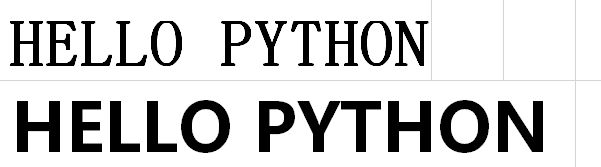
formula
The formula starts with an equal sign. You can configure cells to contain values calculated from other cells
In fact, it's similar to entering formulas in tables
For example, the following table shili.xlsx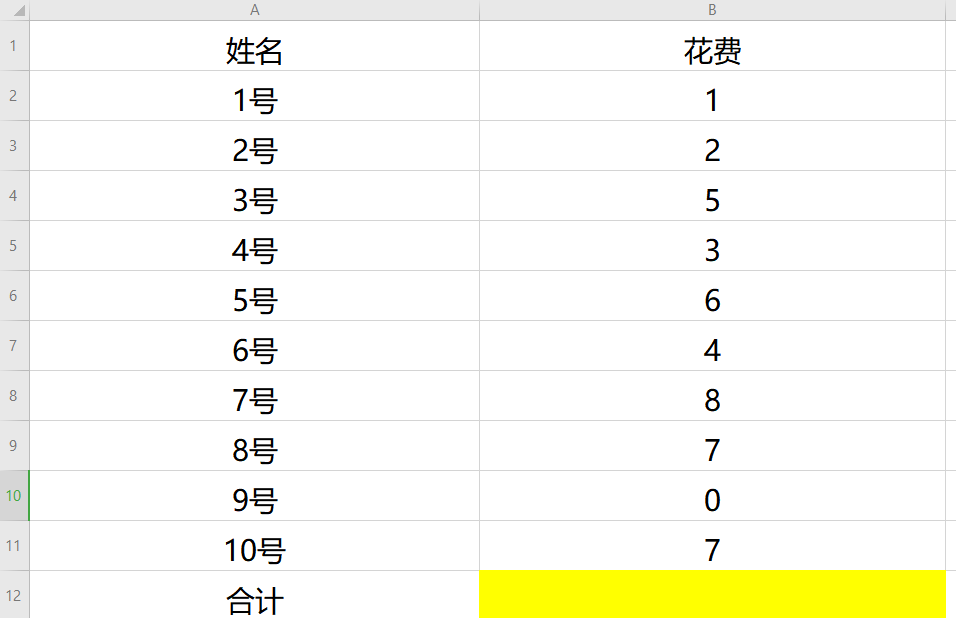
import openpyxl
wb=openpyxl.load_workbook('shili.xlsx')
ws=wb['Sheet']
ws['B12']='=SUM(B2:B11)'
wb.save('shili-copy.xlsx')
give the result as follows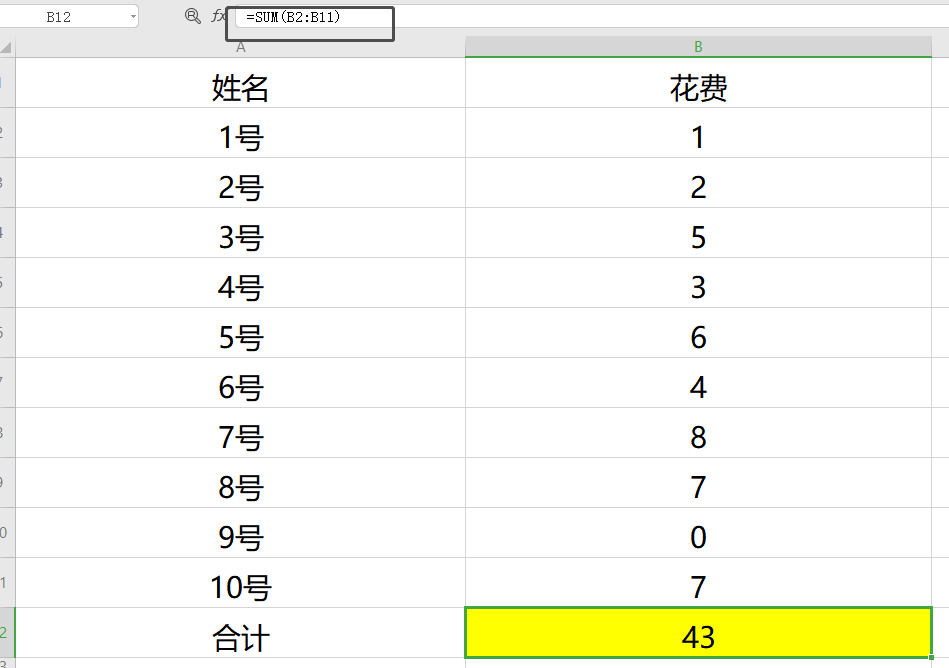
In fact, it's just to add a formula to the table and operate inside the table. At this time, if I print the value of B12, what's the result?
print(ws['B12'].value)
give the result as follows
=SUM(B2:B11)
If I want to get cell values instead of formulas, I need to load_ Data for workbook()_ Only keyword set to True
import openpyxl
wb=openpyxl.load_workbook('shili-copy.xlsx',data_only=True)
ws=wb['Sheet']
print(ws['B12'].value)
The result here is that I collapsed... Returned None for explanation
None
Adjust rows and columns
Set row height and column width
import openpyxl
wb=openpyxl.Workbook()
ws=wb.active
ws['A1']='Row height'
ws['B2']='Column width'
ws.row_dimensions[1].height=100#Set row height 100, specify row in brackets
ws.column_dimensions['B'].width=100#Set column width 100, specify column in brackets
wb.save('Set row height and column width.xlsx')
The result is as follows: because the column width is in character as the default unit and the row height is in point as the default unit, the sizes are different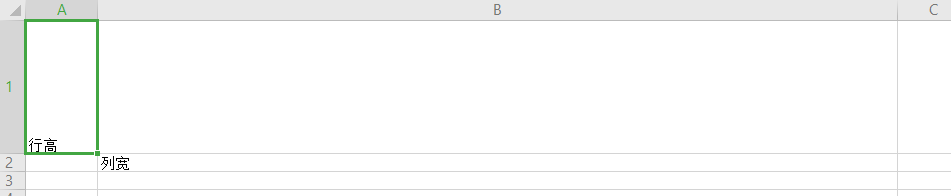
Merge and split cells
Merge cells: using merge_ Cell () worksheet method, you can merge cells in a rectangular area into one cell
import openpyxl
wb=openpyxl.Workbook()
ws=wb.active
ws['A1']='Row height'
ws.merge_cells('A1:B3')
wb.save('Set row height and column width.xlsx')
give the result as follows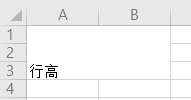
merge_ The cell () parameter is a string representing the cells in the upper left and lower right corners of the rectangular area to be merged
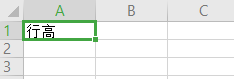
Split cell: Unmerge_ Cell () worksheet method
import openpyxl
wb=openpyxl.load_workbook('Set row height and column width.xlsx')
ws=wb.active
#ws['A1 '] =' row height '
ws.unmerge_cells('A1:B3')#
wb.save('Set row height and column width.xlsx')
Freeze Panes
Each worksheet object has a freeze_panes property, which can be set to a cell object or a string of cell coordinates
import openpyxl
wb=openpyxl.load_workbook('Set row height and column width.xlsx')
ws=wb.active
#ws['A1 '] =' row height '
ws.freeze_panes='B5'#First row and first four columns frozen
wb.save('Set row height and column width.xlsx')
It turns out like this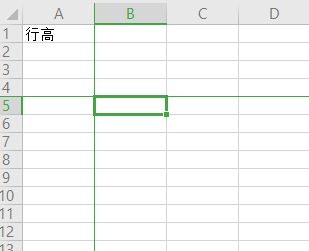
Chart
openpyxl supports the creation of bar, line, scatter and pie charts by using the data of cells in the worksheet
To create a chart, you need to do the following:
1 create a Reference object from a cell selected from a rectangular area
2 create a Series object by passing in a Reference object
3 create a Chart object, which is a blank Chart
4. Add Series object to Chart object to add data to blank Chart
5 optional: set the drowing.top , drowing.left , drowing.width and drowing.height ~Variables
These four variables represent the location (positioning) of the Chart object from the top and left, and the length and width of the Chart object, that is, the location and size of the Chart
The new version is through chart.width , chart.height Object to determine chart size
adopt sheet.add_ The Chart() function adds a Chart object to a Worksheet object and determines the location of the Chart
6 adding a Chart object to a Worksheet object
The reference object is created by calling openpyxl.charts.Reference() function with three or five parameters
Parameter 1: worksheet object
Parameter 2: tuple of two integers, representing the upper left cell of the rectangular selection area
Parameter 3: tuple of two integers, representing the cell at the lower right corner of the rectangular selection area
These three parameters divide the data covered by the chart
Parameters 2 to 5: min_col=1, min_row=1, max_col=1, max_row=10 indicates, respectively, the minimum column, the minimum row, the maximum column and the maximum row
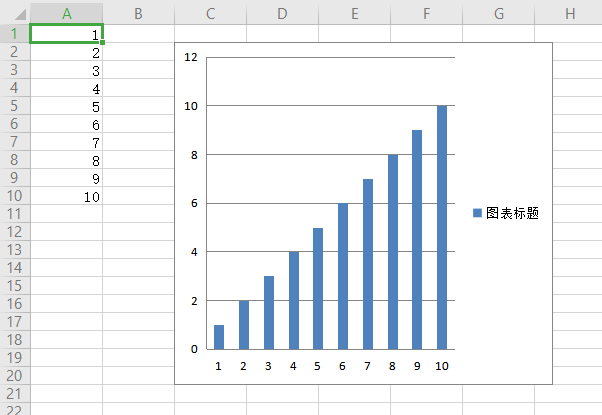
import openpyxl


wb = openpyxl.Workbook()
sheet = wb.active # Open the running table directly with active when the table name is unknown

# Enter some data in the first column of the table
for i in range(1, 11):
    sheet['A' + str(i)] = i
#It's all about creating tables
reference = openpyxl.chart.Reference(sheet, min_col=1, min_row=1, max_col=1, max_row=10)#Area of source data
series = openpyxl.chart.Series(reference, title='Chart title')
chart = openpyxl.chart.BarChart()#Generate a blank histogram

chart.append(series)#Add data and title

# Size of window
chart.width = 10
chart.height = 10

sheet.add_chart(chart, 'C2') # window position
wb.save('Chart.xlsx')
The results are as follows