cause
It's July 10th. It's time for college students to go home after the holiday. Our major went back later because of practical training. I went back later because of special circumstances. It happened that Tiezhu didn't go back either. Early in the morning, Tiezhu came to our dormitory with his head in his mouth...

Tiezhu: all gone? (tentative inquiry implies the person in the dormitory)
Feixue: No, (sticking his head out of the curtain on the bed)
Fertilizer science: wc!Iron pillar, what's the matter with your aunt's pain
 Tiezhu: my best underwear (underpants) is gone. Have you seen it
 Feixue: who looks at your stuff? I haven't seen it! (he then leaves)
. . .
Then at more than 3 p.m., suddenly:
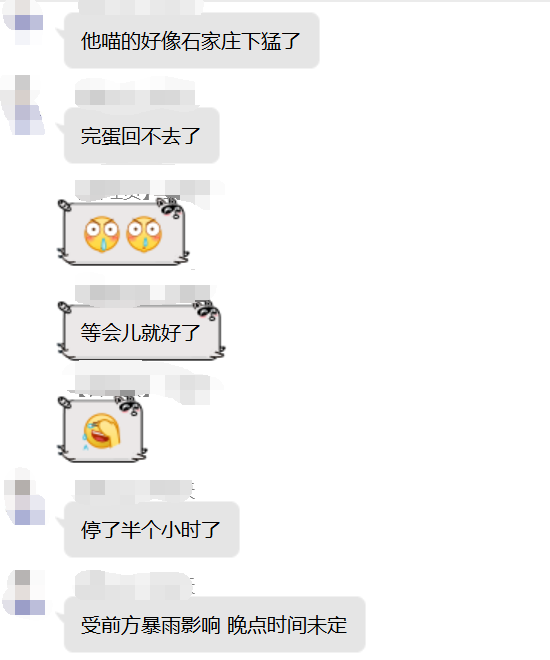
I really sweated for him when I was worried.... Wait, iron pillar's underpants. Is there any internal relationship between them in case of rainstorm?
Do you think underwear is the retribution for his bad stealing?
Then I launched an investigation
Survey (using crawler + data analysis and visualization)
thinking
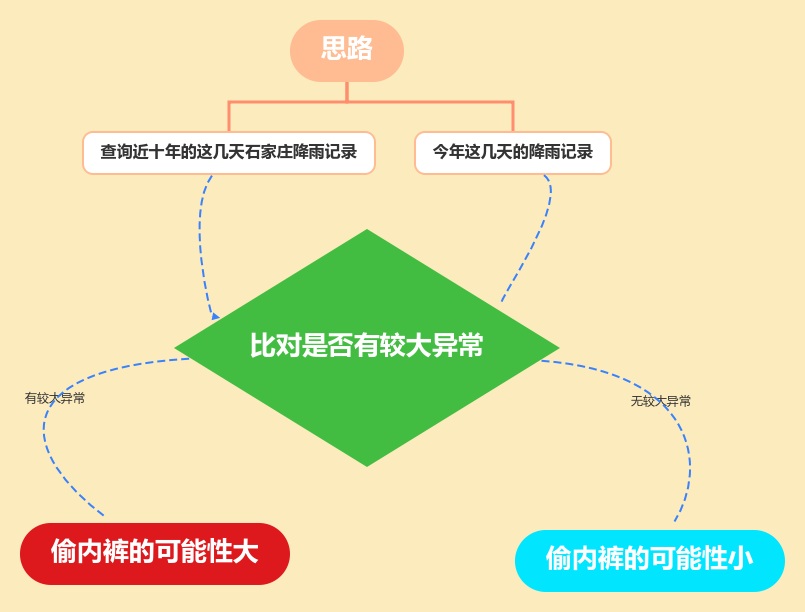
Just do it
Reptiles have been crawling for nearly ten years. The weather in Shijiazhuang in recent days
Let's start with the library we're going to use
import requests  # Request and data acquisition for URL
import time  # Pause for time
import random  # For generating random numbers
import pandas as pd  # For data export
import re  # Use for regular expressions
Next, let's build a camouflage request header, which is one of the common means of reptiles
headers = {
    'Accept': '*/*',
    'Accept-Encoding': 'gzip, deflate',
    'Accept-Language': 'zh-CN,zh;q=0.9',
    'Connection': 'keep-alive',
    'Cookie': 'widget_dz_id=54511; widget_dz_cityValues=,; timeerror=1; defaultCityID=54511; defaultCityName=%u5317%u4EAC; Hm_lvt_a3f2879f6b3620a363bec646b7a8bcdd=1516245199; Hm_lpvt_a3f2879f6b3620a363bec646b7a8bcdd=1516245199; addFavorite=clicked',
    'User-Agent': 'Mozilla/5.0 (Windows NT 6.1; WOW64) AppleWebKit/537.36 (KHTML, like Gecko) Chrome/63.0.3236.0 Safari/537.36'
}
The acquisition method is also very simple. In this link Click to enter the page
Then - right click - if you are Google browser, click Check to appear
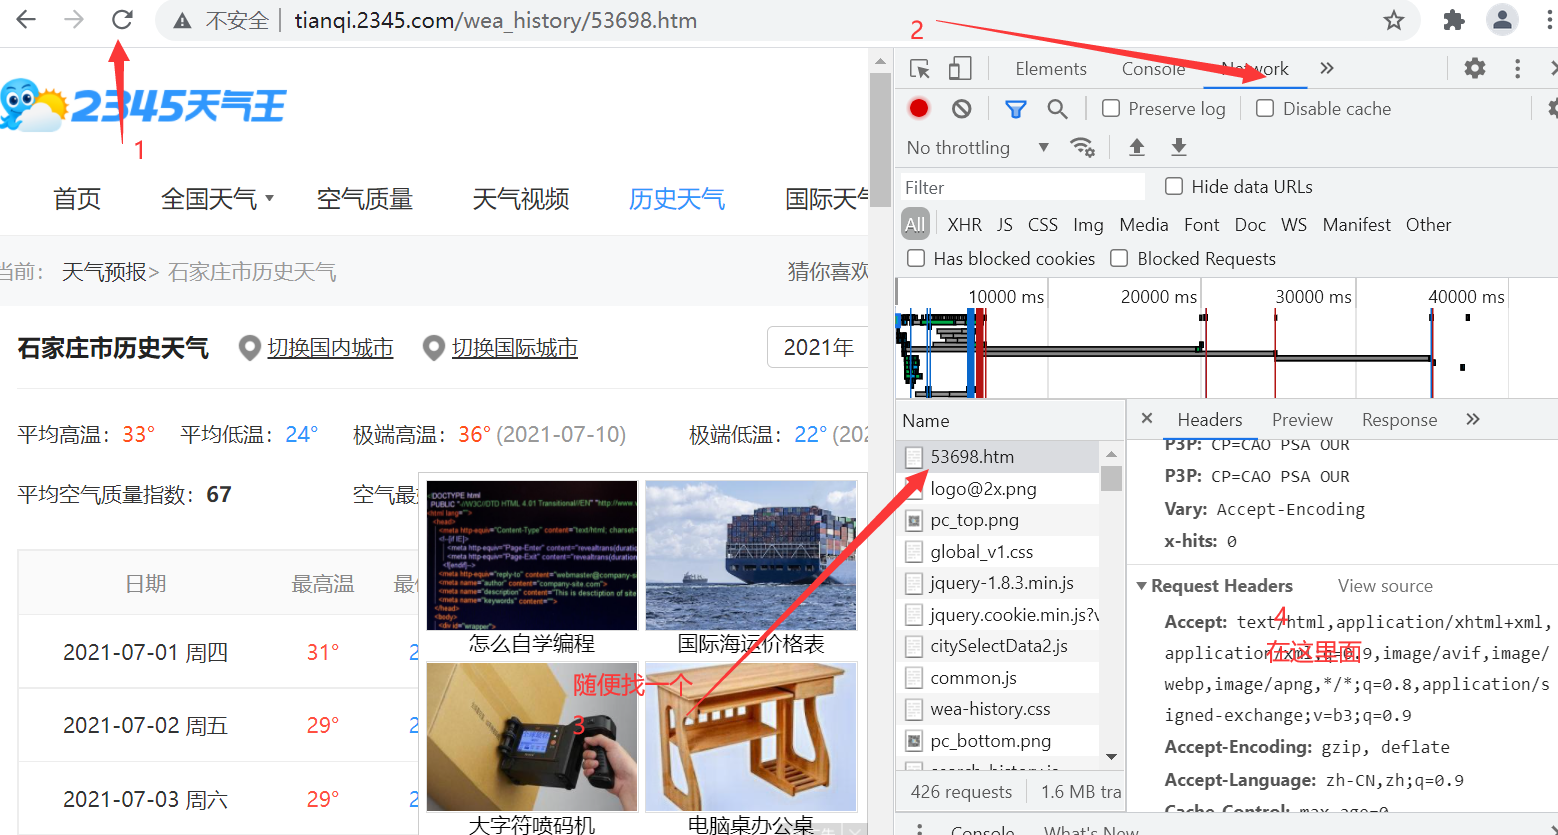
The purpose of forging the request header is to make the website think that it is a normal user requesting data, not a crawler, and does not refuse your request.
Then we go to get the file link for storing historical weather data. After analysis, the link before 2016 is: ' http://tianqi.2345.com/t/wea_history/js/58362_%s%s.js '% (year, month) in this form, there is a little difference in the later links. Fertilizer science is directly put together
urls = []
for year in range(2012, 2022):  # From 2011 to 2017
    for month in range(7, 8):  # Traverse from January to December
        # The links used from 2011 to 2016 are slightly different from those in 2017 and need to be processed by branches
        if year <= 2016:
            urls.append('http://tianqi.2345.com/t/wea_history/js/58362_%s%s.js' % (year, month))
        else:
            # In the months of 2017, there is a number 0 in front of January to September, which needs branch processing
            if month < 10:
                urls.append('http://tianqi.2345.com/t/wea_history/js/%s0%s/53698_%s0%s.js' % (year, month, year, month))
            else:
                urls.append('http://tianqi.2345.com/t/wea_history/js/%s%s/53698_%s%s.js' % (year, month, year, month))
Sure enough, the data is in json format:
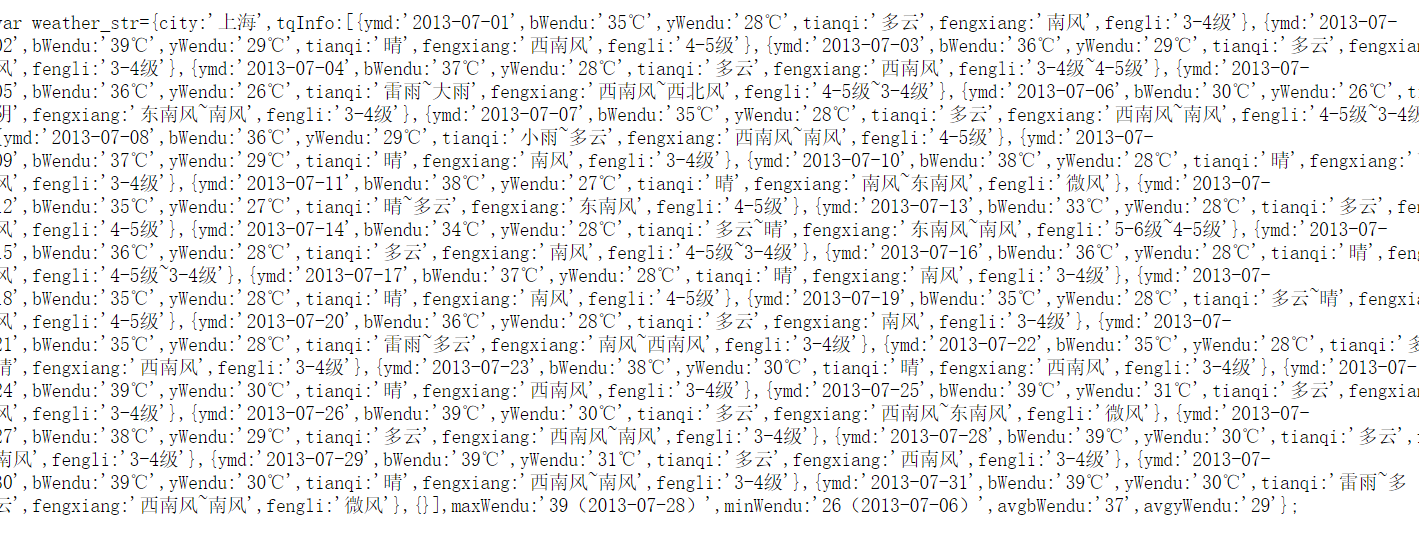
Then we use regular matching to get the value we want (if not regular, you can learn from the website recommended by this link: link)
for url in urls:
    print(url)
    seconds = random.randint(1, 6)  # For each cycle, an integer between 3 and 6 is randomly generated
    response = requests.get(url, headers=headers).text  # Send a url linked request and return the response data
    ymd = re.findall("ymd:'(.*?)',", response)  # Get date data using regular expressions
    high = re.findall("bWendu:'(.*?)℃',", response)  # Get the maximum temperature data by regular expression
    low = re.findall("yWendu:'(.*?)℃',", response)  # Get the minimum temperature data by regular expression
    tianqi = re.findall("tianqi:'(.*?)',", response)  # Get weather data using regular expressions
    fengxiang = re.findall("fengxiang:'(.*?)',", response)  # Get wind direction data by regular expression
    fengli = re.findall(",fengli:'(.*?)'", response)  # Get wind data using regular expressions
    aqi = re.findall("aqi:'(.*?)',", response)  # Obtaining air quality index data by regular expression
    aqiInfo = re.findall("aqiInfo:'(.*?)',", response)  # Get air quality description data with regular expression
    aqiLevel = re.findall(",aqiLevel:'(.*?)'", response)  # Regular expression to obtain air quality level data
A simple non greedy algorithm finds the data I want in each url, and then we simply split the data to get the data of the whole July. We only need the data in recent days, so we have the following operations
# Since there is no data related to air quality from 2011 to 2015, it needs to be processed separately
if len(aqi) == 0:
aqi = None
aqiInfo = None
aqiLevel = None
df=pd.DataFrame(
{'ymd': ymd, 'high': high, 'low': low, 'tianqi': tianqi, 'fengxiang': fengxiang, 'fengli': fengli,
'aqi': aqi, 'aqiInfo': aqiInfo, 'aqiLevel': aqiLevel})
df.drop(index=[i for i in range(0,8)],inplace=True)#Delete matching redundant data
df.drop(index=[i for i in range(14,31)],inplace=True)
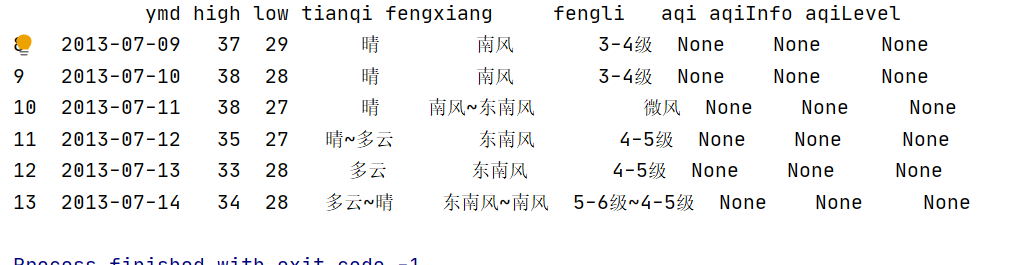
print(df)
info.append(df)
else:
df = pd.DataFrame(
{'ymd': ymd, 'high': high, 'low': low, 'tianqi': tianqi, 'fengxiang': fengxiang, 'fengli': fengli,
'aqi': aqi, 'aqiInfo': aqiInfo, 'aqiLevel': aqiLevel})
df.drop([i for i in range(0,8)],inplace=True)
try:
df.drop([i for i in range(14,31)],inplace=True)
except:
print('2021 year\n\n')
print(df)
info.append(df)
Introduce PD DataFrame. Drop usage
pd.DataFrame is well known. You can mine common data frames and other functions to increase your learning ability. I often use it to draw pictures or convert dictionary type data into row and column type data. See the details below
Usage: DataFrame.drop(labels=None,axis=0, index=None, columns=None, inplace=False)
#Parameter description


labels Is the name of the row and column to be deleted, given in the list
axis The default value is 0, which means that the row is deleted, so it is deleted columns To specify when axis=1;
index Directly specify the row to delete
columns Directly specify the column to delete
inplace=False,By default, the deletion operation does not change the original data, but returns a new data after the deletion operation dataframe;
inplace=True,The original data will be deleted directly and cannot be returned after deletion.
Finally, merge and save the data
# Merge all the stored weather data to generate a data table
weather = pd.concat(info)
# Data export
weather.to_csv('weather.xlsx', index=False,encoding='gbk')
With the data, let's start decrypting the truth of this matter now
Data analysis and visualization
You can refer to the following methods: Dozens of cool visual data analysis websites you deserve
The analysis is performed on the data in Excel format obtained above, so we mainly use
import xlrd
Let's draw a pie chart first
Simple data processing
data=xlrd.open_workbook('weather.xlsx')#Read file data
table=data.sheet_by_name('weather')#sheet table named weather
tianshu=table.nrows-1#Because the first line is the header, it needs to be minus one
xiayv=0

#Pie chart
for i in range(1,tianshu):
    a = table.row(i)[3].value
    print(a)
    if a!='Sunny' and a!='cloudy' and a!='Sunny~cloudy' and a!='cloudy~Sunny':
        xiayv=xiayv+1

print(tianshu)
print(xiayv)
Input the data into the link platform above and draw it as shown in the figure below, which is the article "dozens of cool visual data analysis websites you deserve to have"
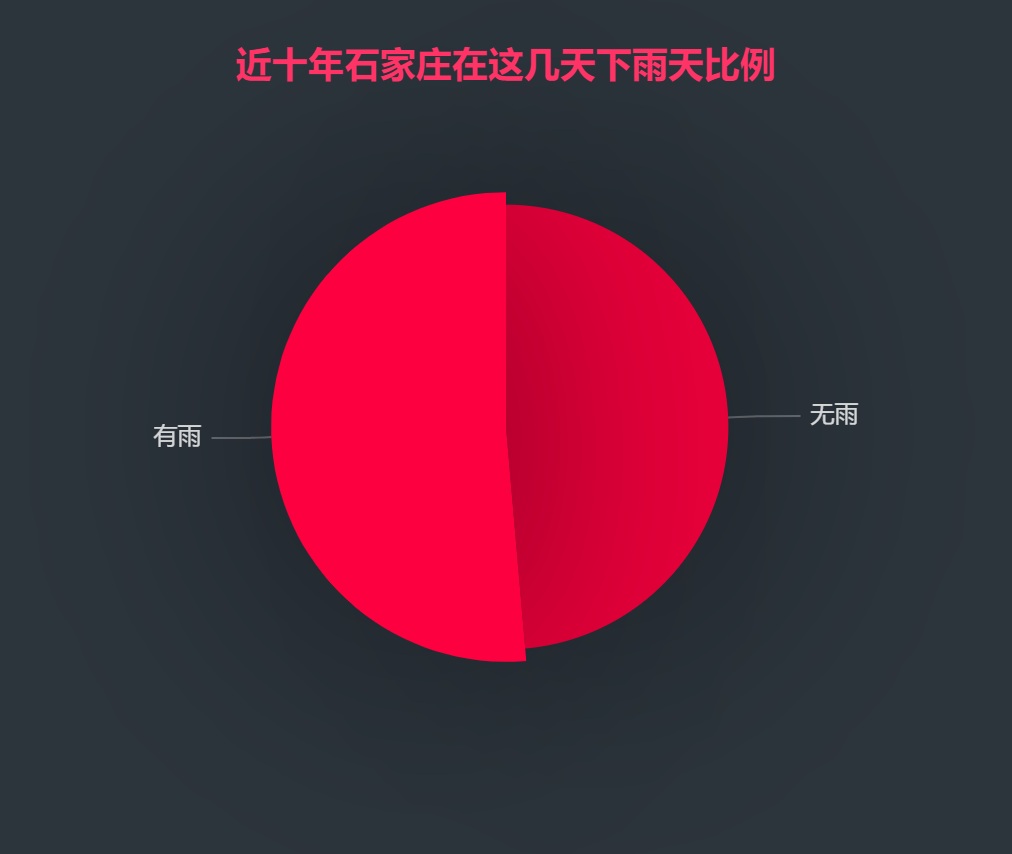
It can be seen intuitively that the proportion of rain is very high, and we will continue to analyze it.
Scatter diagram
This format is to conform to the data types given by the above platform
ri_wendu=[]
j=1
for i in range(1,tianshu):
    if i%7==0:
        j=1
        ri_wendu.append([j,table.row(i)[1].value])
        j=j+1
    else:
        ri_wendu.append([j,table.row(i)[1].value])
        j=j+1

print(ri_wendu)
This one is about temperature
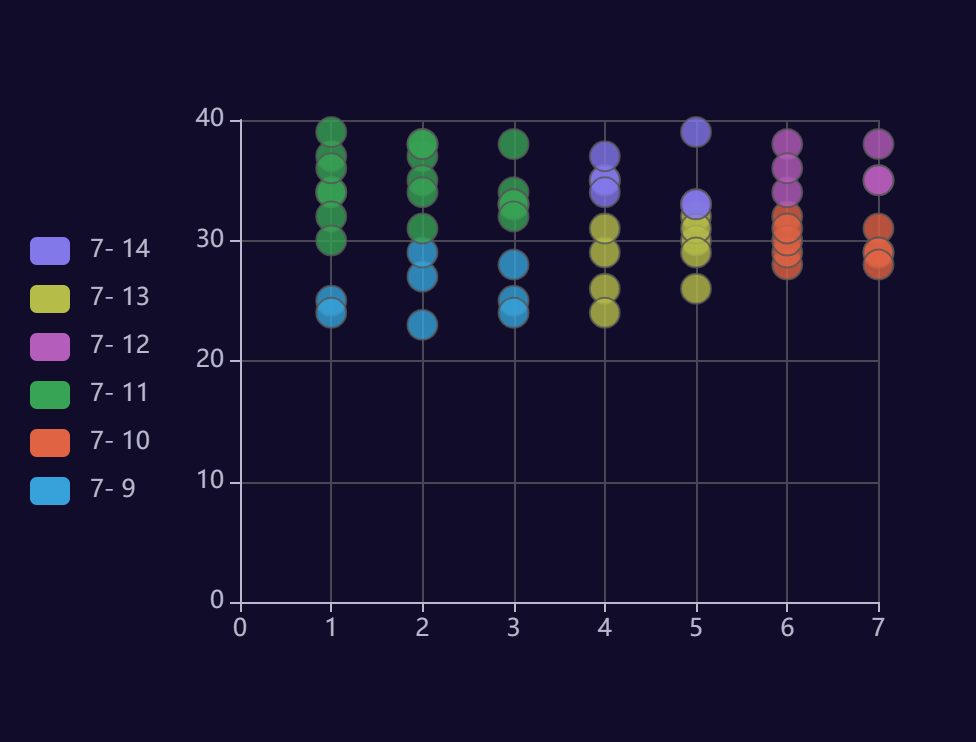
The weather of these days is acceptable in summer. There is nothing strange. Let's continue to analyze.
Word cloud and color can be set
Library to use
from matplotlib import colors
import jieba

import xlrd
from wordcloud import WordCloud
The use of the word cloud library is very simple. I won't talk about it. It's just setting the color. You may not be familiar with it. You can refer to it
f=open(r'tianqi.txt','r',encoding='utf-8')#Take out the wind direction and wind force from the above data
text=f.read()
cut_text = "".join(jieba.cut(text))
color_list=['#FF0000','#9955FF','#66FFFF']#Create color array
colormap=colors.ListedColormap(color_list)#call
#color_mask = cv2.imread("11.jpg")
word_cloud=WordCloud(
    font_path="msyh.ttc",
    background_color='black',
    mode="RGBA",
    prefer_horizontal=1,
    #mask=color_mask,
    height=200,
    width=200,
    scale=1,
    colormap=colormap,#Set color
    margin=5
)

word_cloud1=word_cloud.generate(cut_text)
word_cloud1.to_file('1.png')

print("Picture saved successfully")

It can be seen from the picture that the wind is quite small, but why is the rain so heavy??? Look down
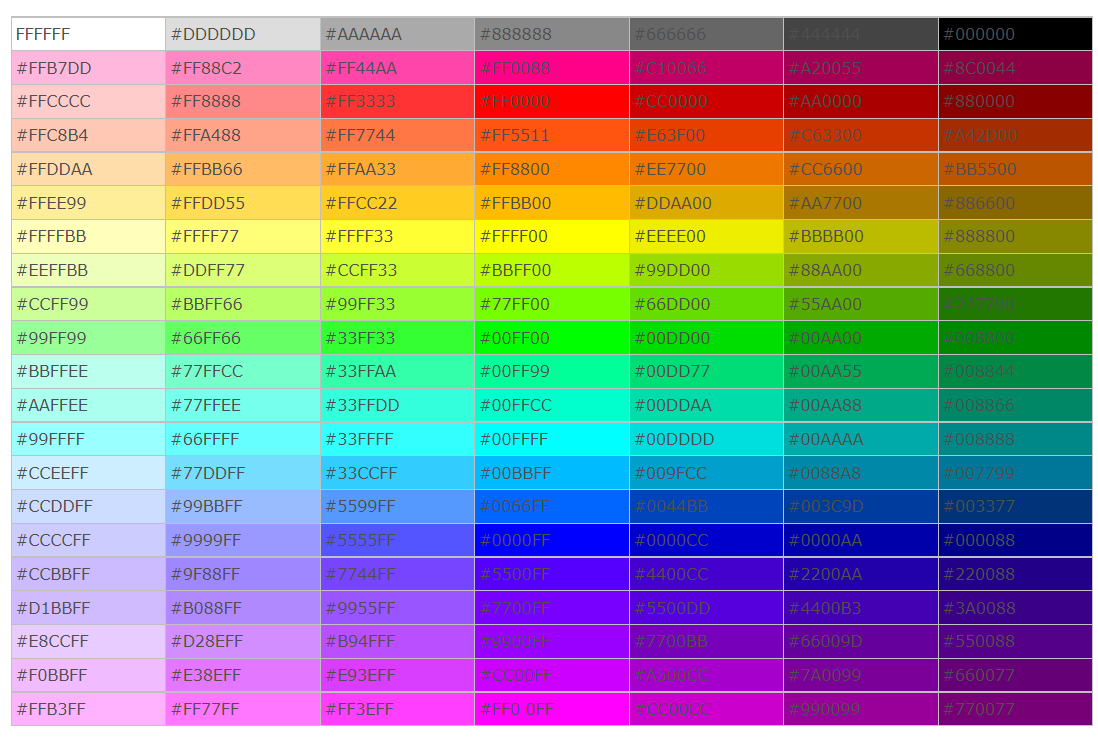
Set word cloud color card
FFFFFF #DDDDDD #AAAAAA #888888 #666666 #444444 #000000
#FFB7DD #FF88C2 #FF44AA #FF0088 #C10066 #A20055 #8C0044
#FFCCCC #FF8888 #FF3333 #FF0000 #CC0000 #AA0000 #880000
#FFC8B4 #FFA488 #FF7744 #FF5511 #E63F00 #C63300 #A42D00
#FFDDAA #FFBB66 #FFAA33 #FF8800 #EE7700 #CC6600 #BB5500
#FFEE99 #FFDD55 #FFCC22 #FFBB00 #DDAA00 #AA7700 #886600
#FFFFBB #FFFF77 #FFFF33 #FFFF00 #EEEE00 #BBBB00 #888800
#EEFFBB #DDFF77 #CCFF33 #BBFF00 #99DD00 #88AA00 #668800
#CCFF99 #BBFF66 #99FF33 #77FF00 #66DD00 #55AA00 #227700
#99FF99 #66FF66 #33FF33 #00FF00 #00DD00 #00AA00 #008800
#BBFFEE #77FFCC #33FFAA #00FF99 #00DD77 #00AA55 #008844
#AAFFEE #77FFEE #33FFDD #00FFCC #00DDAA #00AA88 #008866
#99FFFF #66FFFF #33FFFF #00FFFF #00DDDD #00AAAA #008888
#CCEEFF #77DDFF #33CCFF #00BBFF #009FCC #0088A8 #007799
#CCDDFF #99BBFF #5599FF #0066FF #0044BB #003C9D #003377
#CCCCFF #9999FF #5555FF #0000FF #0000CC #0000AA #000088
#CCBBFF #9F88FF #7744FF #5500FF #4400CC #2200AA #220088
#D1BBFF #B088FF #9955FF #7700FF #5500DD #4400B3 #3A0088
#E8CCFF #D28EFF #B94FFF #9900FF #7700BB #66009D #550088
#F0BBFF #E38EFF #E93EFF #CC00FF #A500CC #7A0099 #660077
#FFB3FF #FF77FF #FF3EFF #FF0 0FF #CC00CC #990099 #770077
Corresponding color
conclusion
Things gradually surfaced, and we can intuitively see from the above figure that the proportion of rain in recent ten years is still very high, so this may be a coincidence, and the underwear may not be taken by the roommate, but

I was just about to turn off the computer. When I went to sleep, a piece of data made me wake up instantly:

Although it rained a lot, it turned out to be a heavy rainstorm, and the case gradually blurred.

So I quickly called my roommate and asked him if he had collected his clothes when he left. As a result, he was really mistaken by my accurate calculation. When he left, he collected the clothes. I don't know if he received them wrong. They were all put in the wardrobe. I searched for them for a long time and found that there were not only a pair of flower underpants but also other unspeakable things in the cabinet. Ha ha ha. I quickly informed Tiezhu to have a look. The result was really good. Then I received the news that my roommate came home safely. I guess God must think his roommate should be punished for stealing underpants (we're not sure whether it's stealing underpants, so we think it's the wrong one)
Well, that's all for today's investigation. Welcome to subscribe Hand training project Let's make progress and learn knowledge together.
Finally, don't forget to praise the enthusiastic fat student!!! I sincerely hope that my roommate will not read this article.