Hello, it's a very common way to share your opinions by using charts in data display. This is one of the reasons why business intelligence dashboards such as Tableau and Power BI continue to be popular. These tools provide exquisite graphical interpretation of data.
Of course, these tools also have many disadvantages, such as they are not flexible enough for you to create your own design. When you need to customize the chart display, programming may be more suitable for you, such as Echarts and D3 js.
Today's article introduces you to a case of making visual reports with Python, mainly using Dash+Tailwindcss. If you like this article, remember to collect, like and pay attention to it. You can take your own code at the end of the text. Practicing it once is better than watching it countless times.
[note] there is a technical exchange group at the end of the text
Recommended articles
-
Someone made the Chinese version of Miss Wu Enda's machine learning and deep learning
-
Addicted, I recently gave the company a large visual screen (with source code)
-
So elegant, four Python automatic data analysis artifacts are really fragrant
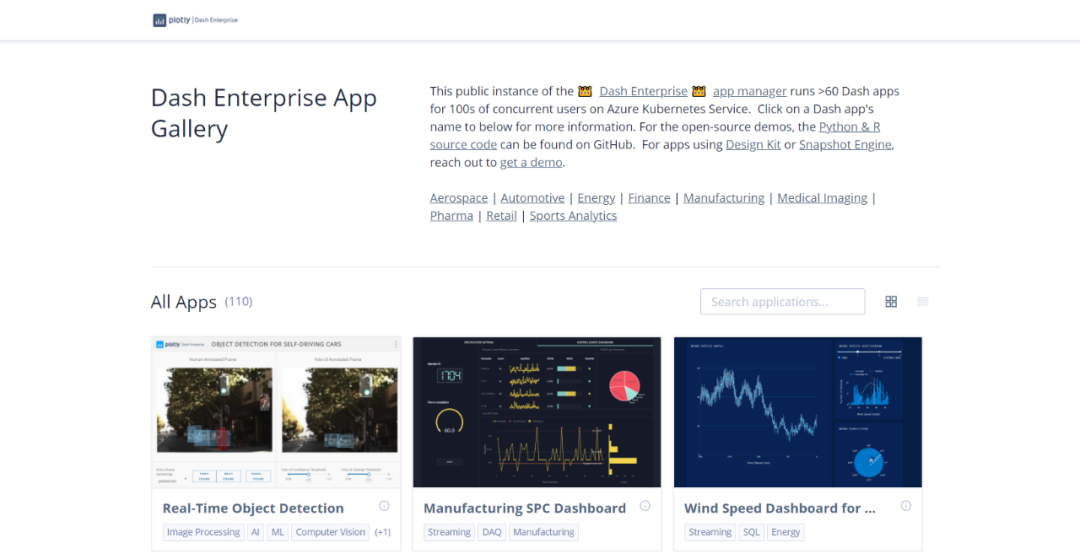
Dash is a dashborder framework based on Plotly and supports Python, R and Julia. With dash, you can create custom responsive dashboards.
Related documents
explain: https://dash.plotly.com/introduction
Case: https://dash.gallery/Portal/
Source code: https://github.com/plotly/dash-sample-apps/
Tailwindcss is a utility first CSS framework for quickly building custom interfaces.
"This framework is only applicable to the front end that can only realize the beautification elements of page layout without caring about the realization of business logic".
Look at what others think of it. It's enough for non interactive charts.
Related documents
explain: https://www.tailwindcss.cn/docs
GitHub: https://github.com/tailwindlabs/tailwindcss
Now let's explain how to build a visual report through Dash+Tailwindcss ~
First install the relevant Python libraries, and then import them.
import dash
import pandas as pd
import plotly.express as px
from dash import dcc, html
Three Python libraries, Pandas, Plotly and dash, are used.
We need to take the CDN of Tailwindcss as external_script and pass it to our application instance so that we can successfully use Tailwindcss.
# Import CDN of tailwindcss
external_script = ["https://tailwindcss.com/", {"src": "https://cdn.tailwindcss.com"}]

# Create a Dash instance
app = dash.Dash(
    __name__,
    external_scripts=external_script,
)
app.scripts.config.serve_locally = True
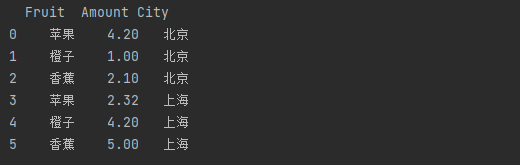
Use Pandas to create fruit sales data and make up a random one.
# Create data
df = pd.DataFrame(
    {
        "Fruit": ["Apple", "orange", "Banana", "Apple", "orange", "Banana"],
        "Amount": [4.2, 1.0, 2.1, 2.32, 4.20, 5.0],
        "City": ["Beijing", "Beijing", "Beijing", "Shanghai", "Shanghai", "Shanghai"],
    }
)

print(df)
The results are as follows: 3 columns and 6 rows, including fruit, sales and city columns.
Deal with the relevant data, such as single number of fruits, total sales, single number of cities and variable number.
# Fruit singular
fruit_count = df.Fruit.count()
# Total sales
total_amt = df.Amount.sum()
# City singular
city_count = df.City.count()
# Number of variables
variables = df.shape[1]
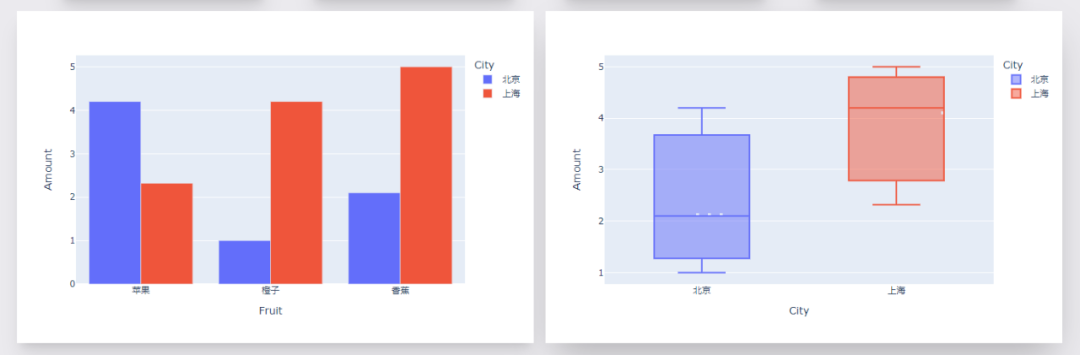
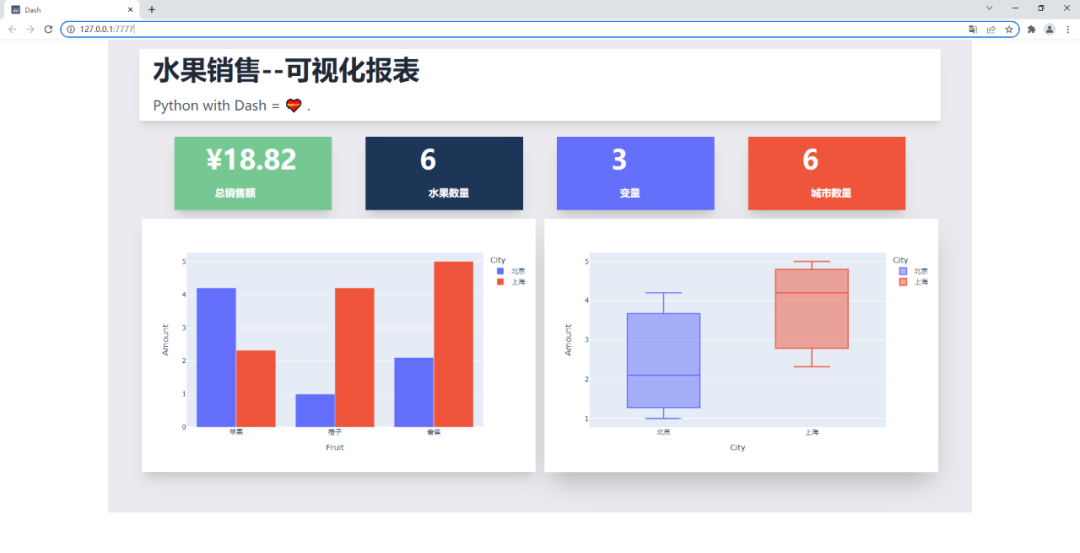
Create chart instances, including a bar chart and a box chart.
# Histogram 1, sales of different fruits in different cities
fig = px.bar(df, x="Fruit", y="Amount", color="City", barmode="group")

# Box Figure 1, sales distribution in different cities
fig1 = px.box(df, x="City", y="Amount", color="City")
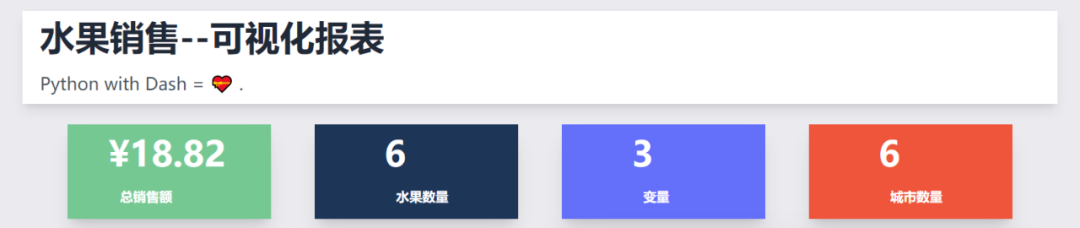
The effect is as follows.
The rest is the text module, text + CSS style.
Among them, typesetting and layout beautification are realized through Tailwindcss.
app.layout = html.Div(
    html.Div(
        children=[
            html.Div(
                children=[
                    html.H1(children="Fruit sales--Visual report", className=" py-3 text-5xl font-bold text-gray-800"),
                    html.Div(
                        children="""Python with Dash = 💝 .""",
                        className="text-left prose prose-lg text-2xl  py-3 text-gray-600",
                    ),
                ],
                className="w-full mx-14 px-16 shadow-lg bg-white -mt-14 px-6 container my-3 ",
            ),
            html.Div(
                html.Div(
                    children=[
                        html.Div(
                            children=[
                                f"¥{total_amt}",
                                html.Br(),
                                html.Span("Total sales", className="text-lg font-bold ml-4"),
                            ],
                            className=" shadow-xl py-4 px-14 text-5xl bg-[#76c893] text-white  font-bold text-gray-800",
                        ),
                        html.Div(
                            children=[
                                fruit_count,
                                html.Br(),
                                html.Span("Fruit quantity", className="text-lg font-bold ml-4"),
                            ],
                            className=" shadow-xl py-4 px-24 text-5xl bg-[#1d3557] text-white  font-bold text-gray-800",
                        ),
                        html.Div(
                            children=[
                                variables,
                                html.Br(),
                                html.Span("variable", className="inline-flex items-center text-lg font-bold ml-4"),
                            ],
                            className=" shadow-xl py-4 px-24 text-5xl bg-[#646ffa] text-white  font-bold text-gray-800",
                        ),
                        html.Div(
                            children=[
                                city_count,
                                html.Br(),
                                html.Span("Number of cities", className="text-lg font-bold ml-4"),
                            ],
                            className="w-full shadow-xl py-4 px-24 text-5xl bg-[#ef553b] text-white  font-bold text-gray-800",
                        ),
                    ],
                    className="my-4 w-full grid grid-flow-rows grid-cols-1 lg:grid-cols-4 gap-y-4 lg:gap-[60px]",
                ),
                className="flex max-w-full justify-between items-center ",
            ),
            html.Div(
                children=[
                    html.Div(
                        children=[
                            dcc.Graph(id="example-graph", figure=fig),
                        ],
                        className="shadow-xl w-full border-3 rounded-sm",
                    ),
                    html.Div(
                        children=[
                            dcc.Graph(id="example-graph1", figure=fig1),
                        ],
                        className="w-full shadow-2xl rounded-sm",
                    ),
                ],
                className="grid grid-cols-1 lg:grid-cols-2 gap-4",
            ),
        ],
        className="bg-[#ebeaee]  flex py-14 flex-col items-center justify-center ",
    ),
    className="bg-[#ebeaee] container mx-auto px-14 py-4",
)
The effect is as follows.
Finally, start the program code.
if __name__ == '__main__':
    # debug mode, port 7777
    app.run_server(debug=True, threaded=True, port=7777)
    # In normal mode, the debug button in the lower right corner of the page will not appear
    # app.run_server(port=7777)
In this way, you can see the visualization large screen page locally, and the browser opens the following address.
http://127.0.0.1:7777
The charts produced in the future can not only be displayed online, but also be updated in real time, which is true and good~
Well, this is the end of today's sharing. You can practice by yourself.
Code acquisition
The project code has been uploaded, and the background reply is below official account: fruit sales can be obtained.
Technical exchange
Welcome to reprint, collect, gain, praise and support!

At present, the interview technology exchange group has been opened, and the group has more than 2000 friends. The best way to add notes is: source + Interest direction, which is convenient to find like-minded friends
- Method ① send the following pictures to wechat, long press to identify, and the background replies: add group;
- Mode ②. Add micro signal: dkl88191, remarks: from CSDN
- WeChat search official account: Python learning and data mining, background reply: add group