Environment: macOS Monterey 12.2.1, Python 3. 10.2, Matplotlib 3.5.1
Catalog
Method 1: Modify the configuration file, global font modification
Method 2: rcParams settings, global font modification
Method 3: fontproperties setting, non-global font modification
Method 4: FontProperties settings, non-global font modifications
Method 1: Modify the configuration file, global font modification
Search for solutions to the network by copy ing fonts and modifying three texts of matplotlibrc. In most cases, the code will display Chinese correctly.
1. Terminal input command: python, enter the code into the Python interface to get the path to the configuration file where the Matplotlib package is located. For example, my name is: /Library/Frameworks/Python.framework/Versions/3.10/lib/python3.10/site-packages/matplotlib/mpl-data/matplotlibrc
import matplotlib
matplotlib.matplotlib_fname()     #Path to the configuration file where the output matplotlib package is located
 Get the path to the matplotlib package configuration file
2. Open the folder according to the first step to get the path. For example, my path is: /Library/Frameworks/Python.framework/Versions/3.10/lib/python3.10/site-packages/matplotlib/mpl-data/fonts/ttf
3. Download Chinese fonts on the Internet, such as SimHei.ttf (black), SimSun. ttf (Song Ti), YaHei. ttf (Microsoft Yahei). To ttf format, and install fonts.
4. Use text editing or sublime Text software to open the matplotlibrc file. (Location: /Library/Frameworks/Python.framework/Versions/3.10/lib/python3.10/site-packages/matplotlib/mpl-data/matplotlibrc)
(1) Found font.family: sans-serif, remove the top #.
(2) Found font.sans-serif:, remove the previous #, and add SimHei, SimSun, and Microsoft YaHei just now.
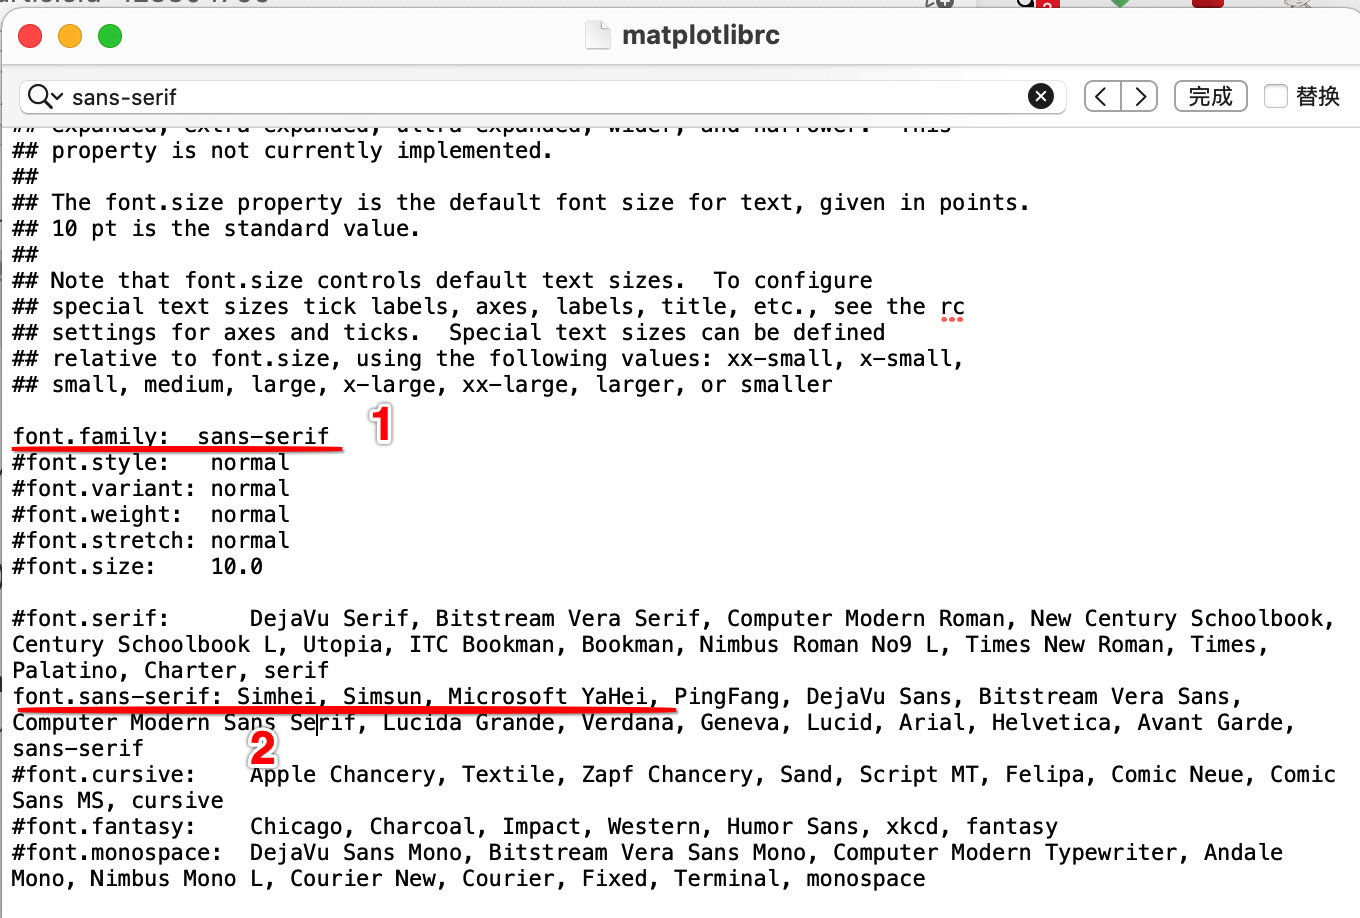 Modify font settings for matplotlibrc files
(3) Find axes.unicode_minus: True, remove the top # and change True to False.
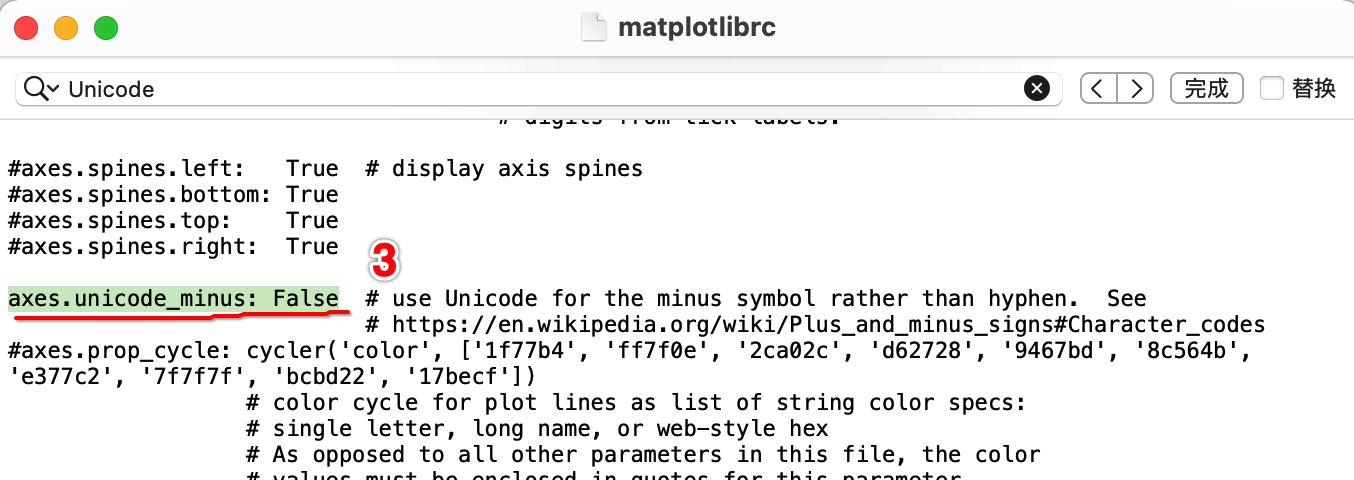 Modify axes settings for matplotlibrc files
4. Save and close the matplotlibrc file.
5. Open/Users/Username/. matplotlib folder, delete the files inside. I only have one fontlist-v330 in it. Json.
6. Most of the code in the future can display Chinese without any settings.
The Chinese title of the graphic drawn in the code below is displayed normally.
import matplotlib.pyplot as plt

input_values = [1, 2, 3, 4, 5, 6]
squares = [1, 4, 9, 16, 25, 36]
fig, ax = plt.subplots()
ax.plot(input_values, squares, linewidth=3)
ax.set_title("Square Value", fontsize=20)
ax.set_xlabel("value", fontsize=14)
ax.set_ylabel("square-value", fontsize=14)
ax.tick_params(axis='both', labelsize=14)
plt.show()
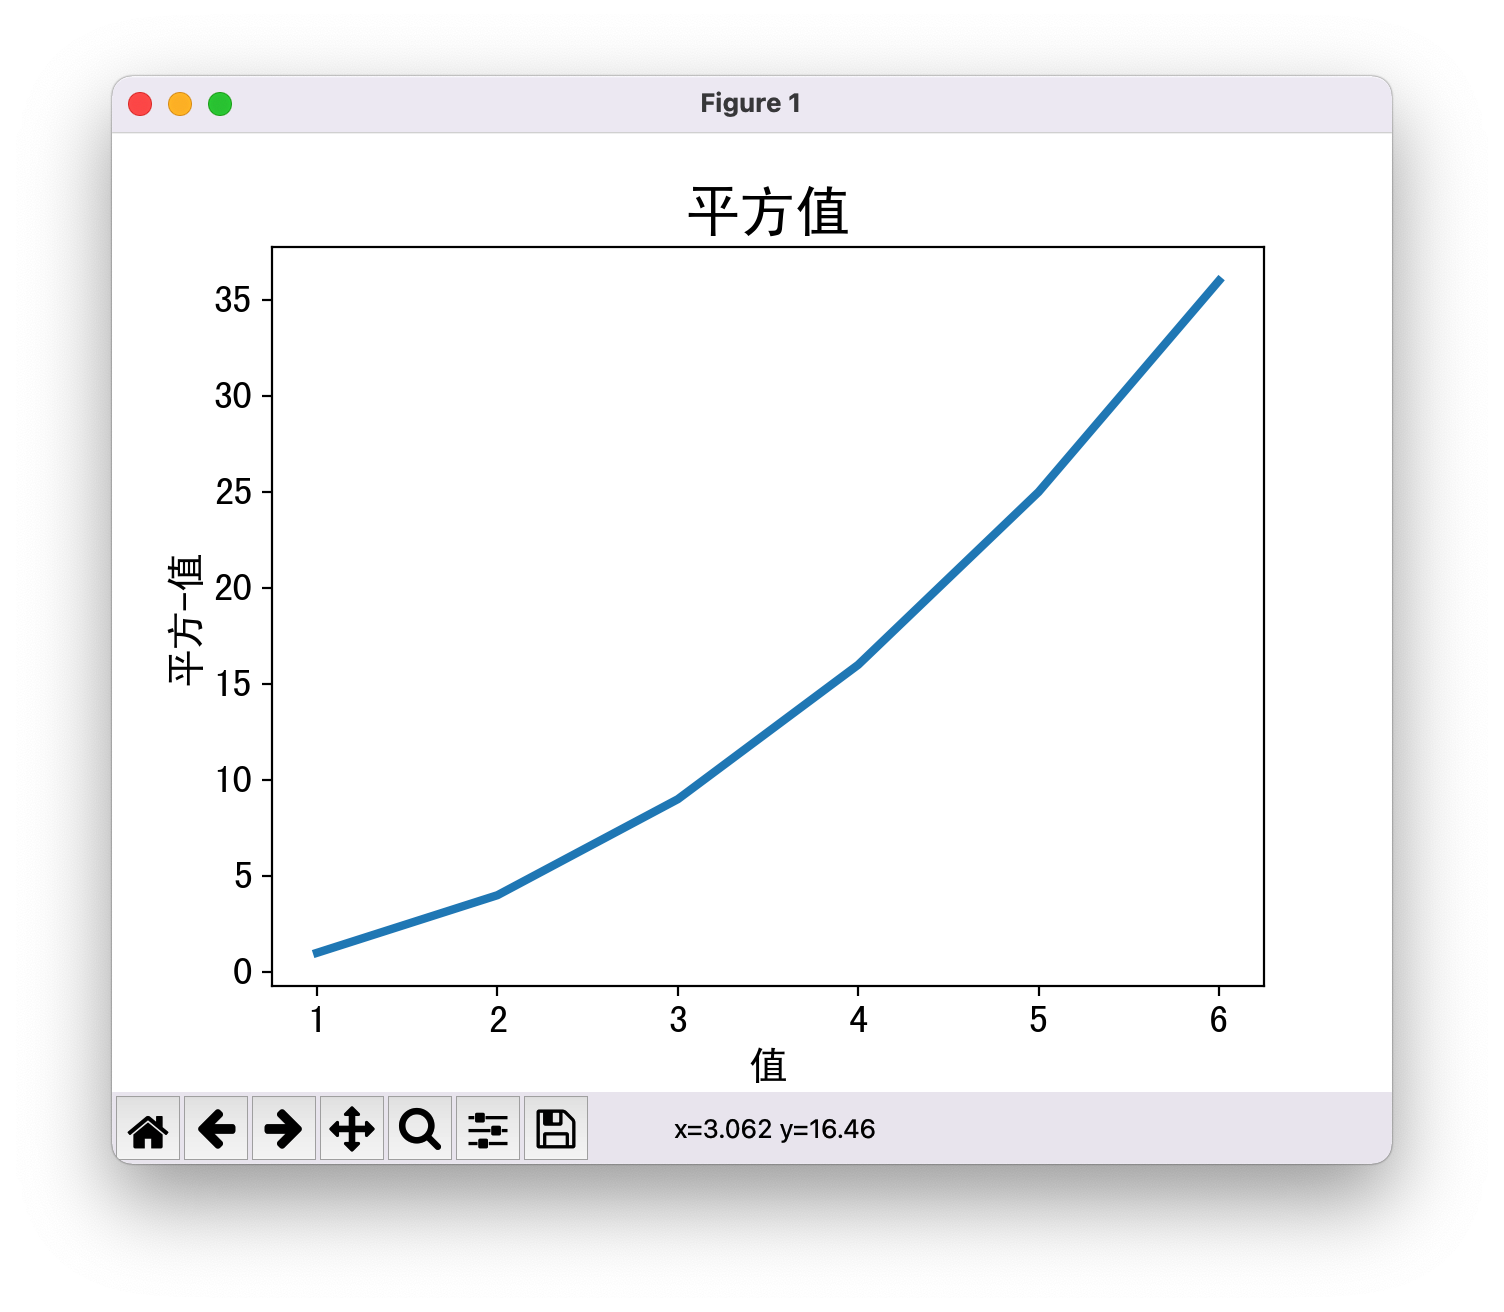 Chinese normal display
Exceptions
Although Method One modifies the global font settings by modifying the configuration file, the images drawn in the following scenarios do not display Chinese properly: Graphics in code use plt. Style. When use ('seaborn') is set.
It can be solved with method two.
import matplotlib.pyplot as plt
...
plt.style.use('seaborn')    #Add this sentence to the above code
fig, ax = plt.subplots()
...
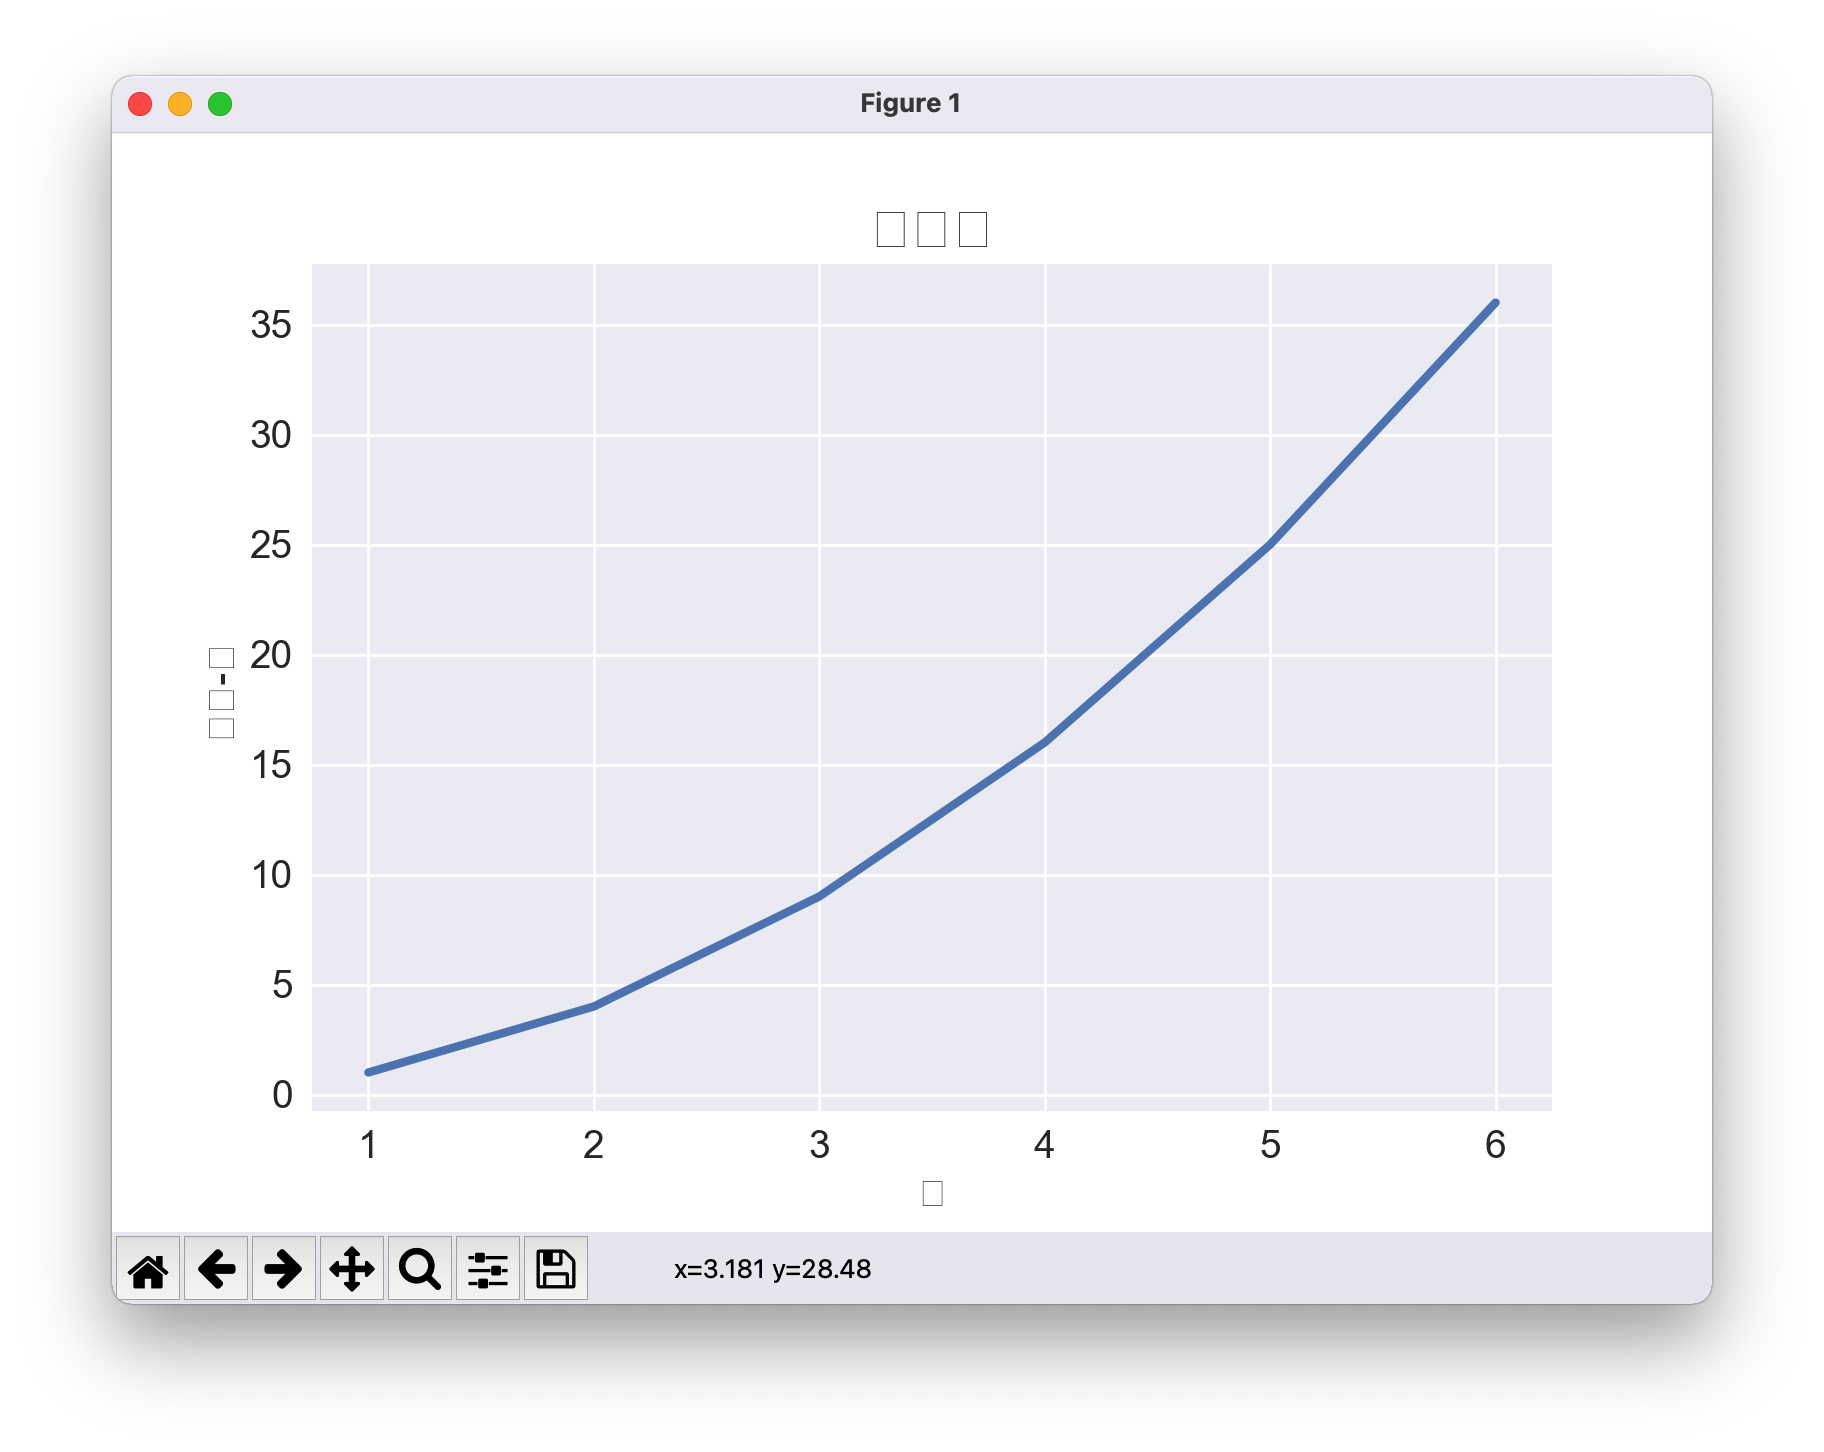 Chinese cannot be displayed properly
Method 2: rcParams settings, global font modification
1. In plt.style.use('seaborn') is followed by a font setting code to display the Chinese language. Font setting code must be followed by Seaborn code to take effect.
2. Font settings are only for this py file plt. Style. The code behind use ('seaborn') is valid if the following image uses something like plt.style.use('seaborn') statement, you also need to set the font code again.
import matplotlib.pyplot as plt #First, if you have already import ed this sentence, you may not want it.
...
plt.style.use('seaborn')
#Font setting code
plt.rcParams['font.sans-serif'] = 'Microsoft Yahei' #Display Chinese characters: SimHei black, simsum Song, Microsoft YaHei black. According to the fonts installed on the system, some can be used but not others, my three can be used.
plt.rcParams['axes.unicode_minus'] = False #Normal negative sign display
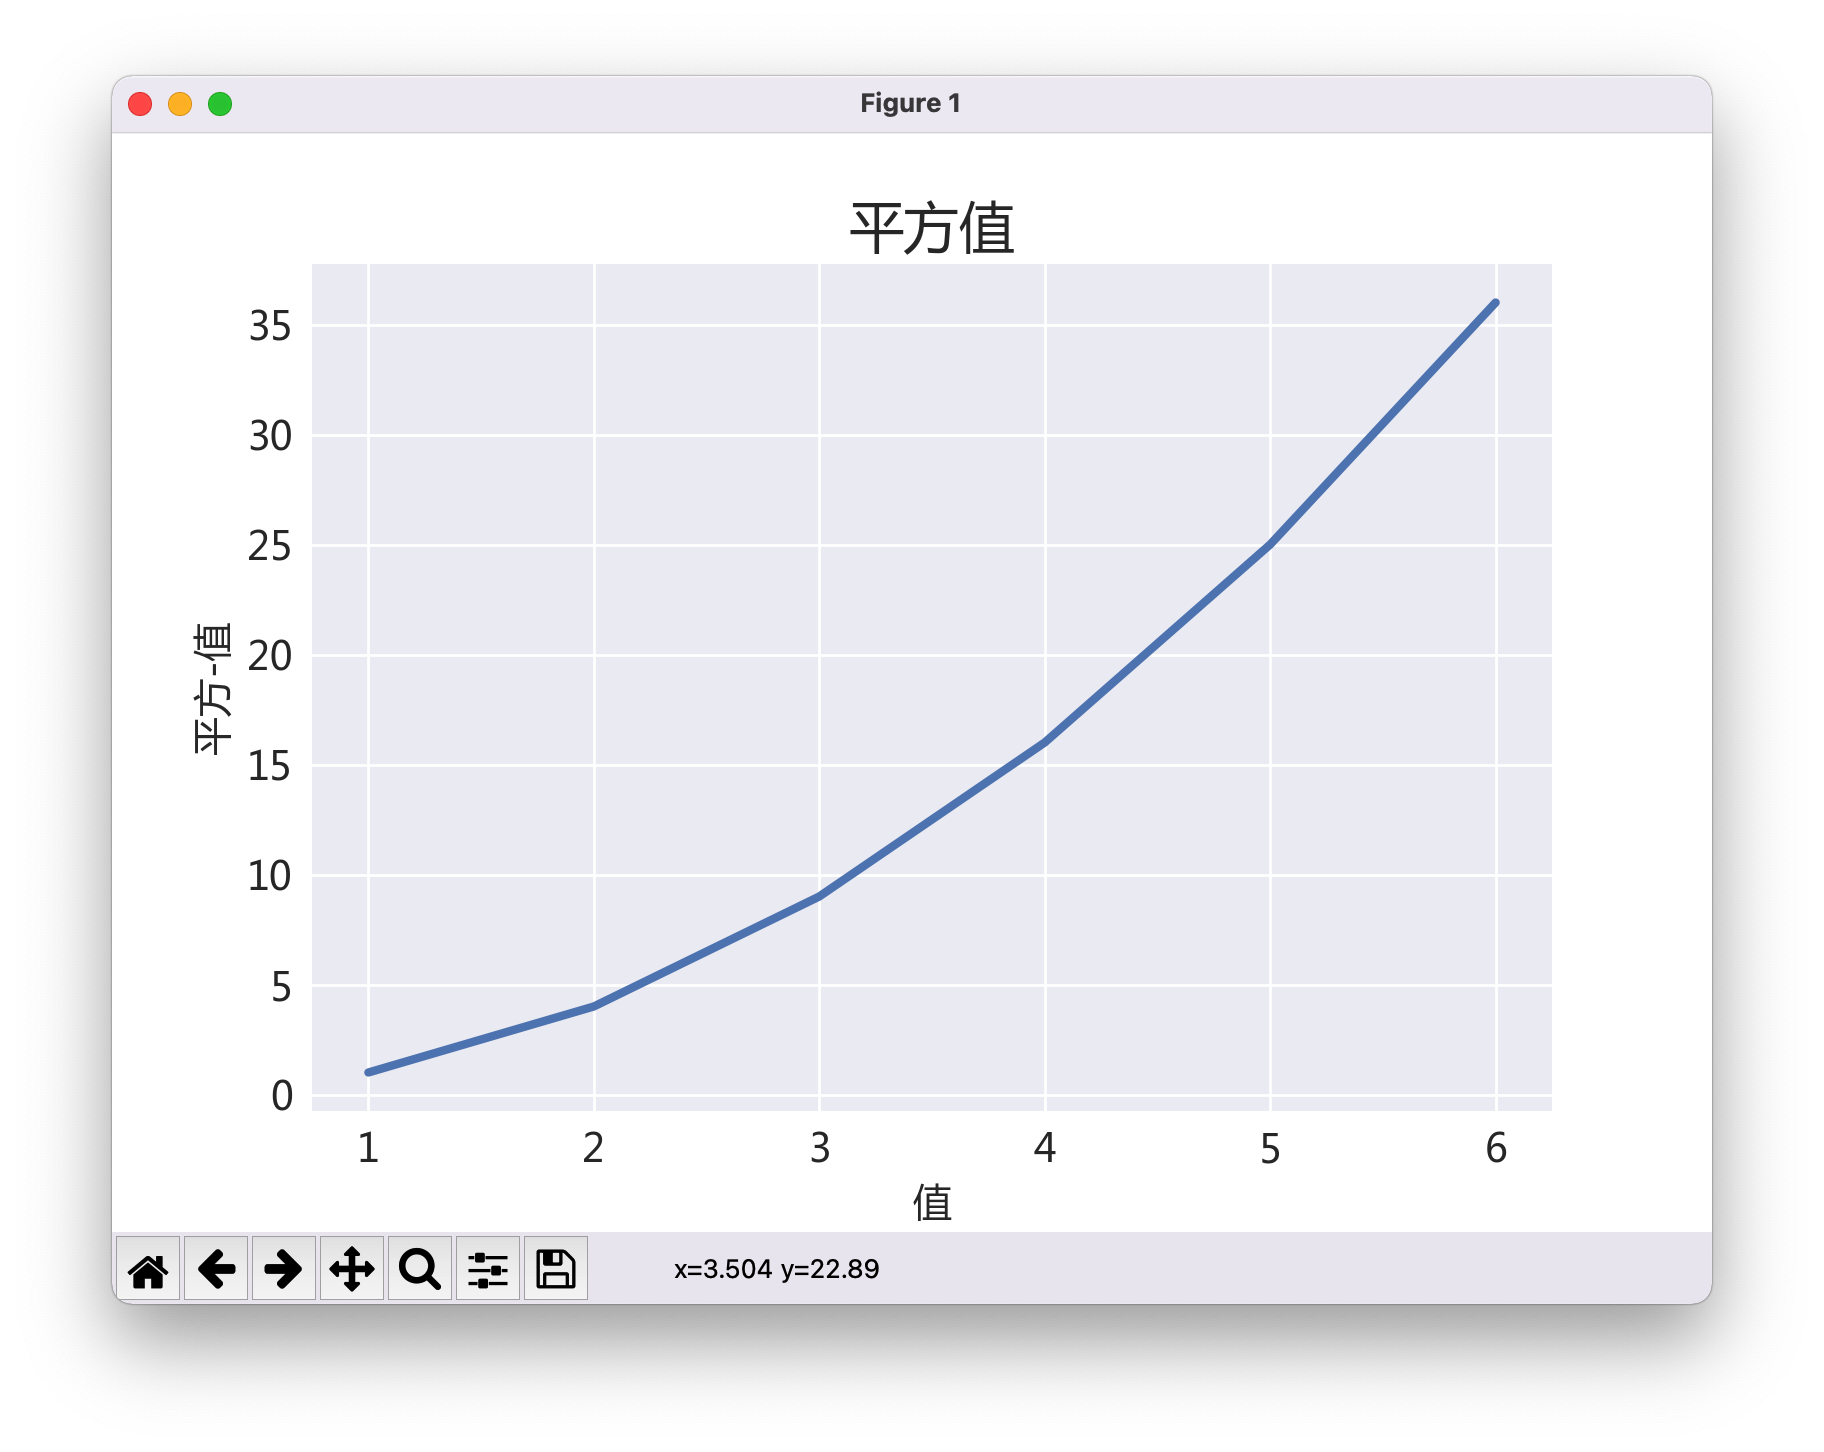 Chinese can be displayed normally again
Method 3: fontproperties setting, non-global font modification
1. In plt.title(), plt. Xlabel(), plt. In the ylabel() parameter setting, font properties are used to specify the font.
2. You can specify different fonts, but the fonts must be in ttf and installed.
import matplotlib.pyplot as plt

input_values = [1, 2, 3, 4, 5, 6]
squares = [1, 4, 9, 16, 25, 36]
plt.style.use('seaborn')
plt.plot(input_values, squares, linewidth=3)
plt.figure("Hello Test Chinese!",facecolor='lightgray')
plt.title("Test Chinese",fontsize=20,fontproperties="Microsoft Yahei")
plt.xlabel("X value", fontsize=14,fontproperties="SimHei")
plt.ylabel("Y value", fontsize=14,fontproperties="SimHei")
plt.show()
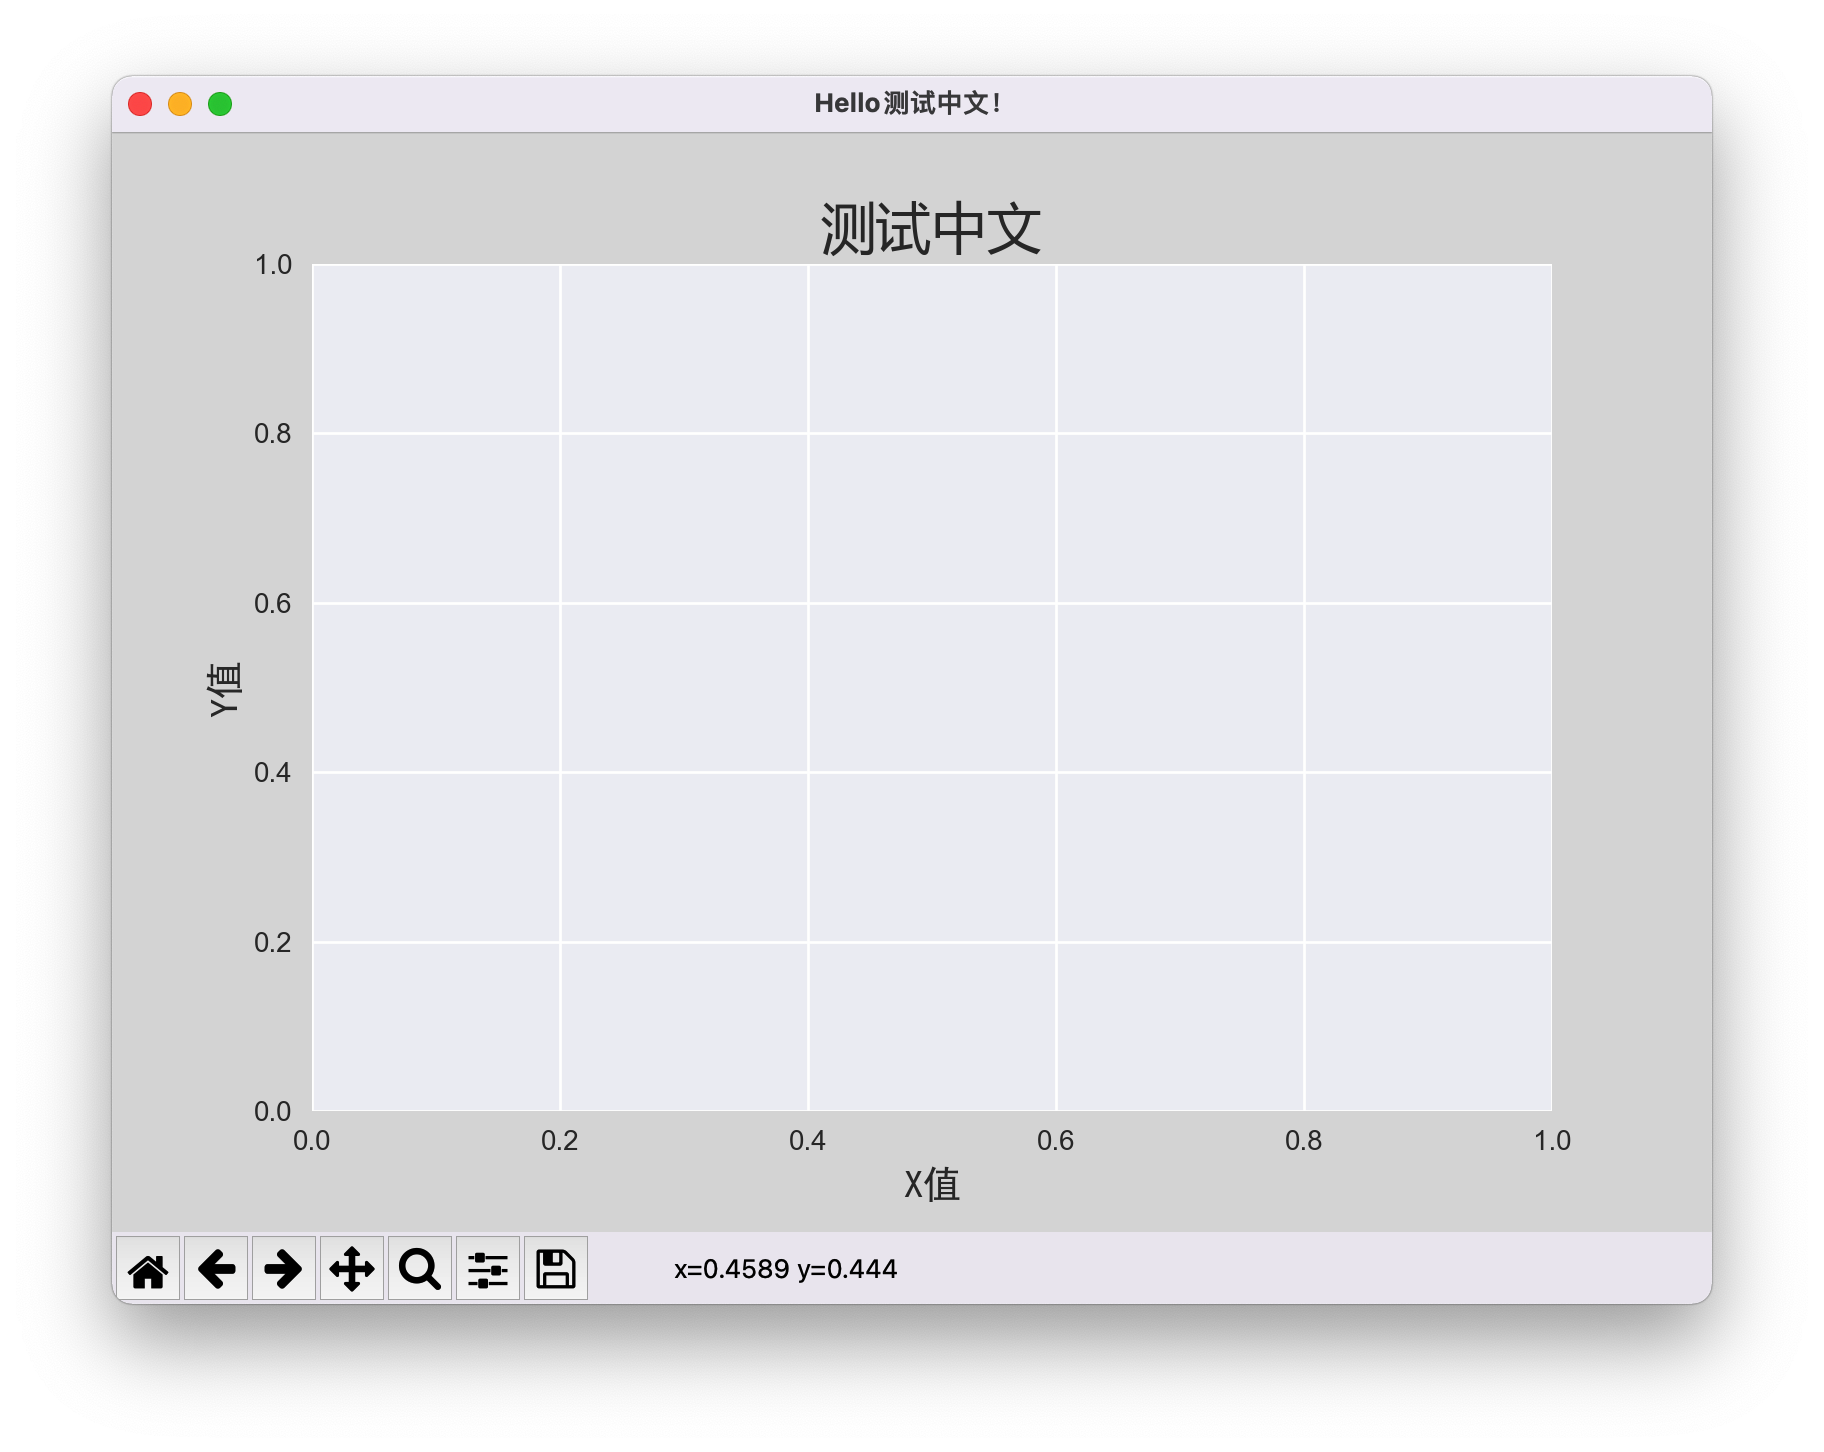 Chinese normal display (can be different fonts)
Method 4: FontProperties settings, non-global font modifications
This method requires three steps: importing the FontProperties module, setting the myfont variable, and specifying the font properties parameter. Although cumbersome, you can specify a font file in ttc format.
1. Import the FontProperties module: from matplotlib.font_manager import FontProperties
2. Set variable myfont = FontProperties(fname=r"/Library/Frameworks/Python.framework/Versions/3.10/lib/python3.10/site-packages/matplotlib/mpl-data/fonts/ttf/PingFang.ttc", size=14)
3. plt.title(), plt. Xlabel(), plt. In the ylabel() parameter setting, use fontproperties to specify the font as the variable myfont. (
import matplotlib.pyplot as plt
from matplotlib.font_manager import FontProperties    # Step One

input_values = [1, 2, 3, 4, 5, 6]
squares = [1, 4, 9, 16, 25, 36]
# Step 2
myfont = FontProperties(fname=r"/Library/Frameworks/Python.framework/Versions/3.10/lib/python3.10/site-packages/matplotlib/mpl-data/fonts/ttf/PingFang.ttc", size=14)

plt.style.use('seaborn')
fig, ax = plt.subplots()
ax.plot(input_values, squares, linewidth=3)
ax.set_title("Square Value", fontproperties=myfont)      # Step Three
ax.set_xlabel("value", fontproperties=myfont)        # Step Three
ax.set_ylabel("square-value", fontproperties=myfont)    # Step Three
ax.tick_params(axis='both', labelsize=14)

plt.show()
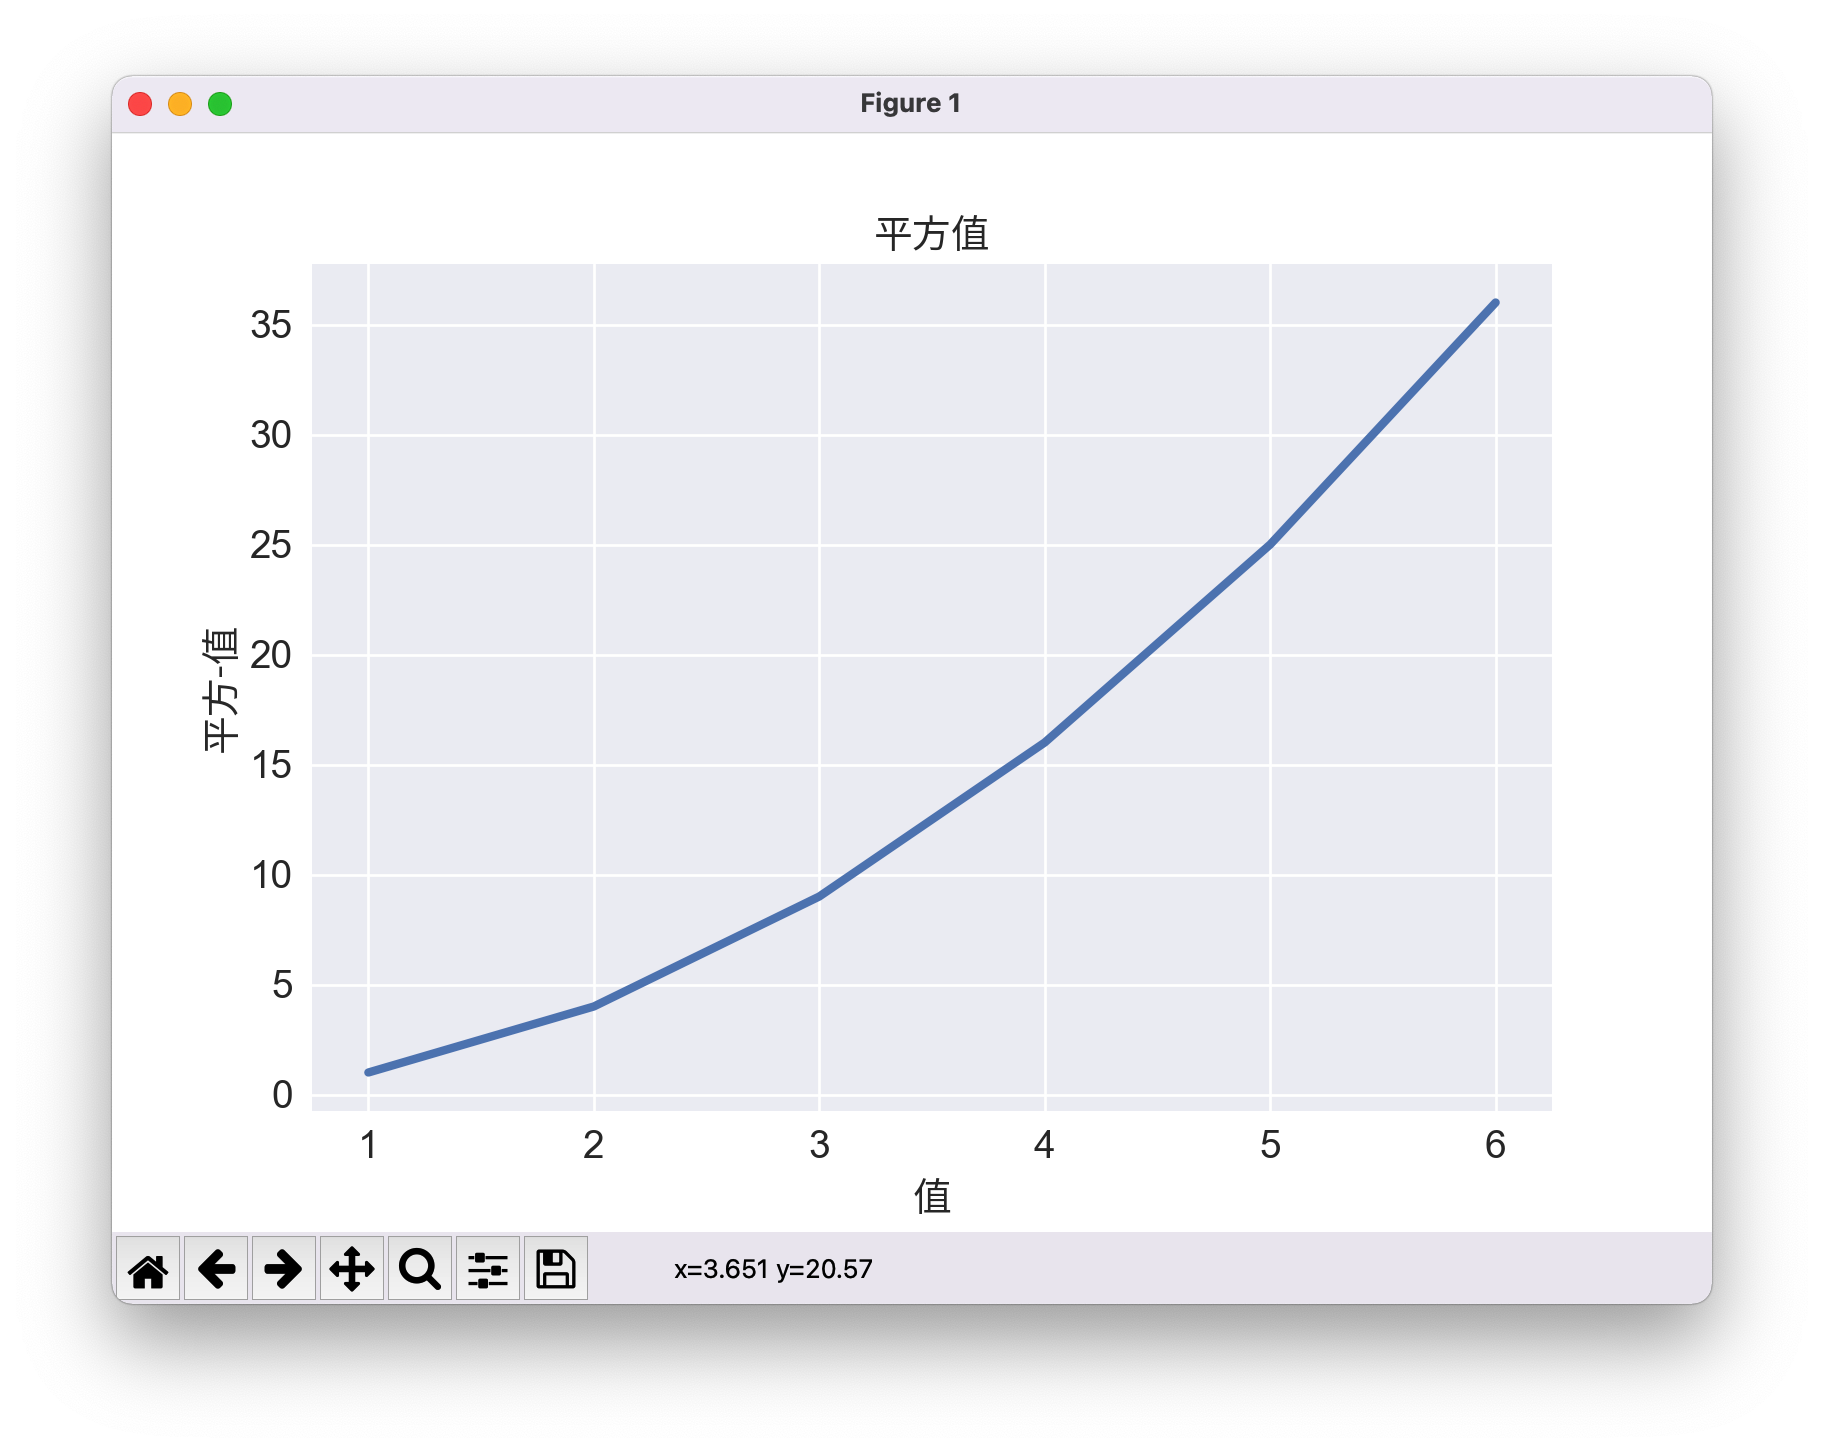 Normal display of specified fonts in Chinese
There is also a global font modification method set by rc, somewhat similar to method two. But if it doesn't work well after a try, it won't be written.