I've written Lego building block style content before. If you haven't seen it, you can click here,
python converts images into LEGO block style pictures (Part 1)
python converts images into LEGO block style pictures (Part 2)
Just recently, I have been engaged in numpy data processing and data conversion in various formats. I found that the use of various libraries is actually doing various data conversion, which is very interesting.
It suddenly occurred to me that I could change the picture processed by the previous pilot. After the change, the processing speed is much faster. As can be seen in yesterday's video, the response is still OK.
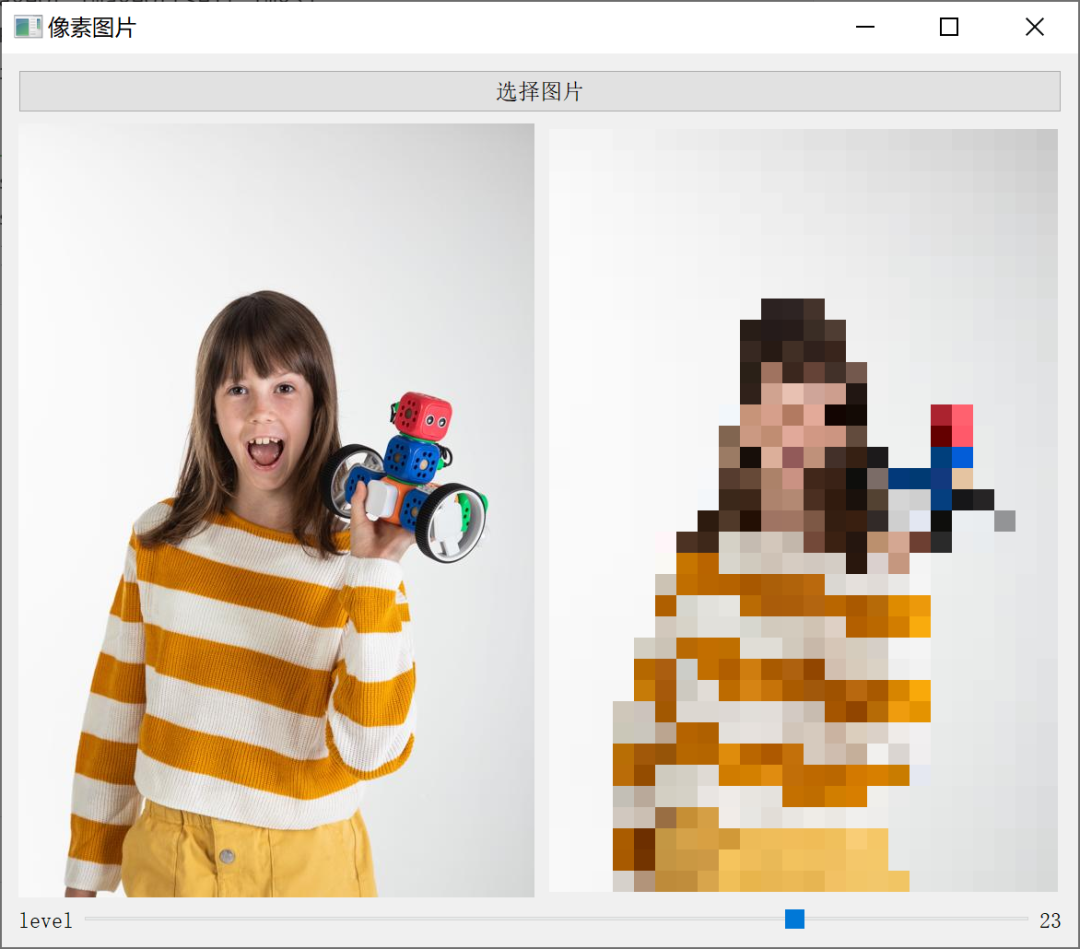
Let's talk about its implementation method. First, understand the implementation principle. After understanding the principle, the follow-up is promoted by solving various problems around this principle.
Mosaic picture principle
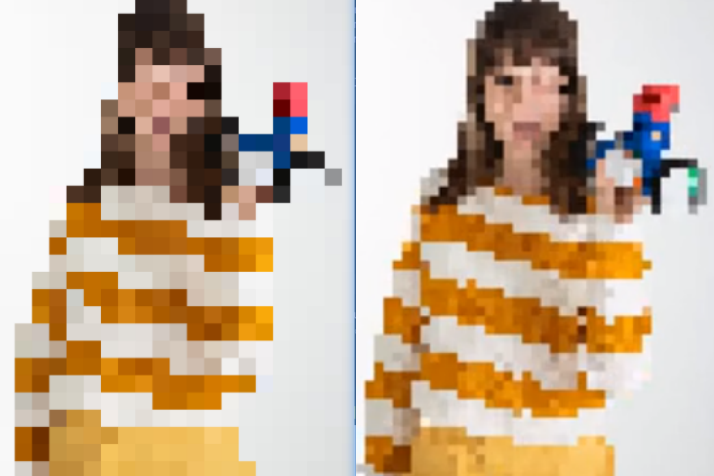
First look at the original picture and mosaic picture
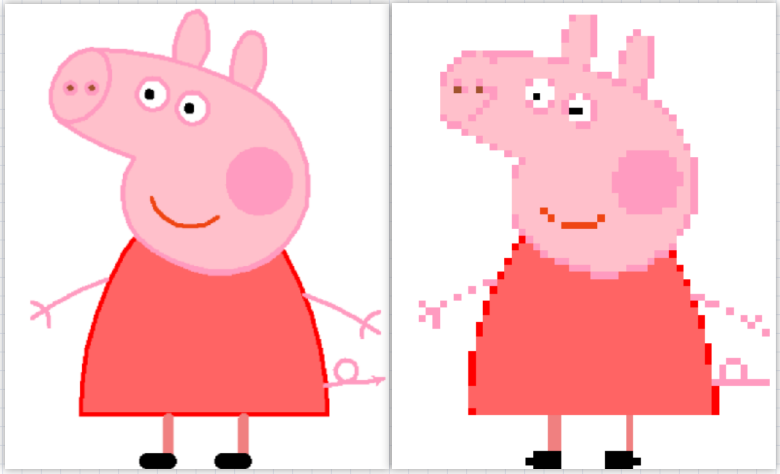
Original picture on the left and mosaic style picture on the right
Mosaic can be understood as replacing multiple color pixels in a small area with one color pixel. The actual pixel is very small. You need to enlarge the picture very much to see it, while mosaic pictures can see the grid effect without need. Here, the grid can be understood as a large pixel.
Obtain the area of a pixel block with multiple colors, and calculate which color pixel block is the most,
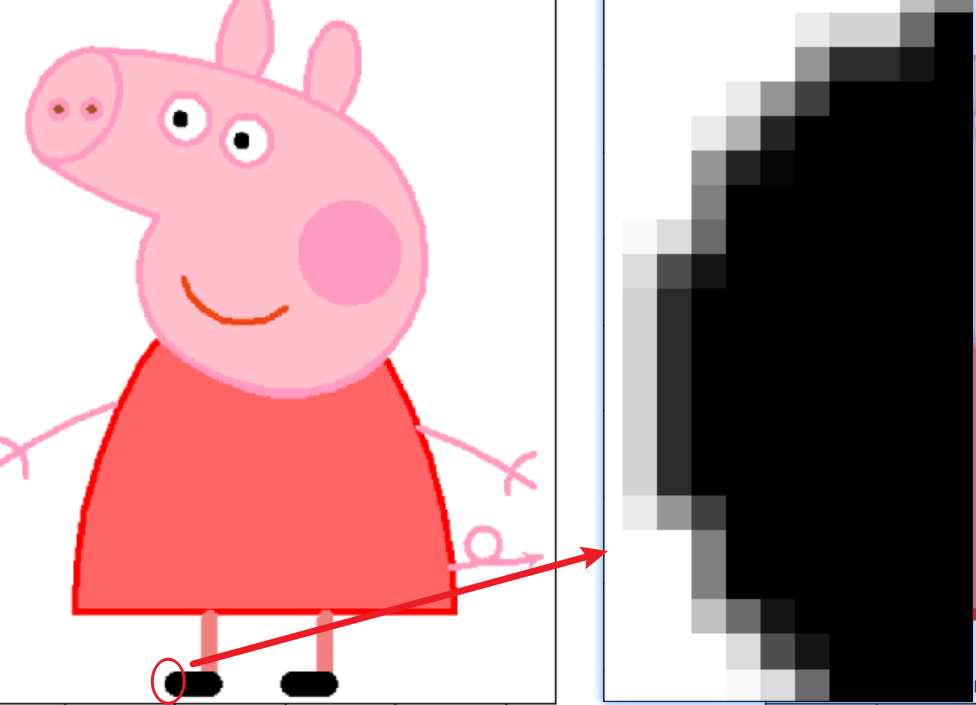
It can be seen that there are obviously the most black pixels here, so change all other non black pixels to black.
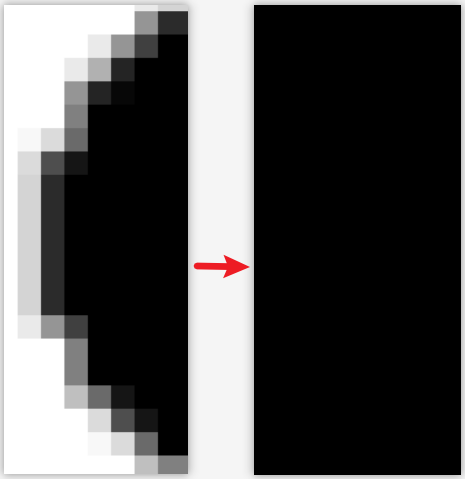
This is similar to Gaussian blur, but it's different.
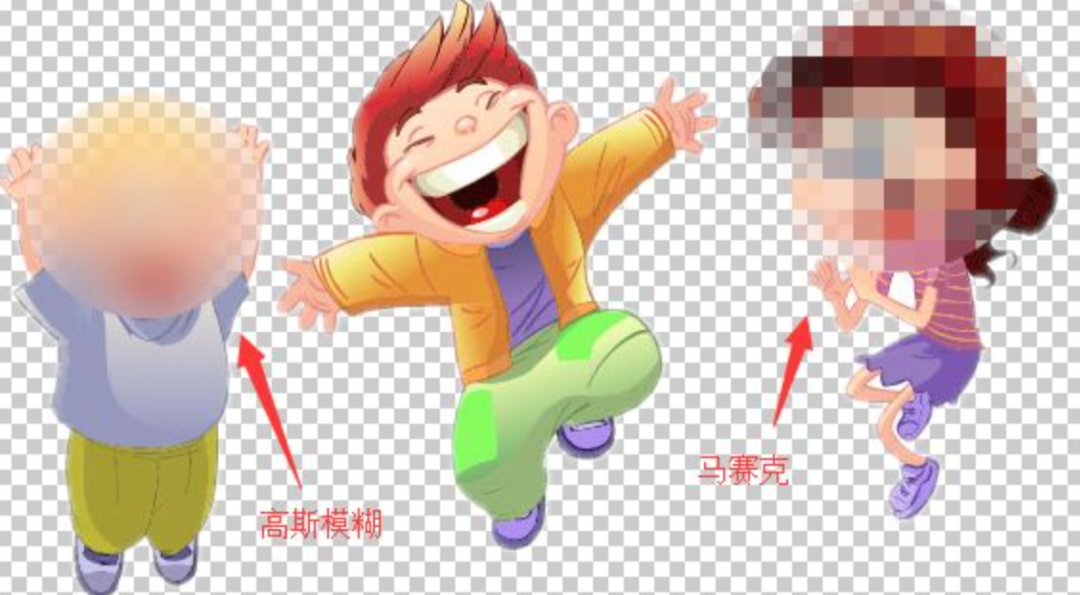
As mentioned earlier, mosaic can be understood as replacing multiple color pixels in a small area with one color pixel.

Here comes the problem,
1. How large area should we take?
2. How to judge which color has the most pixels in this area?
3. How to replace other pixels with the most color of the pixel?
First question:
Different size areas will lead to the mosaic degree of the picture, that is, the square size. The larger the area, the less clear it looks.
Here I will explain with a fixed size.
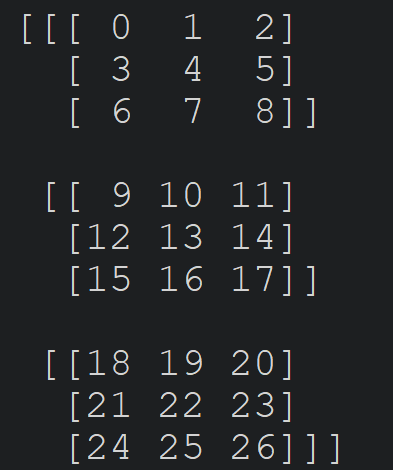
Create a three-dimensional data to represent a picture with width and height of 3 * 3.
import numpy as np
import collections
a = np.reshape(np.arange(27),(3,3,3))
print(a)
Second question:
How to judge which color has the most pixels in this area? To convert it into a programming problem is to count which tuple appears the most times in this three-dimensional list.
In python, the Counter method of the collections library can be used to count the number of occurrences of each element.
First, convert the 3D data into nested list data (Counter does not support multi-dimensional arrays).
b = np.reshape(a,(-1,3))
print(b.tolist())

Then convert the inner list into tuples, because counter does not support nested lists. A single element or tuple can be used.
c= [tuple(i) for i in b]
print(c)

Finally, the Counter method of collections is used to count the number of occurrences of each element. ()
count_dict = collections.Counter(c)
print(count_dict)
The result shows the statistical number of each element. Because they are the same, they are seen once.

Get the color tuple with the most occurrences through the index.
most_color = collections.Counter(c).most_common()[0][0]
print(most_color)

Through numpy's broadcast shortcut (automatically changing single-dimensional data into multi-dimensional data), all colors are changed into the color value with the most occurrences.
a[:,:,:] = most_color
print(a)
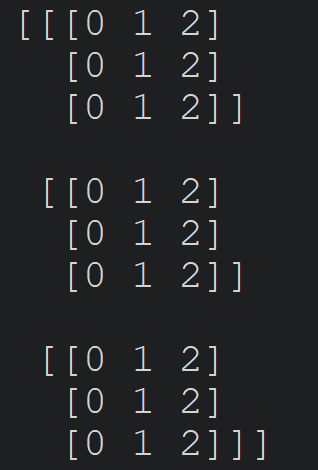
The results show that all colors have become the most common color.
The multidimensional data used above may not be easy to understand.
Next, I will change the data dimension into one-dimensional, and then understand the statistical process just now.
Suppose there is a list like this. It is required to count the number of occurrences of each element and print out the elements with the most occurrences.
l = [1,3,4,5,6,1,3,4,5,1,9,1,1,1]
Count the number of occurrences of the element:
import collections
l = [1,3,4,5,6,1,3,4,5,1,9,1,1,1]
count_dict = collections.Counter(l)
print(count_dict)
result:
Counter({1: 6, 3: 2, 4: 2, 5: 2, 6: 1, 9: 1})Get the most frequent element by index.
most_count = collections.Counter(l).most_common()[0][0]
print("The most frequent numbers are:",most_count)
In addition to using its own algorithm, of course, you can also write your own algorithm to count the number of occurrences of each element.
l = [1,3,4,5,6,1,3,4,5,1,9,1,1,1]
result = {}

for i in l:
    if i not in result:
        result[i]=1
    else:
        result[i]+=1

print(result)
result:

However, this is only to get the number of occurrences of each element. To know which element appears the most, you have to arrange it in order. However, the dictionary is unordered. For example, if I add a 5 in front of it, the result will be different.
l = [5,1,3,4,5,6,1,3,4,5,1,9,1,1,1]

But don't worry, you can convert it into a list and sort it well.
First, it is transformed into a list nested tuple structure by zip method.
t = list(zip(result.keys(),result.values()))
print(t)
result:

Next, I need to write a sorting algorithm. I'll be lazy, use my own soted method, and specify the second number for sorting.
print(sorted(t,key=lambda item: item[1], reverse=True))

It's easy to write one by yourself.
This is actually very useful, such as ranking according to the corresponding disciplines.
# Name, Chinese, mathematics, English
scores = [
    ['Small A', [25, 35, 75]],
    ['Small B', [65, 45, 50]],
    ['Small C', [15, 55, 10]],
    ['Small D', [50, 77, 57]],
    ['Small E', [100, 42, 9]]]
# Chinese score ranking
print(sorted(scores, key=lambda item: item[1][0], reverse=True))
# Mathematical score ranking
print(sorted(scores, key=lambda item: item[1][1], reverse=True))
# English score ranking
print(sorted(scores, key=lambda item: item[1][2], reverse=True))
The above is the implementation principle and how to replace it. The whole source code is given directly below.
Text code:
from PIL import Image
import matplotlib.pyplot as plt
import collections

def img_to_pixel(img_name, block_size):
    """
    img:image path
    block_size:pixel size
    """
    pic = Image.open(img_name)
    width, height = pic.size
    board = Image.new(
        "RGB", (width//block_size*block_size, height//block_size*block_size))
    # Loop processing pictures
    for y in range(0, height, block_size):
        for x in range(0, width, block_size):
            # Cut a picture at intervals
            temp = pic.crop((x, y, x+block_size, y+block_size))
            temp_list = list(temp.getdata())
            # Gets the largest number of pixel values
            max_color = collections.Counter(temp_list).most_common()[0][0]
            # Create a picture of the pixel value
            temp_past = Image.new("RGB", temp.size, max_color)
            # Paste picture
            board.paste(temp_past, (x, y))
    # Save to local
    board.save(f"{img_name[0:-4]}_pixel.jpg")
    # Returns the original image and pixel image
    return pic, board

if __name__ == "__main__":
    figure,axes = plt.subplots(1,2)
    # Write the name of the picture to be processed
    img_name = "girl.jpg"
    pic, board = img_to_pixel(img_name, 20)
    axes[0].imshow(pic)
    axes[1].imshow(board)
    board.save(f"{img_name[0:-4]}_pixel.jpg")
    plt.imshow(board)
    plt.show()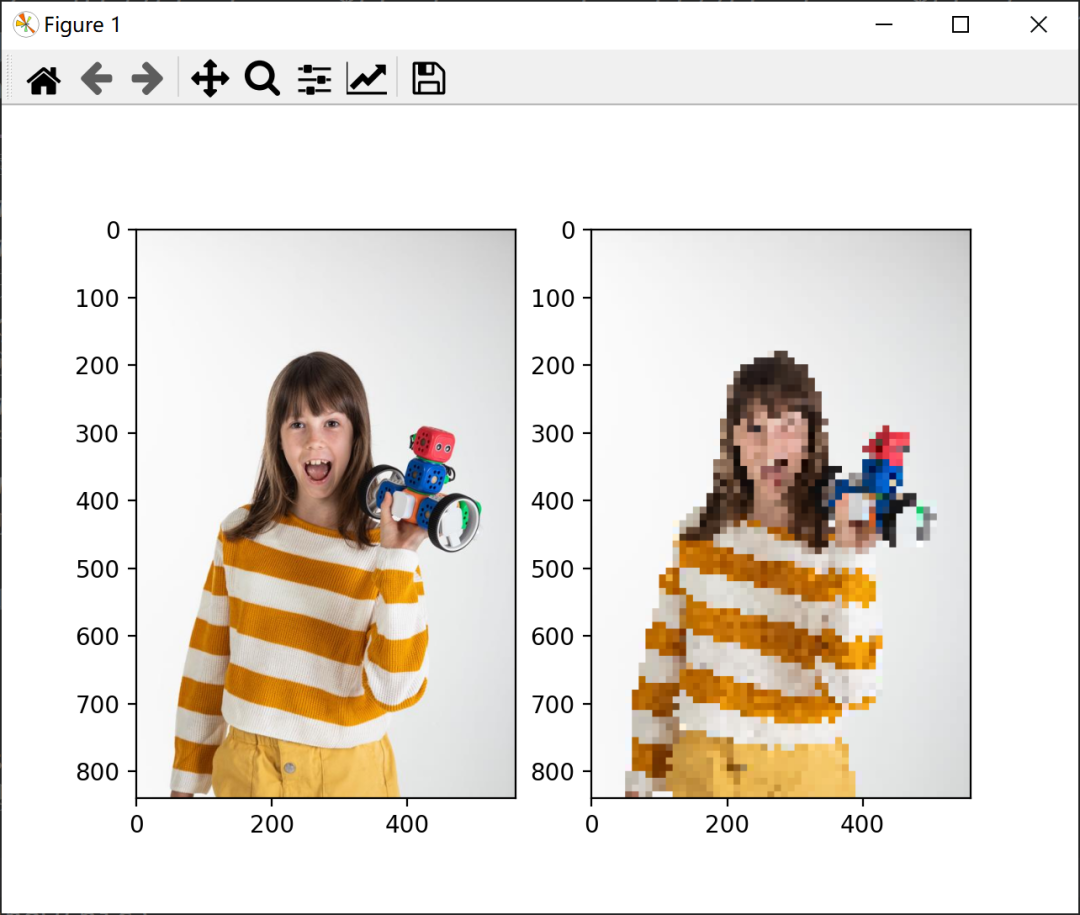
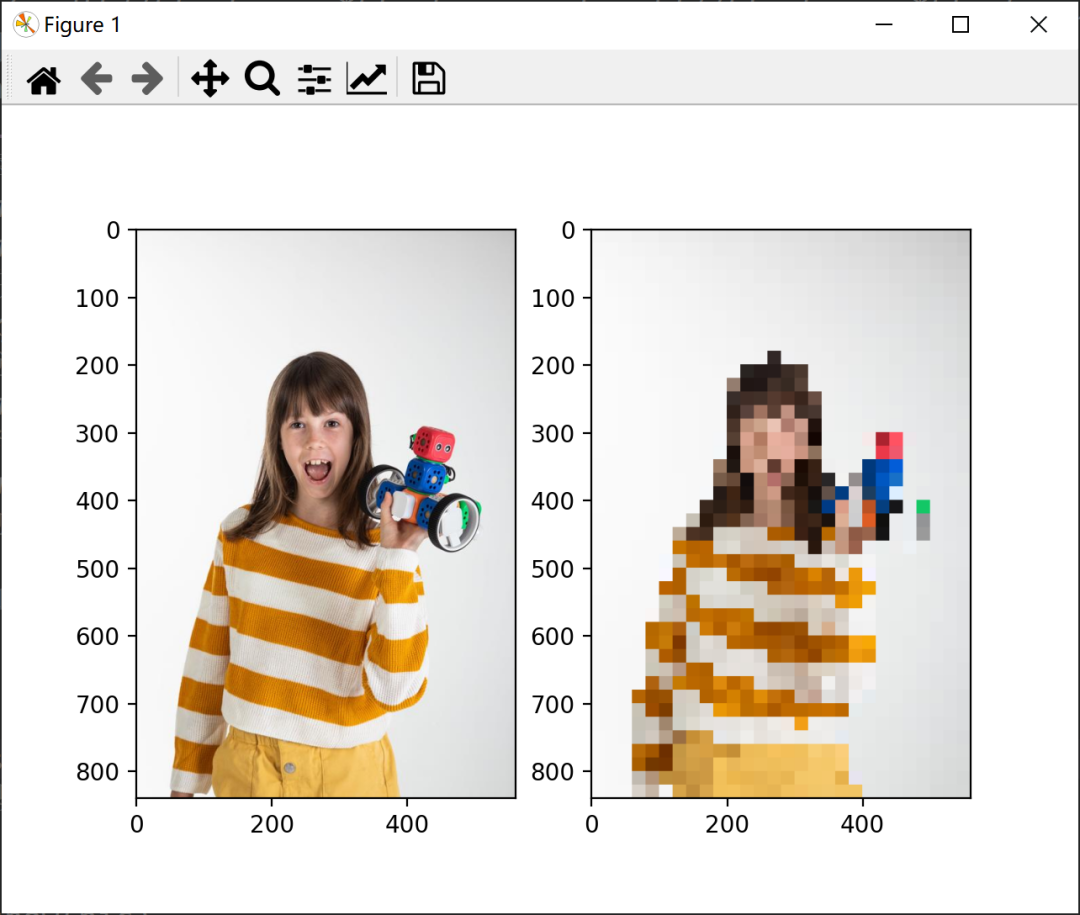
Increase the area:
pic, board = img_to_pixel(img_name, 20)
It can be seen that it is more unclear.
GUI version:
ui_image.py interface code
class Ui_Image(object):
    def setupUi(self, Image):
        Image.setObjectName("Image")
        Image.resize(483, 618)
        self.centralwidget = QtWidgets.QWidget(Image)
        self.centralwidget.setObjectName("centralwidget")
        self.verticalLayout_2 = QtWidgets.QVBoxLayout(self.centralwidget)
        self.verticalLayout_2.setObjectName("verticalLayout_2")
        self.pushButton = QtWidgets.QPushButton(self.centralwidget)
        self.pushButton.setObjectName("pushButton")
        self.verticalLayout_2.addWidget(self.pushButton)
        self.horizontalLayout_2 = QtWidgets.QHBoxLayout()
        self.horizontalLayout_2.setObjectName("horizontalLayout_2")
        self.label_5 = QtWidgets.QLabel(self.centralwidget)
        self.label_5.setAlignment(QtCore.Qt.AlignCenter)
        self.label_5.setObjectName("label_5")
        self.horizontalLayout_2.addWidget(self.label_5)
        self.label = QtWidgets.QLabel(self.centralwidget)
        self.label.setAlignment(QtCore.Qt.AlignCenter)
        self.label.setObjectName("label")
        self.horizontalLayout_2.addWidget(self.label)
        self.verticalLayout_2.addLayout(self.horizontalLayout_2)
        self.verticalLayout = QtWidgets.QVBoxLayout()
        self.verticalLayout.setObjectName("verticalLayout")
        self.horizontalLayout = QtWidgets.QHBoxLayout()
        self.horizontalLayout.setObjectName("horizontalLayout")
        self.label_3 = QtWidgets.QLabel(self.centralwidget)
        self.label_3.setObjectName("label_3")
        self.horizontalLayout.addWidget(self.label_3)
        self.slider = QtWidgets.QSlider(self.centralwidget)
        self.slider.setMinimum(1)
        self.slider.setMaximum(30)
        self.slider.setOrientation(QtCore.Qt.Horizontal)
        self.slider.setObjectName("slider")
        self.horizontalLayout.addWidget(self.slider)
        self.label_2 = QtWidgets.QLabel(self.centralwidget)
        self.label_2.setObjectName("label_2")
        self.horizontalLayout.addWidget(self.label_2)
        self.verticalLayout.addLayout(self.horizontalLayout)
        self.verticalLayout_2.addLayout(self.verticalLayout)
        Image.setCentralWidget(self.centralwidget)

        self.retranslateUi(Image)
        QtCore.QMetaObject.connectSlotsByName(Image)

    def retranslateUi(self, Image):
        Image.setWindowTitle(QtWidgets.QApplication.translate("Image", "Pixel picture", None, -1))
        self.pushButton.setText(QtWidgets.QApplication.translate("Image", "Select Picture", None, -1))
        self.label_5.setText(QtWidgets.QApplication.translate("Image", "Original drawing", None, -1))
        self.label.setText(QtWidgets.QApplication.translate("Image", "After treatment", None, -1))
        self.label_3.setText(QtWidgets.QApplication.translate("Image", "level", None, -1))
        self.label_2.setText(QtWidgets.QApplication.translate("Image", "0", None, -1))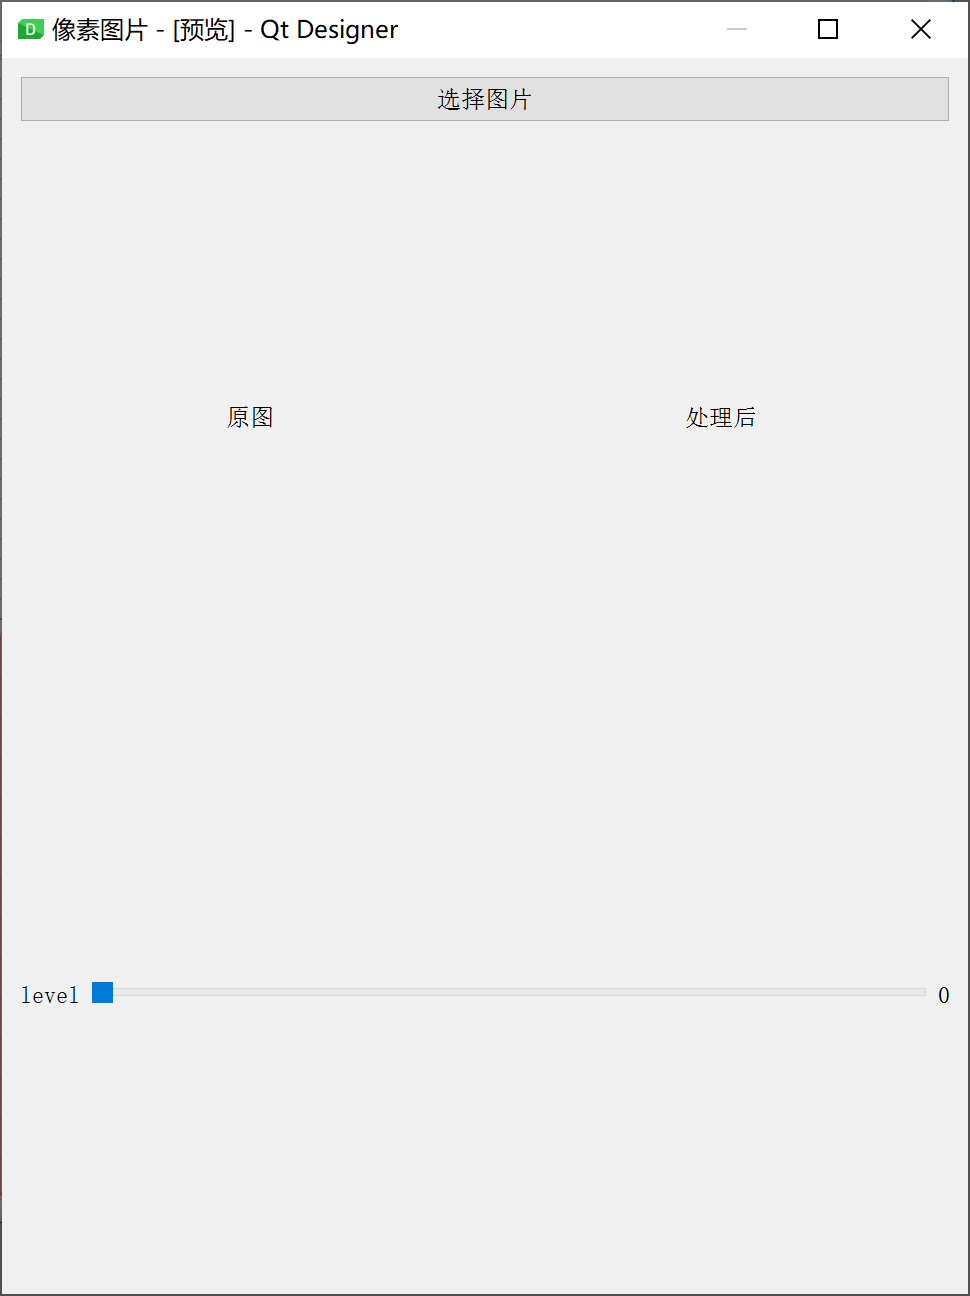
mian.py main program code
import sys
from PySide2.QtWidgets import *
from PySide2.QtGui import *
from PySide2.QtCore import *
from ui_image import Ui_Image
from PIL import Image, ImageQt
import numpy as np
import collections
from PySide2 import QtCore, QtGui, QtWidgets

class ImageProcess(QMainWindow, Ui_Image):
    def __init__(self):
        super().__init__()
        self.setupUi(self)
        self.show()
        self.slider.setValue(1)
        self.label_2.setText("1")
        self.pushButton.clicked.connect(self.select_image)
        self.slider.valueChanged.connect(self.display_image)

    def select_image(self):
        # Opens the file selection dialog box
        self.file = QFileDialog.getOpenFileName(
    caption="Select Picture", filter="*.jpg *.png")[0]
        print(self.file)
        imgobj = QPixmap(self.file)
        self.label_5.setPixmap(imgobj)
        self.label_5.setScaledContents(True)

    def img_to_pixel(self,img_name, block_size):
        """
        img:image path
        block_size:pixel size
        """
        pic = Image.open(img_name)
        width, height = pic.size
        pic = np.array(pic)
        board = Image.new("RGB", (width//block_size*block_size, height//block_size*block_size))
        board = np.array(board)
        # Loop processing pictures
        for y in range(0, height, block_size):
            for x in range(0, width, block_size):
                # Cut a picture at intervals
                temp = pic[y:y+block_size,x:x+block_size,:]
                # 3D to 2D
                b = np.reshape(temp,(-1,3))
                # Convert inner list to tuple
                c=[tuple(i) for i in b]
                # Gets the largest number of pixel values
                max_color = collections.Counter(c).most_common()[0][0]
                # Change the original color to the maximum value
                board[y:y+block_size,x:x+block_size,:]= max_color
        # Returns an array of original images and pictures
        return pic, board

    def display_image(self):
        self.block_size = self.slider.value()
        self.label_2.setText(str(self.block_size))
        _,self.board = self.img_to_pixel(self.file,self.block_size)
        self.img3 = Image.fromarray(self.board)
        self.imgqt = ImageQt.ImageQt(self.img3)
        self.newimg = QPixmap.fromImage(self.imgqt)
        self.label.setPixmap(self.newimg)

if __name__ == "__main__":
    app = QApplication(sys.argv)
    window = ImageProcess()
    sys.exit(app.exec_())